 🏷️ Likely Rental
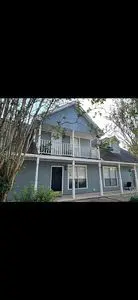
2707 Rue Street Martin Apt A · Hammond, LA
Flood risk 1/10 · Minimal
- FEMA flood zone
- X (unshaded)
- Chance of flooding over 30 yrs
- 0.0%
- Est. flood insurance / yr
- $507 – $1,088
Fire risk 4/10 · Minor
- Est. fire insurance / yr
- $1,269 – $2,357
Heat risk 8/10 · Major
- Hot days now (above 109°F)
- 7 days/yr
- Hot days in 30 yrs
- 20 days/yr
Wind risk 9/10 · Severe
- Chance of severe wind over 30 yrs
- 99.0%
Air-quality risk 2/10 · Minimal
- Unhealthy air days now
- 0 days/yr
- Unhealthy air days in 30 yrs
- 1 days/yr
Risk factors via First Street. Map © Google.
Why this score? — see what drove the B+ grade
The composite is a weighted blend of 9 inputs, each scored 0–100. Each bar is that input's sub-score; the figure is the points it added to the 100-point composite (weight × sub-score).
- Cash flow +30.0/30.0
- ARV discount +15.0/15.0
- 1% rule +10.0/10.0
- DSCR +10.0/10.0
- Livability +3.5/5.0
- Rent growth +2.6/5.0
- Schools +2.0/10.0
- Condition / age +2.0/5.0
- Appreciation +0.0/10.0
$89,000
🖨 Deal sheet 📄 Offer letter ✓ Due diligence
Listing remarks
Condo for sale in quiet Villa West Hammond. The one listed is the unit in the middle with the balcony. The unit is around 1,100 square feet, 2 bedroom, 1.5 bath. I have rented it for $950 for the past 13 months. Current tenant just moved out because he bought his own home. The unit has a new ac, around 1 year old. New hot water heater, also around 1 year old. New windows, and new flooring on stairs and upstairs has all new luxury vinyl plank. Nothing needs to be done to rent it out again. Reason for selling is I am moving to Baton Rouge to attend law school in the fall. I do not need to sell, but the extra capital would be helpful for my time over there. Minutes from the mall and all amenit
Key facts
- Luxury vinyl plank
- Balcony
- New flooring
Tags
Neighborhood map
What this means for you Summary
Snapshot
- This is a 2-bed/1.5-bath single-family listed at $89k. Condition is rated fair.
Deal economics
- At list price, monthly cash flow is $593 ($7k/yr) — positive.
- The deal already cash-flows at list — no discount required.
- Meets the 1% rule at list price ($2k rent vs $89k).
- Cap rate 14.3% vs local median 5.0% in Hammond — top-decile yield for the area; either an underpriced asset or a hidden risk that comps aren't pricing in. Stress-test before assuming the spread holds.
Location & tenants
- Location reads 69/100 on livability (#77 in LA) — a middle-class / working-renter tenant base. Strengths: cost of living A+, health & safety A+; Watch: amenities C-, commute D+, schools D.
- Tangipahoa Parish (rural): math 18% / reading 29% proficiency, ranked #63 of 98 in LA (top 64%) — low school quality limits family demand, transient renter base, plan for 1-2y turnover; 73% free/reduced lunch — lower-income household profile, screen leases tightly.
- Market conditions: Rents flat; 329 active listings in the ZIP; 17 comparable units currently listed for rent nearby; rentals lingering (median 44d on market — plan ~5-8 weeks vacancy on turnover, expect pricing pressure); 100% of comp listings sitting > 30 days — soft ceiling on asking rent; 1,085 units permitted in Tangipahoa Parish in 2024 (378 in 5+ unit buildings).
- This rent runs 36% of the median local income ($51k/yr) — at the standard rent-burdened threshold; future hikes will face affordability resistance.
Forward outlook
- Local home prices are declining (-3.0%/yr); year-one equity from $615 of loan paydown is wiped out by about $3k of value loss. Plan a longer hold.
- Tangipahoa County population projected at +22% by 2050 — long-run rental-demand tailwind backs the buy-and-hold thesis.
- At projected returns (-3.0% appreciation + 0.3% rent growth), your $25k cash investment doubles in ~5 years — after that, you're playing with house money.
Negotiation context
- Only 12 days on market — expect competitive offers; lowballing is unlikely to land.
Risks & watch-outs
- Climate carrying-cost: severe wind risk, 99% chance of damaging wind over 30y; extreme-heat days projected 7→20/yr by 2055 (HVAC capex compounding) — expect insurance premiums to compound above CPI over the hold.
Questions for the listing agent
- Have any recent inspections been done? Can we get a copy of the seller's disclosures and any deferred-maintenance estimates?
- Is there a deadline driving the sale (1031 exchange, divorce, estate, relocation)? That informs how much negotiation room exists.
- Schools are D-rated, which usually means shorter tenancies and higher turnover. Who's the typical renter profile here, and what's been the actual vacancy rate?
- Crime grade is F in this area — have there been break-ins, vandalism, or insurance claims at this property in the last 3 years? What carrier currently insures it and at what premium?
- What's the average days-on-market for RENTAL listings here right now (not sales)? A rising rental-DOM trend means longer vacancies and softer asking-rent achievability than the comps imply.
- What's the recent tenant-quality profile in this submarket — average credit score on applications, eviction rate, late-payment / NSF rate, and stable-employment percentage? A property-management company in the area should have these aggregated.
- How much new for-sale + rental construction is in the pipeline within 1–3 miles? Heavy new supply typically softens prices + rents 12–24 months out; constrained supply supports both.
Investment metrics
- 1% rule
- 1.72% ✓
- Cap rate
- 14.29%
- Cash-on-cash
- 28.54%
- DSCR
- 2.27
- GRM
- 4.9
CMA / ARV
- ARV (on-the-fly)
- $163,200
- Comps found
- 12
Show comp detail 12 sales within ~0.75 mi
| Address | Dist | Beds/Ba | Sqft | Sold | Price | $/sf | Match |
|---|---|---|---|---|---|---|---|
| 506 E Church St | 0.37mi | 3/1.0 (+1) | 1,174 (-2%) | 7mo | $49,000 | $42 | 66 |
| 1010 W Charles St | 0.69mi | 3/2.0 (+1) | 1,190 (-1%) | 1mo | $182,000 | $153 | 59 |
| 303 E Park Ave | 0.40mi | 2/2.0 | 1,128 (-6%) | 14mo | $185,000 | $164 | 58 |
| 803 S Chestnut St | 0.68mi | 3/1.0 (+1) | 1,133 (-6%) | 2mo | $155,000 | $137 | 50 |
| 703 Edwin Neill Way | 0.50mi | 2/2.0 | 1,375 (+15%) | 3mo | $82,500 | $60 | 48 |
| 801 S Chestnut St | 0.67mi | 3/1.0 (+1) | 1,235 (+3%) | 13mo | $135,000 | $109 | 46 |
| 200 Cotton Ln | 0.73mi | 3/2.0 (+1) | 1,275 (+6%) | 10mo | $215,000 | $169 | 40 |
| 1005 E Thomas St | 0.65mi | 3/1.0 (+1) | 1,365 (+14%) | 1mo | $110,000 | $81 | 39 |
| 910 S Holly St | 0.66mi | 3/1.5 (+1) | 1,324 (+10%) | 11mo | $189,000 | $143 | 38 |
| 707 E Louisiana Ave | 0.72mi | 3/2.0 (+1) | 1,028 (-14%) | 1mo | $140,000 | $136 | 35 |
| 305 Noah James Dr | 0.67mi | 2/1.0 | 1,030 (-14%) | 14mo | $120,000 | $117 | 31 |
| 805 E Illinois St | 0.72mi | 3/1.0 (+1) | 1,041 (-13%) | 12mo | $112,500 | $108 | 28 |
Match score weights: distance 35% · size 25% · config 20% · recency 20%. Top-matched comps best support the ARV.
Projected returns pro-forma
-3.0% appreciation · 0.33% rent growth · sell at horizon
- IRR
- 19.8%
- Equity multiple
- 1.78×
- Total profit
- $19,354
- Equity at exit
- $13,270
- IRR
- 26.1%
- Equity multiple
- 3.01×
- Total profit
- $49,999
- Equity at exit
- $7,695
Cash invested: $24,920 (down + closing). Projections, not guarantees.
Landlord ↔ Tenant lean methodology
- Overall (STATE)
- 90 Strongly Landlord-Friendly
- State Louisiana
- 90 Strongly Landlord-Friendly · R+12
- County
- — inherits STATE
- City
- — inherits STATE
ZIP-level market 70403
- Home prices YoY
- -34.1%
- Rents YoY
- 0.3%
- Active inventory
- 329
- Price-to-rent
- 4.9×
Monthly cashflow live
- Estimated rent
- $1,529 high interval (Pro) →
- Mortgage (P&I)
- −$467
- Tax est. 1.5%
- −$111 /mo · $1,335/yr
- Insurance
- −$37
- HOA
- −$0
- Vacancy / Maint / Mgmt
- −$321
- Net cashflow
- $593
Break-even live
UW: 25.0% down · 7.5% · 30yr · 1.5% tax · 5.0% vac · 8.0% maint · 8.0% mgmt
Financing live
Cash to close
- Down payment
- $22,250
- Closing costs
- $2,670
- Reserves months
- —
- Total cash needed
- —
Loan-product check · same deal, 3 products live
Conventional
25% down · 7.5% · 30yr
- Down + closing
- —
- Monthly P&I
- —
- Monthly cashflow
- —
- DSCR
- —
- Eligible?
- —
Personal DTI + credit; lowest rate.
DSCR
20% down · 8.5% · 30yr
- Down + closing
- —
- Monthly P&I
- —
- Monthly cashflow
- —
- DSCR
- —
- Eligible?
- —
No personal income docs; deal must DSCR.
Hard money
10% down · 12.0% · 12mo
- Down + closing
- —
- Monthly P&I
- —
- Monthly cashflow
- —
- DSCR
- —
- Eligible?
- —
Short-term bridge; refi at stabilization.
Rent comps 17 comps
| Address | Beds | Baths | Sqft | Rent | $/sqft | DOM | Units | Dist |
|---|---|---|---|---|---|---|---|---|
| 100 S Cypress St Hammond, LA | 2.0 | 2.5 | 1100 | $1,750 | $1.59 | 43d | 1 | 0.08mi |
| 221 W Thomas St Unit A Hammond, LA | 3.0 | 1.0 | 1400 | $2,050 | $1.46 | 43d | 1 | 0.14mi |
| 402 S Cherry St Hammond, LA | 3.0 | 2.0 | 1400 | $1,700 | $1.21 | 43d | 1 | 0.26mi |
| 202 S Chestnut St Hammond, LA | 1.0 | 1.0 | 750 | $1,075 | $1.43 | 43d | 1 | 0.42mi |
| 408 E Michigan St Hammond, LA | 2.0 | 1.0 | 1222 | $1,350 | $1.10 | 43d | 1 | 0.42mi |
| 207 S Laurel St Unit B Hammond, LA | 3.0 | 2.0 | 1100 | $1,350 | $1.23 | 43d | 1 | 0.62mi |
| 1002 S Pine St Hammond, LA | 3.0 | 2.5 | 1324 | $1,500 | $1.13 | 43d | 1 | 0.68mi |
| 204 W Clark St Hammond, LA | 2.0 | 1.0 | 840 | $900 | $1.07 | 43d | 1 | 0.90mi |
| 309 Hewitt Rd Unit B Hammond, LA | 2.0 | 1.0 | 806 | $1,350 | $1.67 | 43d | 1 | 0.98mi |
| 1600 Bauerle Rd Hammond, LA | 1.0–2.0 | 1.0–2.0 | 884 | $1,751 | $1.98 | 43d | 4 | 1.12mi |
| 209 Dixie Dr Hammond, LA | 3.0 | 1.0 | 1100 | $1,150 | $1.05 | 43d | 1 | 1.15mi |
| 141 Clinton Ct Unit B Hammond, LA | 2.0 | 1.0 | 800 | $800 | $1.00 | 43d | 1 | 1.18mi |
| 308 Alexander Dr Hammond, LA | 3.0 | 2.0 | 1193 | $1,390 | $1.17 | 43d | 1 | 1.19mi |
| 44347 Simpson Pl Unit 1 Hammond, LA | 2.0 | 1.0 | 960 | $950 | $0.99 | 43d | 1 | 1.24mi |
| 1407 Hooks Dr Unit B Hammond, LA | 2.0 | 1.0 | 838 | $1,000 | $1.19 | 43d | 1 | 1.26mi |
| 12 Whitmar Dr Unit 9 Hammond, LA | 2.0 | 1.5 | 1238 | $1,300 | $1.05 | 43d | 1 | 1.32mi |
| 1815 Western Ave Unit 7 Hammond, LA | 2.0 | 1.0 | 875 | $950 | $1.09 | 43d | 1 | 1.50mi |
Listing history 13 events
-
2026-06-19days on market $89,000 Active 12 DOM
-
2026-06-18days on market $89,000 Active 11 DOM
-
2026-06-17days on market $89,000 Active 10 DOM
-
2026-06-16days on market $89,000 Active 9 DOM
-
2026-06-15days on market $89,000 Active 8 DOM
-
2026-06-14days on market $89,000 Active 6 DOM
-
2026-06-13days on market $89,000 Active 5 DOM
-
2026-06-10days on market $89,000 Active 3 DOM
-
2026-06-09days on market $89,000 Active 2 DOM
-
2026-06-07days on market $89,000 Active 1 DOM
-
2026-06-05days on market $89,000 Active 2 DOM
-
2026-06-03remarks 699-char remark
-
2026-06-03$89,000 Active 1 DOM
ⓘ Source: listings_history table (triggers on properties + properties_extension) + one-shot
backfill from property_details.listing_events for pre-trigger history.
Climate risk First Street
- Flood 1/10 Low FEMA zone X (unshaded) · 0% chance over 30 yrs
- Wildfire 4/10 Moderate
- Heat 8/10 Severe 7 d/yr ≥109°F today · 20 d/yr by 30 yrs out
- Wind 9/10 Extreme 99% chance of damaging wind over 30 yrs
- Air quality 2/10 Low 0 unhealthy d/yr today · 1 by 30 yrs out
Nearby sold comps map
Loading sold comps map…
Walkable amenities ~0.75 mi
Loading nearby amenities…
Taxation est. · year 1
- Rental income
- $18,347
- − Mortgage interest
- −$4,985
- − Property taxes
- −$1,335
- − Insurance
- −$445
- − Repairs & maintenance
- −$1,468
- − Management
- −$1,468
- − Depreciation
- −$2,589
- Taxable income
- $6,057
- Est. tax owed @ 24.0%
- −$1,454
- After-tax cash flow
- $5,660/yr
For passive investors: Depreciation is non-cash, so a rental often shows a tax loss while cash-flowing — sheltering income. Rental losses are passive: they offset passive income freely, and up to $25,000/yr can offset ordinary (W-2) income if you actively participate and your MAGI is under $100k (phasing out to $0 by $150k); unused losses carry forward. On sale, claimed depreciation is recaptured at up to 25%, and gains may owe capital-gains tax (a 1031 exchange can defer both). Figures are a year-1 estimate at your 24.0% rate — not tax advice; consult a CPA.
Condition & rehab AI · 0 photos
The home is in fair condition with cosmetic updates needed. It has new flooring and HVAC, but requires some interior and exterior touch-ups to enhance its resale and rental value.
Repairs flagged
- Minor kitchen — No visible damage or wear, but the photos do not show the kitchen in detail.
- Minor bathrooms — No visible damage or wear, but the photos do not show the bathrooms in detail.
- Minor roof — No visible damage or wear, but the photos do not show the roof in detail.
- Minor exterior — No visible damage or wear, but the photos do not show the exterior in detail.
- Minor interior walls — No visible damage or wear, but the photos do not show the interior walls in detail.
- Minor landscaping — No visible damage or wear, but the photos do not show the landscaping in detail.
Value-add opportunities
- Both paint interior walls — Fresh paint can improve the home's appearance and appeal to potential buyers or renters.
- Both landscape and improve curb appeal — A well-maintained exterior can significantly boost the home's curb appeal and value.
Renovation cost estimate screening
| Repair item | Severity | Est. cost |
|---|---|---|
| kitchen · No visible damage or wear, but the photos do not show the kitchen in detail. | Minor | $500–3,000 |
| bathrooms · No visible damage or wear, but the photos do not show the bathrooms in detail. | Minor | $500–3,000 |
| roof · No visible damage or wear, but the photos do not show the roof in detail. | Minor | $500–3,000 |
| exterior · No visible damage or wear, but the photos do not show the exterior in detail. | Minor | $500–3,000 |
| interior walls · No visible damage or wear, but the photos do not show the interior walls in detail. | Minor | $500–3,000 |
| landscaping · No visible damage or wear, but the photos do not show the landscaping in detail. | Minor | $500–3,000 |
| Total estimated repair cost · 6 items | $3,000–18,000 |
Value-add ROI direction
- Both paint interior walls — Fresh paint can improve the home's appearance and appeal to potential buyers or renters. ↑
- Both landscape and improve curb appeal — A well-maintained exterior can significantly boost the home's curb appeal and value. ↑
ⓘ Cost ranges are severity-bucket heuristics (US national rule-of-thumb). Get contractor quotes + a written scope before underwriting a rehab budget.
Schools (NCES district)
- District
- Tangipahoa Parish
- NCES district ID
- 2201680
- Math proficiency
- 18% ▼ -32.00%
- Reading proficiency
- 29% ▼ -31.00%
- Median HH income
- $41,283
- Composite
- 19.94/100
- National rank
- #8676
- State rank
- #63 of 98 in LA
Livability — Hammond
- Score
- 69/100
- State rank
- #77
- US rank
- #8868
Category grades
Schools grade is shown separately in the Schools card above.
Census & demographics
- Census place
- Hammond, LA
- County
- Tangipahoa Parish · 85,958 people
- City population
- 51,394
- Metro
- Hammond, LA
- Population (ZIP)
- 30,173
- Household income
- $50,976
- Rent vs Own
- Severe rent burden
- 1201.0
Population outlook (Tangipahoa County) Hauer SSP2
- Today (2025)
- 144,204 people
- By 2030
- 151,413 · +5.0%
- By 2040
- 164,374 · +14.0%
- By 2050
- 175,427 · +21.7%
- By 2075
- 195,165 · +35.3%
- By 2100
- 201,641 · +39.8%
Race, ethnicity, and origin ACS 2023
- Neighborhood character
- Diverse neighborhood (Simpson 0.56)
- Race & ethnicity
- White 55% Black 37% Hispanic / Latino 6% Two or more races 6%
- Hispanic origin (detail)
- Mexican 3%
- Common ancestry
- Lithuanian 9% Serbian 1% Slovak 1%
- Foreign-born
- 3% · Canada
- Languages at home
- 95% English-only · Spanish 4% Arabic 1%
Political lean MEDSL · Tangipahoa
- 2024 margin
- Solid R (+37.4) · D 30.6% · R 68.0% · Other 1.3%
- 2008→2024 swing
- -6.5pp toward R · 2008: -30.9pp · 2024: -37.4pp
- All cycles
- 2024: R+37.4 2020: R+32.8 2016: R+32.6 2012: R+27.7 2008: R+30.9
Not yet ingested
- Civics
- —
Market trends
- HPI YoY
- ▼ -66.04%
- Current HPI
- 127.4535
- Rent YoY
- ▲ 0.33%
- Metro
- Hammond, LA
- State GDP YoY
- ▲ 3.29%
- F500 in state
- 10
Industry mix (Fortune 500 HQ in LA)
| Industry | F500 HQs | Revenue |
|---|---|---|
| Telecommunications | 2 | $23B |
|
||
| Utilities | 1 | $12B |
|
||
| Wholesale / Distribution | 1 | $5B |
|
||
| Advertising | 1 | $2B |
|
||
Price history
1 event — show timeline
- 2026-06-03 Listed $89,000 FSBO.com
Cash-flow waterfall
monthlySold comps — $/sqft
last 12 mo · ≤1 miLoading sold comps…