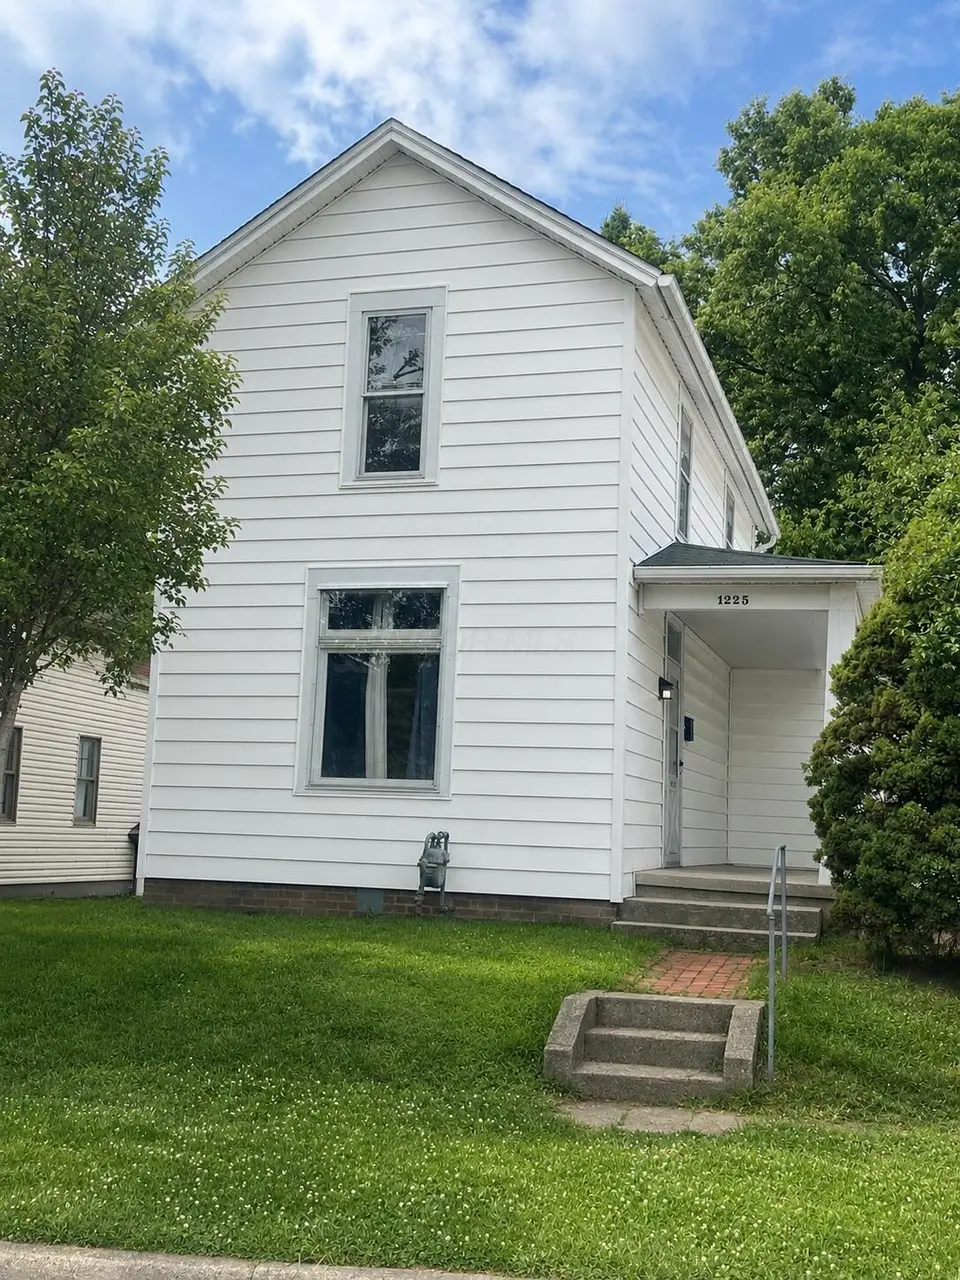
1225 E Chestnut St · Lancaster, OH
Flood risk 1/10 · Minimal
- FEMA flood zone
- X (unshaded)
- Chance of flooding over 30 yrs
- 0.0%
- Est. flood insurance / yr
- $473 – $860
Fire risk 1/10 · Minimal
- Est. fire insurance / yr
- $713 – $1,323
Heat risk 4/10 · Minor
- Hot days now (above 100°F)
- 7 days/yr
- Hot days in 30 yrs
- 19 days/yr
Wind risk 2/10 · Minimal
- Chance of severe wind over 30 yrs
- 1.0%
Air-quality risk 2/10 · Minimal
- Unhealthy air days now
- 1 days/yr
- Unhealthy air days in 30 yrs
- 2 days/yr
Risk factors via First Street. Map © Google.
Why this score? — see what drove the C- grade
The composite is a weighted blend of 9 inputs, each scored 0–100. Each bar is that input's sub-score; the figure is the points it added to the 100-point composite (weight × sub-score).
- Cash flow +15.0/30.0
- ARV discount +13.7/15.0
- DSCR +4.6/10.0
- Livability +4.3/5.0
- Rent growth +3.8/5.0
- Schools +3.7/10.0
- 1% rule +3.2/10.0
- Condition / age +2.5/5.0
- Appreciation +0.0/10.0
$165,000
🖨 Deal sheet (PDF) 📄 Offer letter ✓ Due diligence
Key facts
- Newer roof
- Newer siding
- Fenced backyard
Tags
Property features AI
Exterior
- Parking: On-street parking
- Utilities: Public water; Public sewer
- Home design: Single family residence; Two levels; Built in 1900; No shared walls (no one above or below)
- Construction: Block foundation
- Exterior features: Outbuilding
Interior
- Flooring: Wood flooring
- Bathrooms: 1 full bathroom
- Heating & cooling: Forced air heating
- Interior features: Wood flooring; One fireplace; Basement
Neighborhood map
What this means for you Summary
Snapshot
- This is a 2-bed/1.0-bath single-family listed at $165k.
Deal economics
- At list price, monthly cash flow is $52 ($629/yr) — positive.
- The deal already cash-flows at list — no discount required.
- To meet the 1% rule (rent ≥ 1% of price), the offer needs to be $135k (18.0% below list).
- Recommended offer: $135k (18.0% below list) — sets the bar for 1% rule.
- Cap rate 6.7% vs local median 4.2% in Lancaster — top-decile yield for the area; either an underpriced asset or a hidden risk that comps aren't pricing in. Stress-test before assuming the spread holds.
Location & tenants
- Location reads 86/100 on livability (#41 in OH, #423 nationally) — a professional / high-income tenant draw. Strengths: amenities A+, cost of living A+, housing A+; Watch: crime D, employment D.
- Lancaster City (town): math 38% / reading 51% proficiency, ranked #504 of 656 in OH (top 77%) — families likely to look elsewhere, expect single-tenant / working-renter base with shorter leases.
- Zoned schools: Tallmadge Elementary School (math 25% / reading 41%, grade F, #1,130 of 1,584 statewide, top 72%, 488 students, 70% FRL); Thomas Ewing Junior High School (math 34% / reading 49%, grade F, #503 of 654 statewide, top 77%, 705 students, 58% FRL); Lancaster High School (math 35% / reading 65%, grade D+, #384 of 781 statewide, top 49%, 1,848 students, 53% FRL).
- Market conditions: Rents rising fast (+5.2%/yr); 201 active listings in the ZIP; 15 comparable units currently listed for rent nearby; rentals lingering (median 46d on market — plan ~5-8 weeks vacancy on turnover, expect pricing pressure); 53% of comp listings sitting > 30 days — soft ceiling on asking rent; 475 units permitted in Fairfield County in 2024 (0 in 5+ unit buildings).
Forward outlook
- Local home prices are declining (-3.0%/yr); year-one equity from $1k of loan paydown is wiped out by about $5k of value loss. Plan a longer hold.
- Fairfield County population projected at +8% by 2050 — modest demand growth; plan on rents tracking national, not racing it.
Negotiation context
- Only 1 days on market — expect competitive offers; lowballing is unlikely to land.
- Current owner paid $70k; list at $165k implies a 136% gain — meaningful room to come down on a strong offer.
Risks & watch-outs
- Watch-outs: built in 1900 — expect roof / HVAC / electrical / plumbing capex.
Questions for the listing agent
- Built in 1900 — when were the roof, HVAC, electrical panel, plumbing, and water heater last replaced?
- Is there a deadline driving the sale (1031 exchange, divorce, estate, relocation)? That informs how much negotiation room exists.
- Crime grade is D in this area — have there been break-ins, vandalism, or insurance claims at this property in the last 3 years? What carrier currently insures it and at what premium?
- What's the average days-on-market for RENTAL listings here right now (not sales)? A rising rental-DOM trend means longer vacancies and softer asking-rent achievability than the comps imply.
- What's the recent tenant-quality profile in this submarket — average credit score on applications, eviction rate, late-payment / NSF rate, and stable-employment percentage? A property-management company in the area should have these aggregated.
- How much new for-sale + rental construction is in the pipeline within 1–3 miles? Heavy new supply typically softens prices + rents 12–24 months out; constrained supply supports both.
Investment metrics
- 1% rule
- 0.82% ✗
- Cap rate
- 6.67%
- Cash-on-cash
- 1.36%
- DSCR
- 1.06
- GRM
- 10.2
CMA / ARV
- ARV (on-the-fly)
- $191,135
- Comps found
- 12
Show comp detail 12 sales within ~0.75 mi
| Address | Dist | Beds/Ba | Sqft | Sold | Price | $/sf | Match |
|---|---|---|---|---|---|---|---|
| 1403 E Chestnut St | 0.15mi | 3/2.0 (+1) | 820 (-8%) | 2mo | $208,000 | $254 | 69 |
| 718 Oakwood Ave | 0.66mi | 2/1.0 | 892 (+0%) | 1mo | $205,000 | $230 | 68 |
| 1113 E Locust St | 0.19mi | 2/1.0 | 768 (-14%) | 2mo | $135,000 | $176 | 67 |
| 805 Sheridan Dr | 0.63mi | 2/1.0 | 910 (+2%) | 1mo | $222,000 | $244 | 66 |
| 140 N Ewing St | 0.23mi | 2/1.0 | 1,022 (+15%) | 1mo | $163,000 | $159 | 64 |
| 731 Cherokee Dr | 0.47mi | 3/1.0 (+1) | 952 (+7%) | 1mo | $205,000 | $215 | 60 |
| 621 Harding Ave | 0.51mi | 2/1.5 | 966 (+9%) | 2mo | $210,000 | $217 | 58 |
| 608 Sheridan Dr | 0.47mi | 2/1.0 | 968 (+9%) | 7mo | $195,000 | $201 | 57 |
| 1421 E Mulberry St | 0.30mi | 3/2.0 (+1) | 988 (+11%) | 7mo | $200,000 | $202 | 53 |
| 630 Sheridan Dr | 0.49mi | 2/1.0 | 1,015 (+14%) | 3mo | $183,000 | $180 | 51 |
| 811 Medill Ave | 0.65mi | 2/1.0 | 780 (-12%) | 0mo | $207,000 | $265 | 49 |
| 1159 E Fair Ave | 0.71mi | 3/1.0 (+1) | 972 (+9%) | 6mo | $125,000 | $129 | 41 |
Match score weights: distance 35% · size 25% · config 20% · recency 20%. Top-matched comps best support the ARV.
Projected returns pro-forma
-3.0% appreciation · 5.22% rent growth · sell at horizon
- IRR
- -12.0%
- Equity multiple
- 0.56×
- Total profit
- $-20,364
- Equity at exit
- $24,602
- IRR
- -0.1%
- Equity multiple
- 0.99×
- Total profit
- $-389
- Equity at exit
- $14,266
Cash invested: $46,200 (down + closing). Projections, not guarantees.
Landlord ↔ Tenant lean methodology
- Overall (STATE)
- 73 Landlord-Friendly
- State Ohio
- 73 Landlord-Friendly · R+6
- County
- — inherits STATE
- City
- — inherits STATE
ZIP-level market 43130
- Rents YoY
- 5.2%
- Active inventory
- 201
- Price-to-rent
- 10.2×
Monthly cashflow live
- Estimated rent
- $1,354 high interval (Pro) →
- Mortgage (P&I)
- −$865
- Tax from tax record
- −$83 /mo · $994/yr
- Insurance
- −$69
- HOA
- −$0
- Vacancy / Maint / Mgmt
- −$284
- Net cashflow
- $52
Break-even live
Sensitivity live
| Price | -10% $146 | -5% $99 | +0% $52 | +5% $6 | +10% $-41 |
|---|---|---|---|---|---|
| Rent | -10% $-55 | -5% $-1 | +0% $52 | +5% $106 | +10% $159 |
| Rate | -1.0pp $136 | -0.5pp $94 | base $52 | +0.5pp $10 | +1.0pp $-34 |
UW: 25.0% down · 7.5% · 30yr · 1.5% tax · 5.0% vac · 8.0% maint · 8.0% mgmt
Financing live
Cash to close
- Down payment
- $41,250
- Closing costs
- $4,950
- Reserves months
- —
- Total cash needed
- —
Loan-product check · same deal, 3 products live
Conventional
25% down · 7.5% · 30yr
- Down + closing
- —
- Monthly P&I
- —
- Monthly cashflow
- —
- DSCR
- —
- Eligible?
- —
Personal DTI + credit; lowest rate.
DSCR
20% down · 8.5% · 30yr
- Down + closing
- —
- Monthly P&I
- —
- Monthly cashflow
- —
- DSCR
- —
- Eligible?
- —
No personal income docs; deal must DSCR.
Hard money
10% down · 12.0% · 12mo
- Down + closing
- —
- Monthly P&I
- —
- Monthly cashflow
- —
- DSCR
- —
- Eligible?
- —
Short-term bridge; refi at stabilization.
Rent comps 15 comps
| Address | Beds | Baths | Sqft | Rent | $/sqft | DOM | Units | Dist |
|---|---|---|---|---|---|---|---|---|
| 1508 Greyfield ST Lancaster, OH | 1.0–3.0 | 1.0–2.0 | 953 | $1,564 | $1.64 | 0d | 1 | 1.26mi |
| 128 N Broad St Lancaster, OH | 1.0 | 1.0 | 573 | $1,250 | $2.18 | 45d | 1 | 1.26mi |
| 1405 Conquest ST Lancaster, OH | 1.0 | 1.0 | 681 | $1,260 | $1.85 | 0d | 1 | 1.27mi |
| 123 N Broad St Unit 201 Lancaster, OH | 1.0 | 1.5 | 592 | $1,350 | $2.28 | 6d | 1 | 1.30mi |
| 123 W Walnut St Unit C Lancaster, OH | 1.0 | 1.0 | 660 | $875 | $1.33 | 19d | 1 | 1.34mi |
| 123 W Walnut St Apt F Lancaster, OH | 2.0 | 1.0 | 832 | $1,100 | $1.32 | 21d | 1 | 1.34mi |
| 622 N Broad St Unit B Lancaster, OH | 2.0 | 1.0 | 700 | $1,050 | $1.50 | 45d | 1 | 1.35mi |
| 1250 Sheridan Dr Lancaster, OH | 2.0–3.0 | 1.0–1.5 | 1120 | $1,199 | $1.07 | 0d | 6 | 1.36mi |
| 219 N Columbus St Unit 213 Lancaster, OH | 1.0 | 1.0 | 755 | $1,245 | $1.65 | 45d | 1 | 1.46mi |
| 219 N Columbus St Unit 206 Lancaster, OH | 1.0 | 1.0 | 559 | $1,345 | $2.41 | 45d | 1 | 1.46mi |
| 219 N Columbus St Unit 205 Lancaster, OH | 2.0 | 2.0 | 1103 | $1,875 | $1.70 | 45d | 1 | 1.46mi |
| 219 N Columbus St Lancaster, OH | 1.0 | 1.0 | 686 | $1,440 | $2.10 | 45d | 1 | 1.46mi |
| 219 N Columbus St Unit 237 Lancaster, OH | 1.0 | 1.0 | 564 | $1,395 | $2.47 | 45d | 1 | 1.46mi |
| 219 N Columbus St Unit 231 Lancaster, OH | 2.0 | 2.0 | 975 | $1,735 | $1.78 | 45d | 1 | 1.46mi |
| 219 N Columbus St Lancaster, OH | 1.0–2.0 | 1.0–2.0 | 1184 | $1,895 | $1.60 | 0d | 31 | 1.46mi |
Listing history 5 events
-
2026-06-21statusdays on market $165,000 Active 1 DOM
-
2026-06-18days on market $165,000 Coming Soon 4 DOM
-
2026-06-17days on market $165,000 Coming Soon 3 DOM
-
2026-06-16days on market $165,000 Coming Soon 2 DOM
-
2026-06-15$165,000 Coming Soon 1 DOM
ⓘ Source: listings_history table (triggers on properties + properties_extension) + one-shot
backfill from property_details.listing_events for pre-trigger history.
Tax reassessment forecast OH · Partial reset (capped growth)
- Current annual tax
- $994 · $83/mo
- Projected year-2 tax
- $1,784 · $149/mo
- Expected delta
- +$790/yr (+$66/mo · 79.5%)
ⓘ Screening estimate from a state-policy table — verify with the county assessor before closing.
Climate risk First Street
- Flood 1/10 Low FEMA zone X (unshaded) · 0% chance over 30 yrs
- Wildfire 1/10 Low
- Heat 4/10 Moderate 7 d/yr ≥100°F today · 19 d/yr by 30 yrs out
- Wind 2/10 Low 100% chance of damaging wind over 30 yrs
- Air quality 2/10 Low 1 unhealthy d/yr today · 2 by 30 yrs out
Nearby sold comps map
Loading sold comps map…
Walkable amenities ~0.75 mi
Loading nearby amenities…
Taxation est. · year 1
- Rental income
- $16,242
- − Mortgage interest
- −$9,243
- − Property taxes
- −$994
- − Insurance
- −$825
- − Repairs & maintenance
- −$1,299
- − Management
- −$1,299
- − Depreciation
- −$4,800
- Taxable loss
- −$2,218
- Est. tax savings @ 24.0%
- +$532
- After-tax cash flow
- $1,161/yr
For passive investors: Depreciation is non-cash, so a rental often shows a tax loss while cash-flowing — sheltering income. Rental losses are passive: they offset passive income freely, and up to $25,000/yr can offset ordinary (W-2) income if you actively participate and your MAGI is under $100k (phasing out to $0 by $150k); unused losses carry forward. On sale, claimed depreciation is recaptured at up to 25%, and gains may owe capital-gains tax (a 1031 exchange can defer both). Figures are a year-1 estimate at your 24.0% rate — not tax advice; consult a CPA.
Schools (NCES district)
- District
- Lancaster City
- NCES district ID
- 3904420
- Math proficiency
- 38% ▼ -21.00%
- Reading proficiency
- 51% ▼ -11.00%
- Median HH income
- $41,696
- Composite
- 37.39/100
- National rank
- #4427
- State rank
- #504 of 656 in OH
Livability — Lancaster
- Score
- 86/100
- State rank
- #41
- US rank
- #423
Category grades
Schools grade is shown separately in the Schools card above.
Census & demographics
- Census place
- Lancaster, OH
- County
- Fairfield County · 109,896 people
- City population
- 62,933
- Metro
- Columbus, OH
- Population (ZIP)
- 62,933
- Household income
- $72,153
- Rent vs Own
- Severe rent burden
- 1400.0
Population outlook (Fairfield County) Hauer SSP2
- Today (2025)
- 162,442 people
- By 2030
- 166,796 · +2.7%
- By 2040
- 172,835 · +6.4%
- By 2050
- 174,822 · +7.6%
- By 2075
- 174,938 · +7.7%
- By 2100
- 160,988 · -0.9%
Race, ethnicity, and origin ACS 2023
- Neighborhood character
- Predominantly White (91%)
- Race & ethnicity
- White 91% Two or more races 4% Hispanic / Latino 2% Black 2%
- Common ancestry
- Slovak 2% Italian 1% Iranian 1%
- Foreign-born
- 1% · Canada
- Languages at home
- 98% English-only · Spanish 1%
Political lean MEDSL · Fairfield
- 2024 margin
- Strong R (+24.1) · D 37.5% · R 61.6%
- 2008→2024 swing
- -6.9pp toward R · 2008: -17.1pp · 2024: -24.1pp
- All cycles
- 2024: R+24.1 2020: R+23.5 2016: R+27.0 2012: R+16.1 2008: R+17.1
Not yet ingested
- Civics
- —
Market trends
- HPI YoY
- ▼ -298.81%
- Current HPI
- 239.6352
- Rent YoY
- ▲ 5.22%
- Metro
- Columbus, OH
- State GDP YoY
- ▲ 1.98%
- F500 in state
- 48
Industry mix (Fortune 500 HQ in OH)
| Industry | F500 HQs | Revenue |
|---|---|---|
| Insurance | 3 | $145B |
|
||
| Industrial Machinery | 3 | $49B |
|
||
| Financial Services | 3 | $24B |
|
||
| Consumer Goods | 2 | $93B |
|
||
| Aerospace / Defense | 2 | $47B |
|
||
| Utilities | 2 | $33B |
|
||
Price history
+135.7% since first listed2 events — show timeline
- 2026-06-14 Coming Soon $165,000 CBRMLS
- 2022-05-31 Sold (Public Records) $70,000 Public Records
Property tax history
+4.5%/yrLatest (2025): $994 · +48.8% YoY. Source: county tax records.
Cash-flow waterfall
monthlySold comps — $/sqft
last 12 mo · ≤1 miLoading sold comps…