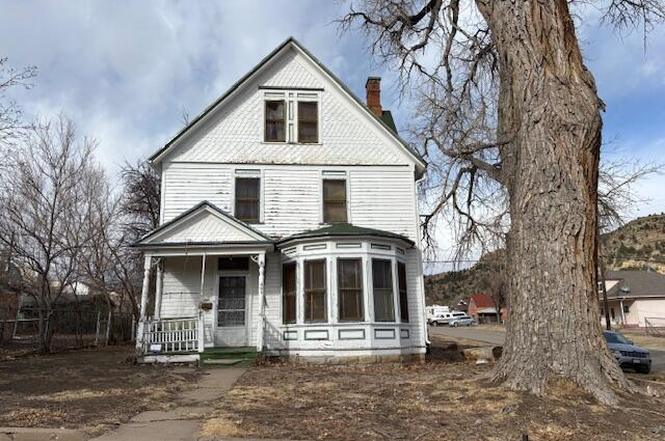
801 W Baca St · Trinidad, CO
Flood risk 1/10 · Minimal
- FEMA flood zone
- X (unshaded)
- Chance of flooding over 30 yrs
- 0.0%
- Est. flood insurance / yr
- $507 – $1,088
Fire risk 7/10 · Major
- Est. fire insurance / yr
- $939 – $1,743
Heat risk 3/10 · Minor
- Hot days now (above 90°F)
- 8 days/yr
- Hot days in 30 yrs
- 23 days/yr
Wind risk 2/10 · Minimal
- Chance of severe wind over 30 yrs
- —
Air-quality risk 1/10 · Minimal
- Unhealthy air days now
- 0 days/yr
- Unhealthy air days in 30 yrs
- 0 days/yr
Risk factors via First Street. Map © Google.
Why this score? — see what drove the B- grade
The composite is a weighted blend of 9 inputs, each scored 0–100. Each bar is that input's sub-score; the figure is the points it added to the 100-point composite (weight × sub-score).
- Cash flow +30.0/30.0
- DSCR +10.0/10.0
- 1% rule +9.5/10.0
- ARV discount +7.5/15.0
- Livability +2.9/5.0
- Rent growth +2.5/5.0
- Condition / age +2.5/5.0
- Schools +1.4/10.0
- Appreciation +0.0/10.0
$89,000
🖨 Deal sheet 📄 Offer letter ✓ Due diligence
Listing remarks
Investor Special! Call me today to set up a viewing of this 1890 3-Story Victorian that could be made into a most charming home. 5 Bedrooms, two baths, in a great location. Needs a lot of TLC, but at this price, you could make it happen. Corner lot, detached one car garage. Small fenced back yard. Won't want to miss this gem!
Key facts
- 3-story victorian
- Corner lot
- 5,663 sq ft lot
Tags
Property features AI
Finance
- Other: Above-grade finished area approximately 2,740; Total listed rooms: 12; Lot size approximately 0.13 acres; Zoned residential; Subdivision: Wilson and Whiteford's
- Financial info: Tax amount not included per instructions
- HOA & community: HOA details not specified
Exterior
- Parking: Off-street parking
- Security: Security details not specified
- Utilities: Public water
- Home design: Single-family residence; Residential property; Frame construction
- Construction: Composition roof
- Exterior features: Covered patio/porch; Corner lot; Paved road access
Interior
- Kitchen: Appliances not specified
- Bedrooms: 12 total rooms (bedroom count not specified)
- Flooring: Carpet; Vinyl; Wood
- Bathrooms: 1 full bathroom; 1 three-quarter bathroom
- Heating & cooling: Forced air heating; Natural gas heating; Has heating
- Interior features: Unfinished basement; Has basement; Has view
- Laundry & utility: Laundry details not specified
Neighborhood map
What this means for you Summary
Snapshot
- This is a 3-bed/2.0-bath single-family listed at $89k.
Deal economics
- At list price, monthly cash flow is $453 ($5k/yr) — positive.
- The deal already cash-flows at list — no discount required.
- Meets the 1% rule at list price ($1k rent vs $89k).
- Recommended offer: $78k (12.0% below list) — sets the bar for market timing.
- Cap rate 12.4% vs local median 3.0% in Trinidad — top-decile yield for the area; either an underpriced asset or a hidden risk that comps aren't pricing in. Stress-test before assuming the spread holds.
Location & tenants
- Location reads 58/100 on livability (#303 in CO) — a working-class tenant base; expect higher turnover. Strengths: cost of living A+, health & safety A+, housing A; Watch: schools F, crime F, amenities F.
- Trinidad School District 1 In The County Of Las Animas And (town): math 6% / reading 27% proficiency, ranked #82 of 86 in CO (top 95%) — low school quality limits family demand, transient renter base, plan for 1-2y turnover.
- Market conditions: 262 active listings in the ZIP; 43 units permitted in Las Animas County in 2024 (0 in 5+ unit buildings).
Forward outlook
- Local home prices are declining (-3.0%/yr); year-one equity from $615 of loan paydown is wiped out by about $3k of value loss. Plan a longer hold.
- Las Animas County population projected at -40% by 2050 — secular population decline; favor cash flow + early exit over multi-decade hold.
- At projected returns (-3.0% appreciation + 3.0% rent growth), your $25k cash investment doubles in ~6 years — after that, you're playing with house money.
Negotiation context
- It's been on market 130 days — a 12% lower offer ($78k) is reasonable based on typical stale-listing flexibility.
- 3 sale attempts with the ask held roughly flat each time — persistent listings suggest the price (not the market) is what's stuck; bring a comps-based counter.
Risks & watch-outs
- Watch-outs: built in 1890 — expect roof / HVAC / electrical / plumbing capex.
- Climate carrying-cost: major wildfire risk — expect insurance premiums to compound above CPI over the hold.
Questions for the listing agent
- It's been on market 130 days. Have you received any prior offers? Is the seller open to a 12% concession, seller financing, or rate buy-down credit?
- Built in 1890 — when were the roof, HVAC, electrical panel, plumbing, and water heater last replaced?
- Why hasn't it sold? Are there any deal-killer items the seller is aware of (foundation, flood, title, zoning, code violations)?
- Is there a deadline driving the sale (1031 exchange, divorce, estate, relocation)? That informs how much negotiation room exists.
- Schools are F-rated, which usually means shorter tenancies and higher turnover. Who's the typical renter profile here, and what's been the actual vacancy rate?
- Crime grade is F in this area — have there been break-ins, vandalism, or insurance claims at this property in the last 3 years? What carrier currently insures it and at what premium?
- What's the average days-on-market for RENTAL listings here right now (not sales)? A rising rental-DOM trend means longer vacancies and softer asking-rent achievability than the comps imply.
- What's the recent tenant-quality profile in this submarket — average credit score on applications, eviction rate, late-payment / NSF rate, and stable-employment percentage? A property-management company in the area should have these aggregated.
- How much new for-sale + rental construction is in the pipeline within 1–3 miles? Heavy new supply typically softens prices + rents 12–24 months out; constrained supply supports both.
Investment metrics
- 1% rule
- 1.45% ✓
- Cap rate
- 12.40%
- Cash-on-cash
- 21.81%
- DSCR
- 1.97
- GRM
- 5.7
CMA / ARV
- ARV (on-the-fly)
- $282,220
- Comps found
- 12
Show comp detail 12 sales within ~0.75 mi
| Address | Dist | Beds/Ba | Sqft | Sold | Price | $/sf | Match |
|---|---|---|---|---|---|---|---|
| 630 Willow St | 0.29mi | 4/2.0 (+1) | 2,584 (-6%) | 2mo | $230,000 | $89 | 70 |
| 1133 Alta St | 0.26mi | 2/2.0 (-1) | 2,860 (+4%) | 10mo | $390,000 | $136 | 67 |
| 1708 Alta St | 0.16mi | 3/1.0 | 2,372 (-13%) | 2mo | $189,000 | $80 | 64 |
| 824 Pine St | 0.28mi | 4/2.0 (+1) | 2,830 (+3%) | 16mo | $106,000 | $37 | 63 |
| 414 W Baca | 0.32mi | 4/2.0 (+1) | 2,531 (-8%) | 6mo | $305,000 | $121 | 62 |
| 910 Stonewall Ave | 0.68mi | 3/2.5 | 2,700 (-2%) | 8mo | $278,000 | $103 | 58 |
| 819 Nevada Ave | 0.46mi | 3/2.0 | 2,536 (-7%) | 11mo | $230,000 | $91 | 57 |
| 910 Nevada Ave | 0.48mi | 4/2.0 (+1) | 3,000 (+10%) | 6mo | $310,000 | $103 | 52 |
| 728 Stonewall Ave | 0.66mi | 4/3.0 (+1) | 2,856 (+4%) | 6mo | $386,000 | $135 | 48 |
| 900 Stonewall | 0.67mi | 3/2.0 | 2,368 (-14%) | 4mo | $304,500 | $129 | 43 |
| 403 W Topeka Ave | 0.36mi | 3/4.0 | 2,362 (-14%) | 12mo | $180,000 | $76 | 42 |
| 1110 State St | 0.42mi | 4/2.5 (+1) | 3,146 (+15%) | 18mo | $325,000 | $103 | 33 |
Match score weights: distance 35% · size 25% · config 20% · recency 20%. Top-matched comps best support the ARV.
Projected returns pro-forma
-3.0% appreciation · 3.0% rent growth · sell at horizon
- IRR
- 14.5%
- Equity multiple
- 1.58×
- Total profit
- $14,414
- Equity at exit
- $13,270
- IRR
- 23.2%
- Equity multiple
- 2.99×
- Total profit
- $49,656
- Equity at exit
- $7,695
Cash invested: $24,920 (down + closing). Projections, not guarantees.
Landlord ↔ Tenant lean methodology
- Overall (STATE)
- 38 Tenant-Leaning
- State Colorado
- 38 Tenant-Leaning · D+4
- County
- — inherits STATE
- City
- — inherits STATE
ZIP-level market 81082
- Home prices YoY
- -21.1%
- Active inventory
- 262
- Price-to-rent
- 5.7×
Monthly cashflow live
- Estimated rent
- $1,292 medium interval (Pro) →
- Mortgage (P&I)
- −$467
- Tax from tax record
- −$64 /mo · $771/yr
- Insurance
- −$37
- HOA
- −$0
- Vacancy / Maint / Mgmt
- −$271
- Net cashflow
- $453
Break-even live
UW: 25.0% down · 7.5% · 30yr · 1.5% tax · 5.0% vac · 8.0% maint · 8.0% mgmt
Financing live
Cash to close
- Down payment
- $22,250
- Closing costs
- $2,670
- Reserves months
- —
- Total cash needed
- —
Loan-product check · same deal, 3 products live
Conventional
25% down · 7.5% · 30yr
- Down + closing
- —
- Monthly P&I
- —
- Monthly cashflow
- —
- DSCR
- —
- Eligible?
- —
Personal DTI + credit; lowest rate.
DSCR
20% down · 8.5% · 30yr
- Down + closing
- —
- Monthly P&I
- —
- Monthly cashflow
- —
- DSCR
- —
- Eligible?
- —
No personal income docs; deal must DSCR.
Hard money
10% down · 12.0% · 12mo
- Down + closing
- —
- Monthly P&I
- —
- Monthly cashflow
- —
- DSCR
- —
- Eligible?
- —
Short-term bridge; refi at stabilization.
Listing history 21 events
-
2026-06-18days on market $89,000 Active 130 DOM
-
2026-06-17days on market $89,000 Active 129 DOM
-
2026-06-16days on market $89,000 Active 128 DOM
-
2026-06-15days on market $89,000 Active 127 DOM
-
2026-06-13days on market $89,000 Active 125 DOM
-
2026-06-12days on market $89,000 Active 124 DOM
-
2026-06-09days on market $89,000 Active 121 DOM
-
2026-06-08days on market $89,000 Active 120 DOM
-
2026-06-07days on market $89,000 Active 119 DOM
-
2026-06-04days on market $89,000 Active 115 DOM
-
2026-06-02days on market $89,000 Active 114 DOM
-
2026-06-01days on market $89,000 Active 113 DOM
-
2026-05-31days on market $89,000 Active 112 DOM
-
2026-05-31days on market $89,000 Active 111 DOM
-
2026-02-08$89,000 Active
-
2025-09-29status Pending
-
2025-09-29status Pending
-
2025-09-26historical
-
2025-09-26historical
-
2025-08-25$100,000 Active
-
2025-08-25$100,000 Active
ⓘ Source: listings_history table (triggers on properties + properties_extension) + one-shot
backfill from property_details.listing_events for pre-trigger history.
Tax reassessment forecast CO · Resets to sale price
- Current annual tax
- $771 · $64/mo
- Projected year-2 tax
- $771 · $64/mo
- Expected delta
- $0/yr ($0/mo · 0.0%)
ⓘ Screening estimate from a state-policy table — verify with the county assessor before closing.
Climate risk First Street
- Flood 1/10 Low FEMA zone X (unshaded) · 0% chance over 30 yrs
- Wildfire 7/10 Severe
- Heat 3/10 Moderate 8 d/yr ≥90°F today · 23 d/yr by 30 yrs out
- Wind 2/10 Low
- Air quality 1/10 Low 0 unhealthy d/yr today · 0 by 30 yrs out
Nearby sold comps map
Loading sold comps map…
Walkable amenities ~0.75 mi
Loading nearby amenities…
Taxation est. · year 1
- Rental income
- $15,509
- − Mortgage interest
- −$4,985
- − Property taxes
- −$771
- − Insurance
- −$445
- − Repairs & maintenance
- −$1,241
- − Management
- −$1,241
- − Depreciation
- −$2,589
- Taxable income
- $4,236
- Est. tax owed @ 24.0%
- −$1,017
- After-tax cash flow
- $4,418/yr
For passive investors: Depreciation is non-cash, so a rental often shows a tax loss while cash-flowing — sheltering income. Rental losses are passive: they offset passive income freely, and up to $25,000/yr can offset ordinary (W-2) income if you actively participate and your MAGI is under $100k (phasing out to $0 by $150k); unused losses carry forward. On sale, claimed depreciation is recaptured at up to 25%, and gains may owe capital-gains tax (a 1031 exchange can defer both). Figures are a year-1 estimate at your 24.0% rate — not tax advice; consult a CPA.
Schools (NCES district)
- District
- Trinidad School District 1 In The County Of Las Animas And
- NCES district ID
- 0806960
- Math proficiency
- 6% ▼ -9.00%
- Reading proficiency
- 27% ▼ -3.00%
- Median HH income
- $37,538
- Composite
- 13.74/100
- National rank
- #9493
- State rank
- #82 of 86 in CO
Livability — Trinidad
- Score
- 58/100
- State rank
- #303
- US rank
- #21409
Category grades
Schools grade is shown separately in the Schools card above.
Census & demographics
- Census place
- Trinidad, CO
- Population (ZIP)
- 11,750
Population outlook (Las Animas County) Hauer SSP2
- Today (2025)
- 12,072 people
- By 2030
- 10,972 · -9.1%
- By 2040
- 8,825 · -26.9%
- By 2050
- 7,245 · -40.0%
- By 2075
- 5,139 · -57.4%
- By 2100
- 3,922 · -67.5%
Race, ethnicity, and origin ACS 2023
- Neighborhood character
- Diverse neighborhood (Simpson 0.55)
- Race & ethnicity
- White 53% Hispanic / Latino 41% Two or more races 18% Native American 4% Asian 1% Black 1%
- Hispanic origin (detail)
- Mexican 20%
- Common ancestry
- Romanian 3% Lithuanian 3% Slovak 2%
- Foreign-born
- 3% · Canada
- Languages at home
- 90% English-only · Spanish 8% Other Asian/Pacific 1%
Political lean MEDSL · Las Animas
- 2024 margin
- R (+13.5) · D 42.0% · R 55.5% · Other 2.4%
- 2008→2024 swing
- -20.5pp toward R · 2008: 7.0pp · 2024: -13.5pp
- All cycles
- 2024: R+13.5 2020: R+9.9 2016: R+15.6 2012: D+2.7 2008: D+7.0
Not yet ingested
- Civics
- —
Market trends
- HPI YoY
- ▼ -69.04%
- Current HPI
- 258.5479
- Rent YoY
- —
- Metro
- —
- State GDP YoY
- ▲ 1.95%
- F500 in state
- 14
Industry mix (Fortune 500 HQ in CO)
| Industry | F500 HQs | Revenue |
|---|---|---|
| Technology Distribution | 1 | $31B |
|
||
| Food / Agriculture | 1 | $18B |
|
||
| Packaging | 1 | $14B |
|
||
| Healthcare | 1 | $13B |
|
||
| Energy | 1 | $10B |
|
||
| Technology | 1 | $4B |
|
||
Price history
-11.0% since first listed7 events — show timeline
- 2026-02-08 Listed $89,000 SPMLS
- 2025-09-29 Pending — IRES
- 2025-09-29 Pending — REColorado as Distributed by MLS Grid
- 2025-09-26 Listing Removed — REColorado as Distributed by MLS Grid
- 2025-09-26 Listing Removed — IRES
- 2025-08-25 Listed $100,000 REColorado as Distributed by MLS Grid
- 2025-08-25 Listed $100,000 IRES
Property tax history
+11.9%/yrLatest (2025): $771 · +41.6% YoY. Source: county tax records.
Cash-flow waterfall
monthlySold comps — $/sqft
last 12 mo · ≤1 miLoading sold comps…