 Triplex
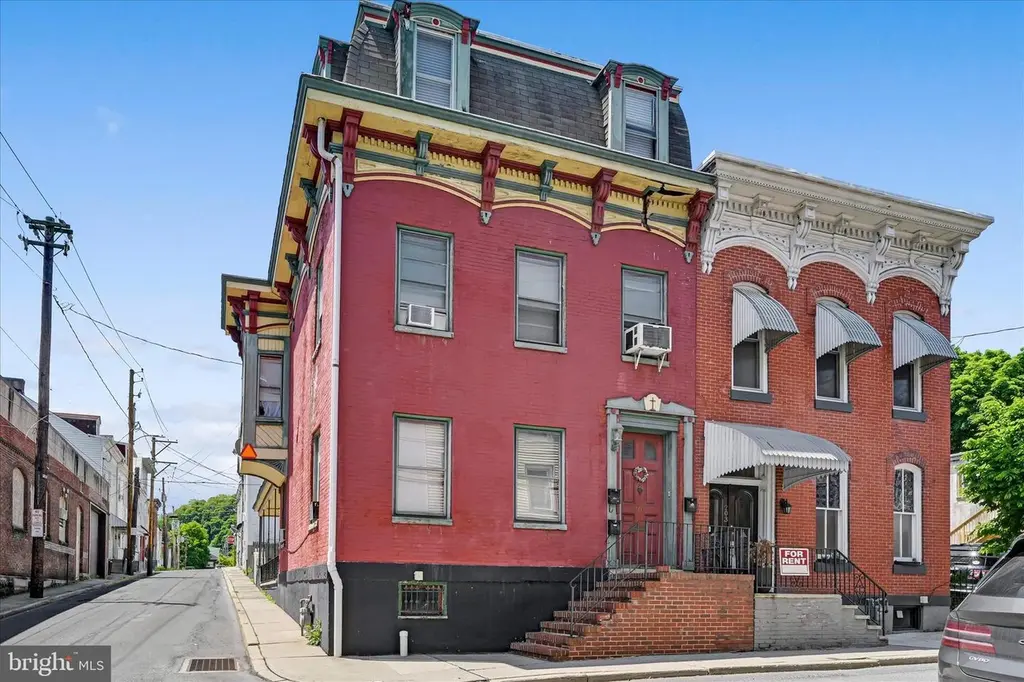
201 N 2nd St · Pottsville, PA
Flood risk 6/10 · Moderate
- FEMA flood zone
- X (unshaded)
- Chance of flooding over 30 yrs
- 0.7%
- Est. flood insurance / yr
- $473 – $860
Fire risk 3/10 · Minor
- Est. fire insurance / yr
- $511 – $949
Heat risk 5/10 · Moderate
- Hot days now (above 96°F)
- 8 days/yr
- Hot days in 30 yrs
- 17 days/yr
Wind risk 4/10 · Minor
- Chance of severe wind over 30 yrs
- 8.0%
Air-quality risk 2/10 · Minimal
- Unhealthy air days now
- 1 days/yr
- Unhealthy air days in 30 yrs
- 1 days/yr
Risk factors via First Street. Map © Google.
Why this score? — see what drove the C+ grade
The composite is a weighted blend of 9 inputs, each scored 0–100. Each bar is that input's sub-score; the figure is the points it added to the 100-point composite (weight × sub-score).
- Cash flow +30.0/30.0
- 1% rule +10.0/10.0
- DSCR +10.0/10.0
- Rent growth +3.9/5.0
- Livability +3.8/5.0
- Schools +3.1/10.0
- Condition / age +2.5/5.0
- ARV discount +0.0/15.0
- Appreciation +0.0/10.0
$224,000
🖨 Deal sheet 📄 Offer letter ✓ Due diligence
Multi-family units
County records classify this as Multi-Family (2-4 Unit). Listing-text estimate: 3 units. confirmed
Listing remarks MLS
Large Brick, 3 Unit Apartment Building in Pottsville Historic Area. Each Unit has 2 Bedrooms, Each Unit is Occupied. This income producer is priced to sell!
Key facts
- Walking distance
- Gas heat
- Functional layout
Tags
Property features AI
Exterior
- Parking: On-street parking
- Utilities: Public water; Public sewer; 200+ amp electric service; Electric hot water
- Home design: Semi-detached property; Single-story building; Fee simple ownership
- Construction: Brick construction; Permanent foundation; Estimated year built
- Exterior features: Lot approximately 25 ft x 99 ft; Above-grade other structures present
Interior
- Bedrooms: Three two-bedroom units (Unit 1, Unit 2, Unit 3)
- Heating & cooling: Hot water heating; Natural gas heating fuel; Electric cooling fuel
- Interior features: Full unfinished basement; Basement laundry
- Laundry & utility: Laundry located in the basement
Neighborhood map
What this means for you Summary
Snapshot
- This is a 3 × 2-bed/1.0-bath units multifamily listed at $224k.
Deal economics
- At list price, monthly cash flow is $1k ($17k/yr) — positive. Per door: $484/mo.
- The deal already cash-flows at list — no discount required.
- Meets the 1% rule at list price ($4k rent vs $224k).
- Recommended offer: $221k (1.5% below list) — sets the bar for market timing.
- Cap rate 14.1% vs local median 6.1% in Pottsville — top-decile yield for the area; either an underpriced asset or a hidden risk that comps aren't pricing in. Stress-test before assuming the spread holds.
Location & tenants
- Location reads 75/100 on livability (#442 in PA, #4,025 nationally) — a middle-class / working-renter tenant base. Strengths: amenities A+, cost of living A+, housing A+; Watch: commute F, employment F.
- Pottsville Area SD (town): math 29% / reading 46% proficiency, ranked #395 of 539 in PA (top 73%) — families likely to look elsewhere, expect single-tenant / working-renter base with shorter leases.
- Zoned schools: Lengel Ms (math 22% / reading 43%, grade F, #355 of 512 statewide, top 70%, 699 students, 66% FRL); Pottsville Area Hs (math 52% / reading 74%, grade B-, #69 of 437 statewide, top 16%, 898 students, 57% FRL).
- Market conditions: Rents rising fast (+5.7%/yr); 177 active listings in the ZIP; 169 units permitted in Schuylkill County in 2024 (0 in 5+ unit buildings).
Forward outlook
- Local home prices are declining (-3.0%/yr); year-one equity from $2k of loan paydown is wiped out by about $7k of value loss. Plan a longer hold.
- Schuylkill County population projected at -16% by 2050 — secular population decline; favor cash flow + early exit over multi-decade hold.
- At projected returns (-3.0% appreciation + 5.7% rent growth), your $63k cash investment doubles in ~4 years — after that, you're playing with house money.
Negotiation context
- It's been on market 28 days — a 2% lower offer ($221k) is reasonable based on typical stale-listing flexibility.
- 4 sale attempts since 21y ago with the ask held roughly flat each time — persistent listings suggest the price (not the market) is what's stuck; bring a comps-based counter.
- Current owner paid $35k; list at $224k implies a 540% gain — meaningful room to come down on a strong offer.
Risks & watch-outs
- Watch-outs: built in 1920 — expect roof / HVAC / electrical / plumbing capex.
- Climate carrying-cost: major flood risk; extreme-heat days projected 8→17/yr by 2055 (HVAC capex compounding) — expect insurance premiums to compound above CPI over the hold.
Questions for the listing agent
- Can we see the unit-by-unit rent roll, current vacancy, and any below-market leases? What's the average tenancy length?
- What capital expenditures (roof, boiler, parking lot, exteriors) have been made in the last 5 years, and what's planned in the next 2?
- Built in 1920 — when were the roof, HVAC, electrical panel, plumbing, and water heater last replaced?
- Is there a deadline driving the sale (1031 exchange, divorce, estate, relocation)? That informs how much negotiation room exists.
- Schools are B-rated — typically a magnet for longer-tenancy family renters. What's the average tenant stay here, and is there a school-zone premium baked into asking?
- What's the average days-on-market for RENTAL listings here right now (not sales)? A rising rental-DOM trend means longer vacancies and softer asking-rent achievability than the comps imply.
- What's the recent tenant-quality profile in this submarket — average credit score on applications, eviction rate, late-payment / NSF rate, and stable-employment percentage? A property-management company in the area should have these aggregated.
- How much new apartment / multifamily construction is in the pipeline within 1–3 miles? Heavy new supply (>2% of stock underway) typically softens rents 12–24 months out; light construction supports rent growth.
Investment metrics
- 1% rule
- 1.70% ✓
- Cap rate
- 14.07%
- Cash-on-cash
- 27.77%
- DSCR
- 2.24
- GRM
- 4.9
CMA / ARV
- ARV (on-the-fly)
- $187,688
- Comps found
- 1
Show comp detail 1 sale within ~0.75 mi
| Address | Dist | Beds/Ba | Sqft | Sold | Price | $/sf | Match |
|---|---|---|---|---|---|---|---|
| 108 N George St | 0.26mi | 3/— | 3,204 (-1%) | 12mo | $185,000 | $58 | 76 |
Match score weights: distance 35% · size 25% · config 20% · recency 20%. Top-matched comps best support the ARV.
Projected returns pro-forma
-3.0% appreciation · 5.7% rent growth · sell at horizon
- IRR
- 24.9%
- Equity multiple
- 2.07×
- Total profit
- $66,799
- Equity at exit
- $33,399
- IRR
- 34.3%
- Equity multiple
- 4.56×
- Total profit
- $223,415
- Equity at exit
- $19,367
Cash invested: $62,720 (down + closing). Projections, not guarantees.
Landlord ↔ Tenant lean methodology
- Overall (STATE)
- 62 Landlord-Friendly
- State Pennsylvania
- 62 Landlord-Friendly · EVEN
- County
- — inherits STATE
- City
- — inherits STATE
ZIP-level market 17901
- Home prices YoY
- -21.2%
- Rents YoY
- 5.7%
- Active inventory
- 177
- Price-to-rent
- 14.7×
Monthly cashflow live
- Estimated rent
- $3,800 high interval (Pro) →
- Mortgage (P&I)
- −$1,175
- Tax from tax record
- −$283 /mo · $3,392/yr
- Insurance
- −$93
- HOA
- −$0
- Vacancy / Maint / Mgmt
- −$798
- Net cashflow
- $1,451
Break-even live
3-unit breakdown (identical units grouped — click to expand)
| Units | Beds | Baths | Est. rent |
|---|---|---|---|
| 3× units | 2 | 1 | $3,801 |
| #1 | 2 | 1 | $1,267 |
| #2 | 2 | 1 | $1,267 |
| #3 | 2 | 1 | $1,267 |
| Total (3 units) | $3,800 | ||
UW: 25.0% down · 7.5% · 30yr · 1.5% tax · 5.0% vac · 8.0% maint · 8.0% mgmt
Financing live
Cash to close
- Down payment
- $56,000
- Closing costs
- $6,720
- Reserves months
- —
- Total cash needed
- —
Loan-product check · same deal, 3 products live
Conventional
25% down · 7.5% · 30yr
- Down + closing
- —
- Monthly P&I
- —
- Monthly cashflow
- —
- DSCR
- —
- Eligible?
- —
Personal DTI + credit; lowest rate.
DSCR
20% down · 8.5% · 30yr
- Down + closing
- —
- Monthly P&I
- —
- Monthly cashflow
- —
- DSCR
- —
- Eligible?
- —
No personal income docs; deal must DSCR.
Hard money
10% down · 12.0% · 12mo
- Down + closing
- —
- Monthly P&I
- —
- Monthly cashflow
- —
- DSCR
- —
- Eligible?
- —
Short-term bridge; refi at stabilization.
Listing history 28 events
-
2026-06-19days on market $224,000 Active 28 DOM
-
2026-06-18days on market $224,000 Active 27 DOM
-
2026-06-17days on market $224,000 Active 26 DOM
-
2026-06-16days on market $224,000 Active 25 DOM
-
2026-06-15days on market $224,000 Active 24 DOM
-
2026-06-14days on market $224,000 Active 22 DOM
-
2026-06-12days on market $224,000 Active 21 DOM
-
2026-06-09days on market $224,000 Active 18 DOM
-
2026-06-08days on market $224,000 Active 17 DOM
-
2026-06-07days on market $224,000 Active 16 DOM
-
2026-06-07days on market $224,000 Active 15 DOM
-
2026-06-04days on market $224,000 Active 12 DOM
-
2026-06-02days on market $224,000 Active 11 DOM
-
2026-06-01days on market $224,000 Active 10 DOM
-
2026-05-31days on market $224,000 Active 9 DOM
-
2026-05-31days on market $224,000 Active 8 DOM
-
2026-05-22$224,000 Active
-
2015-12-10soldstatus $35,000 156-char remark
Show marketing remark (156 chars)
Large Brick, 3 Unit Apartment Building in Pottsville Historic Area. Each Unit has 2 Bedrooms, Each Unit is Occupied. This income producer is priced to sell!
-
2015-11-30soldstatus $35,000
-
2015-11-16historical 156-char remark
Show marketing remark (156 chars)
Large Brick, 3 Unit Apartment Building in Pottsville Historic Area. Each Unit has 2 Bedrooms, Each Unit is Occupied. This income producer is priced to sell!
-
2015-04-15$40,000 156-char remark
Show marketing remark (156 chars)
Large Brick, 3 Unit Apartment Building in Pottsville Historic Area. Each Unit has 2 Bedrooms, Each Unit is Occupied. This income producer is priced to sell!
-
2007-09-14historical
-
2007-03-14$109,900
-
2006-02-04soldstatus $92,000
-
2006-02-04soldstatus $92,000
-
2006-01-07historical
-
2005-10-15$92,000
-
2005-01-04soldstatus $72,000
ⓘ Source: listings_history table (triggers on properties + properties_extension) + one-shot
backfill from property_details.listing_events for pre-trigger history.
Tax reassessment forecast PA · Partial reset (capped growth)
- Current annual tax
- $3,392 · $283/mo
- Projected year-2 tax
- $3,466 · $289/mo
- Expected delta
- +$74/yr (+$6/mo · 2.2%)
ⓘ Screening estimate from a state-policy table — verify with the county assessor before closing.
Climate risk First Street
- Flood 6/10 Major FEMA zone X (unshaded) · 70% chance over 30 yrs
- Wildfire 3/10 Moderate
- Heat 5/10 Major 8 d/yr ≥96°F today · 17 d/yr by 30 yrs out
- Wind 4/10 Moderate 8% chance of damaging wind over 30 yrs
- Air quality 2/10 Low 1 unhealthy d/yr today · 1 by 30 yrs out
Nearby sold comps map
Loading sold comps map…
Walkable amenities ~0.75 mi
Loading nearby amenities…
Taxation est. · year 1
- Rental income
- $45,600
- − Mortgage interest
- −$12,547
- − Property taxes
- −$3,392
- − Insurance
- −$1,120
- − Repairs & maintenance
- −$3,648
- − Management
- −$3,648
- − Depreciation
- −$6,516
- Taxable income
- $14,728
- Est. tax owed @ 24.0%
- −$3,535
- After-tax cash flow
- $13,881/yr
For passive investors: Depreciation is non-cash, so a rental often shows a tax loss while cash-flowing — sheltering income. Rental losses are passive: they offset passive income freely, and up to $25,000/yr can offset ordinary (W-2) income if you actively participate and your MAGI is under $100k (phasing out to $0 by $150k); unused losses carry forward. On sale, claimed depreciation is recaptured at up to 25%, and gains may owe capital-gains tax (a 1031 exchange can defer both). Figures are a year-1 estimate at your 24.0% rate — not tax advice; consult a CPA.
Schools (NCES district)
- District
- Pottsville Area SD
- NCES district ID
- 4219710
- Math proficiency
- 29% ▼ -14.00%
- Reading proficiency
- 46% ▼ -12.00%
- Median HH income
- $39,157
- Composite
- 31.32/100
- National rank
- #6002
- State rank
- #395 of 539 in PA
Livability — Pottsville
- Score
- 75/100
- State rank
- #442
- US rank
- #4025
Category grades
Schools grade is shown separately in the Schools card above.
Census & demographics
- Census place
- Pottsville, PA
- County
- Schuylkill County · 22,371 people
- City population
- 22,371
- Metro
- Pottsville, PA
- Population (ZIP)
- 22,371
- Household income
- $62,484
- Rent vs Own
- Severe rent burden
- 622.0
Population outlook (Schuylkill County) Hauer SSP2
- Today (2025)
- 137,447 people
- By 2030
- 133,121 · -3.1%
- By 2040
- 124,172 · -9.7%
- By 2050
- 115,611 · -15.9%
- By 2075
- 100,796 · -26.7%
- By 2100
- 86,667 · -36.9%
Race, ethnicity, and origin ACS 2023
- Neighborhood character
- Predominantly White (90%)
- Race & ethnicity
- White 90% Hispanic / Latino 5% Two or more races 3% Black 2%
- Common ancestry
- Romanian 9% Iranian 5% Subsaharan African 3%
- Foreign-born
- 1% · Canada
- Languages at home
- 96% English-only · Spanish 2% German/W. Germanic 1% French/Haitian/Cajun 1%
Political lean MEDSL · Schuylkill
- 2024 margin
- Solid R (+42.1) · D 28.5% · R 70.6%
- 2008→2024 swing
- -33.4pp toward R · 2008: -8.7pp · 2024: -42.1pp
- All cycles
- 2024: R+42.1 2020: R+39.9 2016: R+43.4 2012: R+13.4 2008: R+8.7
Not yet ingested
- Civics
- —
Market trends
- HPI YoY
- ▼ -54.14%
- Current HPI
- 200.6516
- Rent YoY
- ▲ 5.70%
- Metro
- Pottsville, PA
- State GDP YoY
- ▲ 1.68%
- F500 in state
- 34
Industry mix (Fortune 500 HQ in PA)
| Industry | F500 HQs | Revenue |
|---|---|---|
| Healthcare | 2 | $309B |
|
||
| Insurance | 2 | $27B |
|
||
| Telecommunications / Media | 1 | $124B |
|
||
| Industrial Distribution | 1 | $22B |
|
||
| Financial Services | 1 | $20B |
|
||
| Chemicals / Materials | 1 | $18B |
|
||
Price history
+211.1% since first listed12 events — show timeline
- 2026-05-22 Listed $224,000 BRIGHT MLS
- 2015-12-10 Sold (MLS) $35,000 BRIGHT MLS
- 2015-11-30 Sold (Public Records) $35,000 Public Records
- 2015-11-16 Listing Removed — BRIGHT MLS
- 2015-04-15 Listed $40,000 BRIGHT MLS
- 2007-09-14 Listing Removed — BRIGHT MLS
- 2007-03-14 Listed $109,900 BRIGHT MLS
- 2006-02-04 Sold (Public Records) $92,000 Public Records
- 2006-02-04 Sold (MLS) $92,000 BRIGHT MLS
- 2006-01-07 Listing Removed — BRIGHT MLS
- 2005-10-15 Listed $92,000 BRIGHT MLS
- 2005-01-04 Sold (Public Records) $72,000 Public Records
Property tax history
+3.1%/yrLatest (2025): $3,392 · +8.6% YoY. Source: county tax records.
Cash-flow waterfall
monthlySold comps — $/sqft
last 12 mo · ≤1 miLoading sold comps…