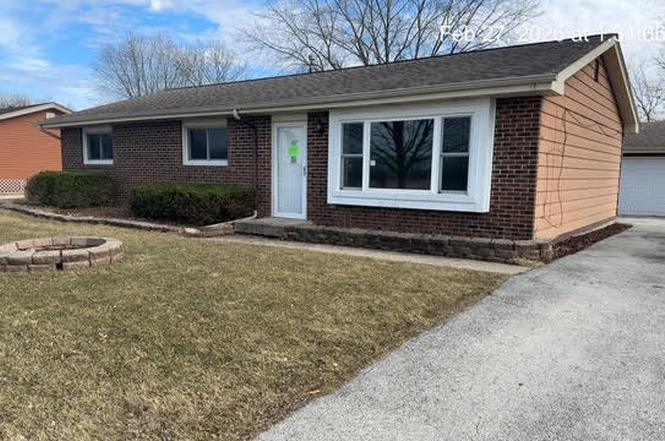
651 Central Ave · Matteson, IL
Flood risk 1/10 · Minimal
- FEMA flood zone
- X (unshaded)
- Chance of flooding over 30 yrs
- 0.0%
- Est. flood insurance / yr
- $473 – $860
Fire risk 2/10 · Minimal
- Est. fire insurance / yr
- $804 – $1,492
Heat risk 3/10 · Minor
- Hot days now (above 101°F)
- 7 days/yr
- Hot days in 30 yrs
- 16 days/yr
Wind risk 2/10 · Minimal
- Chance of severe wind over 30 yrs
- 0.0%
Air-quality risk 2/10 · Minimal
- Unhealthy air days now
- 1 days/yr
- Unhealthy air days in 30 yrs
- 1 days/yr
Risk factors via First Street. Map © Google.
Why this score? — see what drove the B grade
The composite is a weighted blend of 9 inputs, each scored 0–100. Each bar is that input's sub-score; the figure is the points it added to the 100-point composite (weight × sub-score).
- Cash flow +30.0/30.0
- ARV discount +15.0/15.0
- 1% rule +10.0/10.0
- DSCR +10.0/10.0
- Livability +3.4/5.0
- Rent growth +2.5/5.0
- Condition / age +2.5/5.0
- Schools +0.9/10.0
- Appreciation +0.0/10.0
$169,900
🖨 Deal sheet 📄 Offer letter ✓ Due diligence
Listing remarks MLS
Corporate owned. Sold AS IS. No disclosures, no survey, no termite provided by seller. Buyer responsible for any/all inspections, compliances or escrows as needed. Fax all highest and best offers along with prequal letter or proof of funds to listing office. Earnest money must be certified funds only.
Key facts
- Spacious ranch
- Close to highway
- One level living
Tags
Property features AI
Finance
- Other: Fee simple ownership
- HOA & community: No master association fee required
Exterior
- Parking: Detached garage accessed via side driveway (1 garage space, 1 total parking space)
- Utilities: Public water; Public sewer
- Home design: Detached single-family home; One-story
- Construction: Brick and frame construction; Built approximately 41–50 years ago; Not rebuilt or rehabbed
- Exterior features: Lot less than 0.25 acre; Lot dimensions: 8700
Interior
- Kitchen: Kitchen (21 x 11)
- Bedrooms: 3 bedrooms (all on the main level)
- Bathrooms: 1 full bathroom
- Heating & cooling: Natural gas forced-air heating
- Interior features: 5 total rooms
- Laundry & utility: Separate laundry room
Neighborhood map
What this means for you Summary
Snapshot
- This is a 3-bed/1.0-bath single-family listed at $170k.
Deal economics
- At list price, monthly cash flow is $838 ($10k/yr) — positive.
- The deal already cash-flows at list — no discount required.
- Meets the 1% rule at list price ($3k rent vs $170k).
- Cap rate 12.2% vs local median 6.2% in Matteson — top-decile yield for the area; either an underpriced asset or a hidden risk that comps aren't pricing in. Stress-test before assuming the spread holds.
Location & tenants
- Location reads 67/100 on livability (#525 in IL) — a middle-class / working-renter tenant base. Strengths: employment A+, housing A+, cost of living A; Watch: schools D+, amenities F, commute F.
- Rich Twp Hsd 227 (suburban): math 5% / reading 12% proficiency, ranked #577 of 620 in IL (top 93%) — low school quality limits family demand, transient renter base, plan for 1-2y turnover.
- Market conditions: 69 active listings in the ZIP; 5 comparable units currently listed for rent nearby; rentals leasing fast (median 6d on market — plan ~1-2 weeks tenant-placement turnaround); 6,272 units permitted in Cook County in 2024 (4,658 in 5+ unit buildings).
Forward outlook
- Local home prices are declining (-3.0%/yr); year-one equity from $1k of loan paydown is wiped out by about $5k of value loss. Plan a longer hold.
- At projected returns (-3.0% appreciation + 3.0% rent growth), your $48k cash investment doubles in ~6 years — after that, you're playing with house money.
Negotiation context
- Only 2 days on market — expect competitive offers; lowballing is unlikely to land.
- Current owner paid $105k; list at $170k implies a 62% gain — meaningful room to come down on a strong offer.
Risks & watch-outs
- Watch-outs: property tax is 3.1% of price.
Questions for the listing agent
- Property tax is high relative to price — has the assessment been appealed recently, and will the sale trigger a re-assessment?
- Is there a deadline driving the sale (1031 exchange, divorce, estate, relocation)? That informs how much negotiation room exists.
- Schools are D-rated, which usually means shorter tenancies and higher turnover. Who's the typical renter profile here, and what's been the actual vacancy rate?
- What's the average days-on-market for RENTAL listings here right now (not sales)? A rising rental-DOM trend means longer vacancies and softer asking-rent achievability than the comps imply.
- What's the recent tenant-quality profile in this submarket — average credit score on applications, eviction rate, late-payment / NSF rate, and stable-employment percentage? A property-management company in the area should have these aggregated.
- How much new for-sale + rental construction is in the pipeline within 1–3 miles? Heavy new supply typically softens prices + rents 12–24 months out; constrained supply supports both.
Investment metrics
- 1% rule
- 1.67% ✓
- Cap rate
- 12.21%
- Cash-on-cash
- 21.13%
- DSCR
- 1.94
- GRM
- 5.0
CMA / ARV
- ARV (on-the-fly)
- $229,689
- Comps found
- 12
Show comp detail 12 sales within ~0.75 mi
| Address | Dist | Beds/Ba | Sqft | Sold | Price | $/sf | Match |
|---|---|---|---|---|---|---|---|
| 903 Notre Dame Dr | 0.30mi | 3/1.5 | 1,300 (+2%) | 0mo | $250,000 | $192 | 80 |
| 829 Princeton Ave | 0.27mi | 3/1.5 | 1,225 (-4%) | 1mo | $175,000 | $143 | 79 |
| 907 Dartmouth Ave | 0.31mi | 3/1.5 | 1,225 (-4%) | 7mo | $202,000 | $165 | 72 |
| 913 Dartmouth Ave | 0.32mi | 3/2.0 | 1,198 (-6%) | 9mo | $245,000 | $205 | 65 |
| 733 Old Meadow Rd | 0.62mi | 3/1.5 | 1,294 (+2%) | 8mo | $287,000 | $222 | 59 |
| 856 Notre Dame Dr | 0.27mi | 3/2.0 | 1,445 (+14%) | 4mo | $255,700 | $177 | 57 |
| 6103 Sunflower Dr | 0.75mi | 3/1.5 | 1,292 (+2%) | 4mo | $233,000 | $180 | 57 |
| 5808 Allemong Dr | 0.65mi | 3/2.0 | 1,212 (-4%) | 3mo | $219,900 | $181 | 56 |
| 5747 Allemong Dr | 0.59mi | 3/1.5 | 1,144 (-10%) | 1mo | $249,900 | $218 | 53 |
| 6021 Spring Ln | 0.68mi | 3/1.5 | 1,168 (-8%) | 2mo | $165,000 | $141 | 52 |
| 142 Cloverleaf Rd | 0.74mi | 3/2.0 | 1,391 (+10%) | 8mo | $185,000 | $133 | 38 |
| 6024 Beechwood Rd | 0.74mi | 3/2.0 | 1,097 (-14%) | 9mo | $223,000 | $203 | 31 |
Match score weights: distance 35% · size 25% · config 20% · recency 20%. Top-matched comps best support the ARV.
Projected returns pro-forma
-3.0% appreciation · 3.0% rent growth · sell at horizon
- IRR
- 13.7%
- Equity multiple
- 1.55×
- Total profit
- $25,995
- Equity at exit
- $25,333
- IRR
- 22.5%
- Equity multiple
- 2.94×
- Total profit
- $92,063
- Equity at exit
- $14,690
Cash invested: $47,572 (down + closing). Projections, not guarantees.
Landlord ↔ Tenant lean methodology
- Overall (STATE)
- 43 Moderately Tenant-Leaning
- State Illinois
- 43 Moderately Tenant-Leaning · D+7
- County
- — inherits STATE
- City
- — inherits STATE
ZIP-level market 60443
- Home prices YoY
- -32.6%
- Active inventory
- 69
- Price-to-rent
- 5.0×
Monthly cashflow live
- Estimated rent
- $2,832 high interval (Pro) →
- Mortgage (P&I)
- −$891
- Tax from tax record
- −$438 /mo · $5,258/yr
- Insurance
- −$71
- HOA
- −$0
- Vacancy / Maint / Mgmt
- −$595
- Net cashflow
- $838
Break-even live
UW: 25.0% down · 7.5% · 30yr · 1.5% tax · 5.0% vac · 8.0% maint · 8.0% mgmt
Financing live
Cash to close
- Down payment
- $42,475
- Closing costs
- $5,097
- Reserves months
- —
- Total cash needed
- —
Loan-product check · same deal, 3 products live
Conventional
25% down · 7.5% · 30yr
- Down + closing
- —
- Monthly P&I
- —
- Monthly cashflow
- —
- DSCR
- —
- Eligible?
- —
Personal DTI + credit; lowest rate.
DSCR
20% down · 8.5% · 30yr
- Down + closing
- —
- Monthly P&I
- —
- Monthly cashflow
- —
- DSCR
- —
- Eligible?
- —
No personal income docs; deal must DSCR.
Hard money
10% down · 12.0% · 12mo
- Down + closing
- —
- Monthly P&I
- —
- Monthly cashflow
- —
- DSCR
- —
- Eligible?
- —
Short-term bridge; refi at stabilization.
Rent comps 5 comps
| Address | Beds | Baths | Sqft | Rent | $/sqft | DOM | Units | Dist |
|---|---|---|---|---|---|---|---|---|
| 946 Harvard Ln Matteson, IL | 4.0 | 1.5 | 1247 | $2,990 | $2.40 | 24d | 1 | 0.38mi |
| 5817 Allemong Dr Matteson, IL | 3.0 | 1.5 | 1350 | $2,500 | $1.85 | 7d | 1 | 0.61mi |
| 6048 White Birch Ln Matteson, IL | 3.0 | 2.5 | 1638 | $2,741 | $1.67 | 6d | 1 | 0.69mi |
| 6024 Aspen Ln Matteson, IL | 3.0 | 2.0 | 1294 | $2,800 | $2.16 | 1d | 1 | 0.70mi |
| 4962 Bennett St Matteson, IL | 2.0–3.0 | 2.5 | 1341 | $3,120 | $2.33 | 1d | 7 | 1.07mi |
Listing history 10 events
-
2026-06-18days on market $169,900 Active 2 DOM
-
2026-06-16days on market $169,900 Active 1 DOM
-
2026-06-01days on market $169,900 Active 76 DOM
-
2026-05-31days on market $169,900 Active 75 DOM
-
2026-04-09historical
-
2007-04-10soldstatus $105,000
-
2007-03-22soldstatus $105,000 302-char remark
Show marketing remark (302 chars)
Corporate owned. Sold AS IS. No disclosures, no survey, no termite provided by seller. Buyer responsible for any/all inspections, compliances or escrows as needed. Fax all highest and best offers along with prequal letter or proof of funds to listing office. Earnest money must be certified funds only.
-
2007-02-27historical 302-char remark
Show marketing remark (302 chars)
Corporate owned. Sold AS IS. No disclosures, no survey, no termite provided by seller. Buyer responsible for any/all inspections, compliances or escrows as needed. Fax all highest and best offers along with prequal letter or proof of funds to listing office. Earnest money must be certified funds only.
-
2006-08-22$118,525 302-char remark
Show marketing remark (302 chars)
Corporate owned. Sold AS IS. No disclosures, no survey, no termite provided by seller. Buyer responsible for any/all inspections, compliances or escrows as needed. Fax all highest and best offers along with prequal letter or proof of funds to listing office. Earnest money must be certified funds only.
-
2004-10-28soldstatus $145,000
ⓘ Source: listings_history table (triggers on properties + properties_extension) + one-shot
backfill from property_details.listing_events for pre-trigger history.
Tax reassessment forecast IL · Partial reset (capped growth)
- Current annual tax
- $5,258 · $438/mo
- Projected year-2 tax
- $5,258 · $438/mo
- Expected delta
- $0/yr ($0/mo · 0.0%)
ⓘ Screening estimate from a state-policy table — verify with the county assessor before closing.
Climate risk First Street
- Flood 1/10 Low FEMA zone X (unshaded) · 0% chance over 30 yrs
- Wildfire 2/10 Low
- Heat 3/10 Moderate 7 d/yr ≥101°F today · 16 d/yr by 30 yrs out
- Wind 2/10 Low 0% chance of damaging wind over 30 yrs
- Air quality 2/10 Low 1 unhealthy d/yr today · 1 by 30 yrs out
Nearby sold comps map
Loading sold comps map…
Walkable amenities ~0.75 mi
Loading nearby amenities…
Taxation est. · year 1
- Rental income
- $33,987
- − Mortgage interest
- −$9,517
- − Property taxes
- −$5,258
- − Insurance
- −$850
- − Repairs & maintenance
- −$2,719
- − Management
- −$2,719
- − Depreciation
- −$4,943
- Taxable income
- $7,982
- Est. tax owed @ 24.0%
- −$1,916
- After-tax cash flow
- $8,135/yr
For passive investors: Depreciation is non-cash, so a rental often shows a tax loss while cash-flowing — sheltering income. Rental losses are passive: they offset passive income freely, and up to $25,000/yr can offset ordinary (W-2) income if you actively participate and your MAGI is under $100k (phasing out to $0 by $150k); unused losses carry forward. On sale, claimed depreciation is recaptured at up to 25%, and gains may owe capital-gains tax (a 1031 exchange can defer both). Figures are a year-1 estimate at your 24.0% rate — not tax advice; consult a CPA.
Schools (NCES district)
- District
- Rich Twp Hsd 227
- NCES district ID
- 1733420
- Math proficiency
- 5% ▼ -3.00%
- Reading proficiency
- 12% ▬ 0.00%
- Median HH income
- $56,056
- Composite
- 8.93/100
- National rank
- #9885
- State rank
- #577 of 620 in IL
Livability — Matteson
- Score
- 67/100
- State rank
- #525
- US rank
- #10883
Category grades
Schools grade is shown separately in the Schools card above.
Census & demographics
- Census place
- Matteson, IL
- City population
- 20,606
- Population (ZIP)
- 20,606
Population outlook (Cook County) Hauer SSP2
- Today (2025)
- 5,347,519 people
- By 2030
- 5,357,703 · +0.2%
- By 2040
- 5,324,924 · -0.4%
- By 2050
- 5,230,762 · -2.2%
- By 2075
- 4,785,735 · -10.5%
- By 2100
- 4,188,836 · -21.7%
Race, ethnicity, and origin ACS 2023
- Neighborhood character
- Predominantly Black (72%)
- Race & ethnicity
- Black 72% White 18% Two or more races 6% Hispanic / Latino 5% Asian 1%
- Hispanic origin (detail)
- Mexican 4%
- Common ancestry
- Romanian 2%
- Foreign-born
- 4% · Canada
- Languages at home
- 94% English-only · Spanish 4%
Political lean MEDSL · Cook
- 2024 margin
- Solid D (+42.0) · D 70.4% · R 28.4% · Other 1.2%
- 2008→2024 swing
- -11.4pp toward R · 2008: 53.4pp · 2024: 42.0pp
- All cycles
- 2024: D+42.0 2020: D+50.3 2016: D+53.0 2012: D+49.4 2008: D+53.4
Not yet ingested
- Civics
- —
Market trends
- HPI YoY
- ▼ -89.68%
- Current HPI
- 185.4404
- Rent YoY
- —
- Metro
- —
- State GDP YoY
- ▲ 1.59%
- F500 in state
- 60
Industry mix (Fortune 500 HQ in IL)
| Industry | F500 HQs | Revenue |
|---|---|---|
| Insurance | 4 | $201B |
|
||
| Consumer Goods | 4 | $87B |
|
||
| Industrial Machinery | 3 | $64B |
|
||
| Healthcare | 2 | $55B |
|
||
| Retail / Pharmacy | 1 | $148B |
|
||
| Agriculture / Food | 1 | $86B |
|
||
Price history
-27.6% since first listed6 events — show timeline
- 2026-04-09 Listing Removed — MRED as Distributed by MLS Grid
- 2007-04-10 Sold (Public Records) $105,000 Public Records
- 2007-03-22 Sold (MLS) $105,000 MRED as Distributed by MLS Grid
- 2007-02-27 Listing Removed — MRED as Distributed by MLS Grid
- 2006-08-22 Listed $118,525 MRED as Distributed by MLS Grid
- 2004-10-28 Sold (Public Records) $145,000 Public Records
Property tax history
+2.5%/yrLatest (2023): $5,258 · +33.6% YoY. Source: county tax records.
Cash-flow waterfall
monthlySold comps — $/sqft
last 12 mo · ≤1 miLoading sold comps…