 🌊 Lakefront
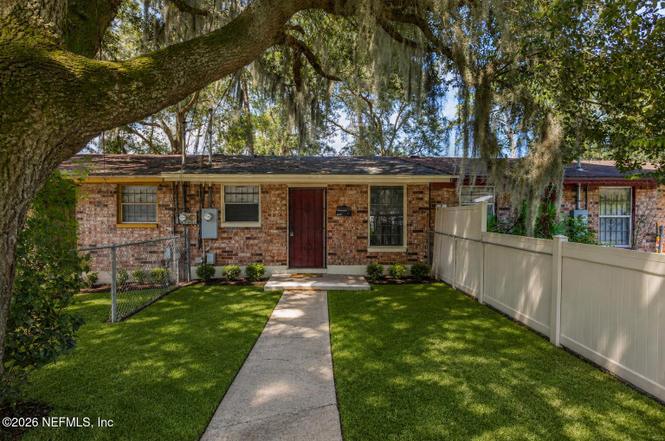
4417 Ken Knight Dr N · Jacksonville, FL
Flood risk 7/10 · Major
- FEMA flood zone
- X (shaded)
- Chance of flooding over 30 yrs
- 0.94%
- Est. flood insurance / yr
- $507 – $1,088
Fire risk 1/10 · Minimal
- Est. fire insurance / yr
- $947 – $1,759
Heat risk 9/10 · Severe
- Hot days now (above 107°F)
- 7 days/yr
- Hot days in 30 yrs
- 20 days/yr
Wind risk 9/10 · Severe
- Chance of severe wind over 30 yrs
- 99.0%
Air-quality risk 4/10 · Minor
- Unhealthy air days now
- 6 days/yr
- Unhealthy air days in 30 yrs
- 6 days/yr
Risk factors via First Street. Map © Google.
Why this score? — see what drove the D grade
The composite is a weighted blend of 9 inputs, each scored 0–100. Each bar is that input's sub-score; the figure is the points it added to the 100-point composite (weight × sub-score).
- Cash flow +18.0/30.0
- DSCR +5.7/10.0
- 1% rule +5.5/10.0
- Livability +4.2/5.0
- Schools +3.9/10.0
- Rent growth +3.0/5.0
- Condition / age +2.5/5.0
- ARV discount +2.2/15.0
- Appreciation +0.0/10.0
$78,000
🖨 Deal sheet (PDF) 📄 Offer letter ✓ Due diligence
Listing remarks MLS
Discover your dream Jacksonville townhome! This well-maintained property features 2 bedrooms and 1 bathroom, offering a functional and comfortable layout. Now vacant and ready for immediate showings, the home is easily accessible via lockbox. Whether you're a homebuyer or an investor, this is a fantastic opportunity you don't want to miss. Act fast--schedule your showing today and make it yours!
Key facts
- Central hvac
- No cdd
- Public water sewer
Tags
Property features AI
Exterior
- Parking: Off-street parking; Other/unassigned parking
- Utilities: Private sewer; Electricity available; Water available
- Home design: Condominium; Single-story (1 story); Attached property
- Exterior features: River access; Waterfront
Interior
- Kitchen: Electric range; Microwave; Refrigerator
- Bedrooms: 2 bedrooms
- Flooring: Tile; Vinyl
- Bathrooms: 1 full bathroom
- Heating & cooling: Central heating; Central air conditioning
- Interior features: Ceiling fan(s)
- Laundry & utility: In-unit laundry
Neighborhood map
What this means for you Summary
Snapshot
- This is a 2-bed/1.0-bath single-family listed at $78k.
Deal economics
- At list price, monthly cash flow is $1 ($14/yr) — positive.
- The deal already cash-flows at list — no discount required.
- Meets the 1% rule at list price ($821 rent vs $78k).
- Cap rate 7.3% vs local median 3.9% in Jacksonville — top-decile yield for the area; either an underpriced asset or a hidden risk that comps aren't pricing in. Stress-test before assuming the spread holds.
Location & tenants
- Location reads 83/100 on livability (#50 in FL, #911 nationally) — a professional / high-income tenant draw. Strengths: amenities A+, commute A+, housing A+.
- Duval (urban): math 46% / reading 45% proficiency, ranked #48 of 73 in FL (top 66%) — families likely to look elsewhere, expect single-tenant / working-renter base with shorter leases.
- Zoned schools: Grasp Academy (math 18% / reading 14%, grade F, #2,130 of 2,144 statewide, top 99%, 271 students, 52% FRL); Jean Ribault Middle School (math 28% / reading 24%, grade F, #506 of 571 statewide, top 89%, 679 students, 78% FRL); Jean Ribault High School (math 22% / reading 25%, grade F, #533 of 667 statewide, top 80%, 1,385 students, 71% FRL) — zoned schools average 67% FRL vs 49% district-wide (17 pts higher); higher-poverty schools than district average — tighter screening recommended.
- Zoned-school proficiency averages 22% at this address vs 46% district-wide (-24 pts) — the specific schools serving this property underperform the Duval average; the district grade overstates school quality for this exact location.
- Market conditions: Rents rising (+1.8%/yr); 399 active listings in the ZIP; 5 comparable units currently listed for rent nearby; rentals at typical pace (median 17d on market — plan ~3-4 weeks tenant-placement turnaround); lower-income renter base — watch delinquency; 6,503 units permitted in Duval County in 2024 (1,131 in 5+ unit buildings).
- This rent runs 32% of the median local income ($31k/yr) — at the standard rent-burdened threshold; future hikes will face affordability resistance.
Forward outlook
- Local home prices are declining (-3.0%/yr); year-one equity from $539 of loan paydown is wiped out by about $2k of value loss. Plan a longer hold.
- Duval County population projected at +19% by 2050 — long-run rental-demand tailwind backs the buy-and-hold thesis.
Negotiation context
- Only 6 days on market — expect competitive offers; lowballing is unlikely to land.
- 16 sale attempts since 21y ago with the ask held roughly flat each time — persistent listings suggest the price (not the market) is what's stuck; bring a comps-based counter.
Risks & watch-outs
- Watch-outs: flood insurance adds $66/mo.
- Climate carrying-cost: major flood risk; severe wind risk, 99% chance of damaging wind over 30y; extreme-heat days projected 7→20/yr by 2055 (HVAC capex compounding) — expect insurance premiums to compound above CPI over the hold.
Questions for the listing agent
- Built in 1969 — when were the roof, HVAC, electrical panel, plumbing, and water heater last replaced?
- What's the actual annual flood-insurance premium (NFIP or private), and is the property in a SFHA with mandatory coverage?
- Is there a deadline driving the sale (1031 exchange, divorce, estate, relocation)? That informs how much negotiation room exists.
- Schools are B-rated — typically a magnet for longer-tenancy family renters. What's the average tenant stay here, and is there a school-zone premium baked into asking?
- The area grade is low — what's the realistic commute time and amenity access for the typical tenant pool here? Any planned neighborhood developments (good or bad) we should know about?
- This sits on a lake — are riparian / water-frontage rights deeded with the parcel? Any dock permits, shoreline easements, or HOA water-use restrictions?
- What's the documented flood / surge / shoreline-erosion history here (FEMA AND non-FEMA — e.g., storm surge, creek backup, septic-field saturation)?
- Any water-quality or seasonal algae-bloom issues that affect tenant satisfaction or short-term-rental demand?
- What's the average days-on-market for RENTAL listings here right now (not sales)? A rising rental-DOM trend means longer vacancies and softer asking-rent achievability than the comps imply.
- What's the recent tenant-quality profile in this submarket — average credit score on applications, eviction rate, late-payment / NSF rate, and stable-employment percentage? A property-management company in the area should have these aggregated.
- How much new for-sale + rental construction is in the pipeline within 1–3 miles? Heavy new supply typically softens prices + rents 12–24 months out; constrained supply supports both.
Investment metrics
- 1% rule
- 1.05% ✓
- Cap rate
- 7.33%
- Cash-on-cash
- 3.72%
- DSCR
- 1.17
- GRM
- 7.9
CMA / ARV
- ARV (on-the-fly)
- $69,768
- Comps found
- 4
Show comp detail 4 sales within ~0.75 mi
| Address | Dist | Beds/Ba | Sqft | Sold | Price | $/sf | Match |
|---|---|---|---|---|---|---|---|
| 4622 Wrico Dr | 0.21mi | 2/1.0 | 682 (+0%) | 4mo | $40,000 | $59 | 86 |
| 4442 Friden Dr | 0.24mi | 2/1.0 | 682 (+0%) | 11mo | $62,000 | $91 | 79 |
| 4440 Friden Dr | 0.24mi | 2/1.0 | 646 (-5%) | 3mo | $40,000 | $62 | 78 |
| 4612 Wrico Dr | 0.20mi | 2/1.0 | 688 (+1%) | 21mo | $52,000 | $76 | 71 |
Match score weights: distance 35% · size 25% · config 20% · recency 20%. Top-matched comps best support the ARV.
Projected returns pro-forma
-3.0% appreciation · 1.81% rent growth · sell at horizon
- IRR
- -17.7%
- Equity multiple
- 0.38×
- Total profit
- $-13,456
- Equity at exit
- $11,630
- IRR
- -12.5%
- Equity multiple
- 0.30×
- Total profit
- $-15,191
- Equity at exit
- $6,744
Cash invested: $21,840 (down + closing). Projections, not guarantees.
Landlord ↔ Tenant lean methodology
- Overall (STATE)
- 87 Strongly Landlord-Friendly
- State Florida
- 87 Strongly Landlord-Friendly · R+3
- County
- — inherits STATE
- City
- — inherits STATE
ZIP-level market 32209
- Home prices YoY
- -22.1%
- Rents YoY
- 1.8%
- Active inventory
- 399
- Price-to-rent
- 7.9×
Monthly cashflow live
- Estimated rent
- $821 high interval (Pro) →
- Mortgage (P&I)
- −$409
- Tax from tax record
- −$140 /mo · $1,676/yr
- Insurance
- −$32
- Flood insurance flood zone
- −$66 /mo · $798/yr
- HOA
- −$0
- Vacancy / Maint / Mgmt
- −$172
- Net cashflow
- $1
Break-even live
Sensitivity live
| Price | -10% $45 | -5% $23 | +0% $1 | +5% $-21 | +10% $-43 |
|---|---|---|---|---|---|
| Rent | -10% $-64 | -5% $-31 | +0% $1 | +5% $34 | +10% $66 |
| Rate | -1.0pp $40 | -0.5pp $21 | base $1 | +0.5pp $-19 | +1.0pp $-40 |
UW: 25.0% down · 7.5% · 30yr · 1.5% tax · 5.0% vac · 8.0% maint · 8.0% mgmt
Financing live
Cash to close
- Down payment
- $19,500
- Closing costs
- $2,340
- Reserves months
- —
- Total cash needed
- —
Loan-product check · same deal, 3 products live
Conventional
25% down · 7.5% · 30yr
- Down + closing
- —
- Monthly P&I
- —
- Monthly cashflow
- —
- DSCR
- —
- Eligible?
- —
Personal DTI + credit; lowest rate.
DSCR
20% down · 8.5% · 30yr
- Down + closing
- —
- Monthly P&I
- —
- Monthly cashflow
- —
- DSCR
- —
- Eligible?
- —
No personal income docs; deal must DSCR.
Hard money
10% down · 12.0% · 12mo
- Down + closing
- —
- Monthly P&I
- —
- Monthly cashflow
- —
- DSCR
- —
- Eligible?
- —
Short-term bridge; refi at stabilization.
Rent comps 5 comps
| Address | Beds | Baths | Sqft | Rent | $/sqft | DOM | Units | Dist |
|---|---|---|---|---|---|---|---|---|
| 4440 Ken Knight Dr N Jacksonville, FL | 2.0 | 1.0 | 716 | $650 | $0.91 | 16d | 1 | 0.04mi |
| 4655 Ken Knight Dr N Jacksonville, FL | 2.0 | 1.0 | 646 | $600 | $0.93 | 25d | 1 | 0.14mi |
| 4848 Mississippi Ct Jacksonville, FL | 1.0 | 1.0 | 400 | $850 | $2.12 | 6d | 1 | 0.53mi |
| 2185 Benedict Rd Jacksonville, FL | 2.0 | 1.0 | 630 | $995 | $1.58 | 25d | 1 | 1.45mi |
| 2185 Benedict Rd Unit 2187 Jacksonville, FL | 2.0 | 1.0 | 630 | $995 | $1.58 | 12d | 1 | 1.45mi |
Listing history 5 events
-
2026-06-21days on market $78,000 Active 6 DOM
-
2026-06-18days on market $78,000 Active 3 DOM
-
2026-06-17days on market $78,000 Active 2 DOM
-
2026-06-16remarks 425-char remark
-
2026-06-16$78,000 Active 1 DOM
ⓘ Source: listings_history table (triggers on properties + properties_extension) + one-shot
backfill from property_details.listing_events for pre-trigger history.
Tax reassessment forecast FL · Resets to sale price
- Current annual tax
- $1,676 · $140/mo
- Projected year-2 tax
- $1,676 · $140/mo
- Expected delta
- $0/yr ($0/mo · 0.0%)
ⓘ Screening estimate from a state-policy table — verify with the county assessor before closing.
Climate risk First Street
- Flood 7/10 Severe FEMA zone X (shaded) · 94% chance over 30 yrs
- Wildfire 1/10 Low
- Heat 9/10 Extreme 7 d/yr ≥107°F today · 20 d/yr by 30 yrs out
- Wind 9/10 Extreme 99% chance of damaging wind over 30 yrs
- Air quality 4/10 Moderate 6 unhealthy d/yr today · 6 by 30 yrs out
Nearby sold comps map
Loading sold comps map…
Walkable amenities ~0.75 mi
Loading nearby amenities…
Taxation est. · year 1
- Rental income
- $9,856
- − Mortgage interest
- −$4,369
- − Property taxes
- −$1,676
- − Insurance
- −$1,188
- − Repairs & maintenance
- −$788
- − Management
- −$788
- − Depreciation
- −$2,269
- Taxable loss
- −$1,223
- Est. tax savings @ 24.0%
- +$293
- After-tax cash flow
- $308/yr
For passive investors: Depreciation is non-cash, so a rental often shows a tax loss while cash-flowing — sheltering income. Rental losses are passive: they offset passive income freely, and up to $25,000/yr can offset ordinary (W-2) income if you actively participate and your MAGI is under $100k (phasing out to $0 by $150k); unused losses carry forward. On sale, claimed depreciation is recaptured at up to 25%, and gains may owe capital-gains tax (a 1031 exchange can defer both). Figures are a year-1 estimate at your 24.0% rate — not tax advice; consult a CPA.
Schools (NCES district)
- District
- Duval
- NCES district ID
- 1200480
- Math proficiency
- 46% ▼ -11.00%
- Reading proficiency
- 45% ▼ -4.00%
- Median HH income
- $48,987
- Composite
- 38.97/100
- National rank
- #4076
- State rank
- #48 of 73 in FL
Livability — Jacksonville
- Score
- 83/100
- State rank
- #50
- US rank
- #911
Category grades
Schools grade is shown separately in the Schools card above.
Census & demographics
- Census place
- Jacksonville, FL
- County
- Duval County · 1,015,274 people
- City population
- 979,034
- Metro
- Jacksonville, FL
- Population (ZIP)
- 34,657
- Household income
- $30,514
- Rent vs Own
- Severe rent burden
- 2921.0
Population outlook (Duval County) Hauer SSP2
- Today (2025)
- 1,013,010 people
- By 2030
- 1,059,228 · +4.6%
- By 2040
- 1,141,439 · +12.7%
- By 2050
- 1,205,258 · +19.0%
- By 2075
- 1,324,282 · +30.7%
- By 2100
- 1,319,620 · +30.3%
Race, ethnicity, and origin ACS 2023
- Neighborhood character
- Predominantly Black (88%)
- Race & ethnicity
- Black 88% White 5% Hispanic / Latino 5% Two or more races 2%
- Hispanic origin (detail)
- Puerto Rican 3%
- Common ancestry
- Hispanic 1% Romanian 1%
- Foreign-born
- 3% · Canada
- Languages at home
- 95% English-only · Spanish 4% French/Haitian/Cajun 1%
Political lean MEDSL · Duval
- 2024 margin
- Toss-up / Even · D 48.7% · R 50.1% · Other 1.2%
- 2008→2024 swing
- +0.4pp no change · 2008: -1.9pp · 2024: -1.5pp
- All cycles
- 2024: R+1.5 2020: D+3.8 2016: R+1.5 2012: R+3.6 2008: R+1.9
Not yet ingested
- Civics
- —
Market trends
- HPI YoY
- ▼ -53.92%
- Current HPI
- 189.5977
- Rent YoY
- ▲ 1.81%
- Metro
- Jacksonville, FL
- State GDP YoY
- ▲ 3.28%
- F500 in state
- 36
Industry mix (Fortune 500 HQ in FL)
| Industry | F500 HQs | Revenue |
|---|---|---|
| Industrial Technology | 2 | $29B |
|
||
| Insurance | 2 | $17B |
|
||
| Retail | 1 | $60B |
|
||
| Technology Distribution | 1 | $58B |
|
||
| Homebuilding | 1 | $35B |
|
||
| Technology Manufacturing | 1 | $35B |
|
||
Price history
+519.0% since first listed52 events — show timeline
- 2026-06-15 Listed $78,000 realMLS
- 2026-05-22 Listing Removed — realMLS
- 2026-04-23 Price Changed $78,000 realMLS
- 2026-04-22 Listed $85,000 realMLS
- 2026-02-11 Listing Removed — realMLS
- 2026-01-07 Price Changed $78,000 realMLS
- 2025-12-23 Price Changed $79,000 realMLS
- 2025-12-09 Relisted — realMLS
- 2025-10-20 Relisted — realMLS
- 2025-10-20 Listing Removed — realMLS
- 2025-07-15 Listing Removed — realMLS
- 2025-03-28 Price Changed $85,000 realMLS
- 2025-03-27 Relisted — realMLS
- 2025-02-05 Rental Removed $850 BUILDIUM
- 2025-01-07 Price Changed $850 BUILDIUM
- 2024-12-26 Listing Removed — realMLS
- 2024-11-28 Listed for Rent $900 BUILDIUM
- 2024-08-20 Price Changed $89,000 realMLS
- 2024-07-19 Relisted — realMLS
- 2024-07-17 Listing Removed — realMLS
- 2024-02-29 Relisted — realMLS
- 2024-02-29 Price Changed $95,000 realMLS
- 2023-12-14 Rental Removed $825 BUILDIUM
- 2023-11-28 Listing Removed — realMLS
- 2023-11-16 Price Changed $98,000 realMLS
- 2023-11-16 Relisted — realMLS
- 2023-11-15 Price Changed $825 BUILDIUM
- 2023-11-14 Listing Removed — realMLS
- 2023-09-21 Listed for Rent — BUILDIUM
- 2023-07-27 Price Changed $100,000 realMLS
- 2023-07-26 Listed $149,500 realMLS
- 2021-01-27 Sold (Public Records) $72,000 Public Records
- 2021-01-12 Sold (MLS) $72,000 realMLS
- 2020-12-28 Pending — realMLS
- 2020-11-07 Price Changed $75,000 realMLS
- 2020-10-10 Price Changed $85,000 realMLS
- 2020-09-15 Price Changed $92,000 realMLS
- 2020-09-14 Listed $87,000 realMLS
- 2020-07-07 Sold (MLS) $36,000 realMLS
- 2020-06-14 Pending — realMLS
- 2020-03-16 Price Changed $42,500 realMLS
- 2020-03-16 Relisted — realMLS
- 2020-03-13 Listing Removed — realMLS
- 2019-10-18 Price Changed $49,900 realMLS
- 2019-10-15 Price Changed $49,000 realMLS
- 2019-09-13 Listed $55,000 realMLS
- 2007-08-13 Listing Removed — realMLS
- 2007-04-13 Listed $39,900 realMLS
- 2005-10-06 Sold (MLS) $21,000 realMLS
- 2005-04-20 Listed $24,900 realMLS
- 2003-10-01 Sold (Public Records) $41,000 Public Records
- 1984-12-01 Sold (Public Records) $12,600 Public Records
Property tax history
+16.6%/yrLatest (2025): $1,676 · +16.4% YoY. Source: county tax records.
Cash-flow waterfall
monthlySold comps — $/sqft
last 12 mo · ≤1 miLoading sold comps…