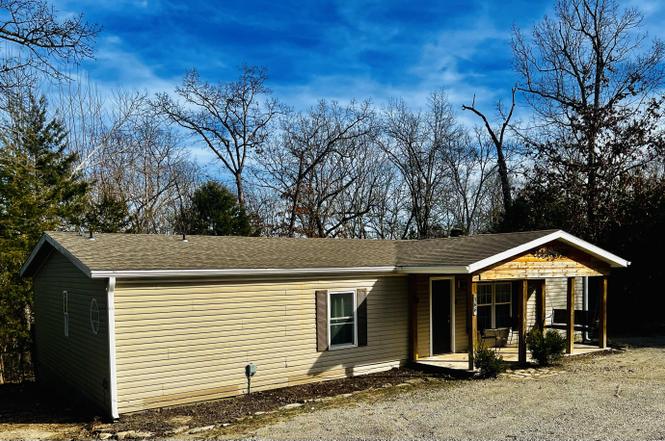
166 Ramona Ln · Kimberling City, MO
Flood risk 1/10 · Minimal
- FEMA flood zone
- X (unshaded)
- Chance of flooding over 30 yrs
- 0.0%
- Est. flood insurance / yr
- $507 – $1,088
Fire risk 1/10 · Minimal
- Est. fire insurance / yr
- $1,054 – $1,958
Heat risk 4/10 · Minor
- Hot days now (above 104°F)
- 7 days/yr
- Hot days in 30 yrs
- 20 days/yr
Wind risk 2/10 · Minimal
- Chance of severe wind over 30 yrs
- 1.0%
Air-quality risk 1/10 · Minimal
- Unhealthy air days now
- 0 days/yr
- Unhealthy air days in 30 yrs
- 0 days/yr
Risk factors via First Street. Map © Google.
Why this score? — see what drove the B- grade
The composite is a weighted blend of 9 inputs, each scored 0–100. Each bar is that input's sub-score; the figure is the points it added to the 100-point composite (weight × sub-score).
- Cash flow +27.0/30.0
- ARV discount +15.0/15.0
- DSCR +9.4/10.0
- 1% rule +5.9/10.0
- Livability +3.5/5.0
- Schools +3.2/10.0
- Rent growth +2.5/5.0
- Condition / age +2.5/5.0
- Appreciation +0.0/10.0
$159,900
🖨 Deal sheet (PDF) 📄 Offer letter ✓ Due diligence
Listing remarks MLS
Come take a look at this spacious 3 bed, 2 bath, manufactured home on about half an acre in Kimberling City. This fantastic home features a spacious Kitchen, Open Living Room, and big Bedrooms. This home qualifies for FHA Financing with a Repair Escrow. HUD homes are Sold AS IS. Neither the seller nor the listing broker makes any representations or warranties as to the accuracy of this listing data sheet. Buyer and Buyers Agent to do their own due diligence.
Key facts
- En suite bathroom
- Open floor plan
- Gigantic back deck
Tags
Neighborhood map
What this means for you Summary
Snapshot
- This is a 3-bed/2.0-bath manufactured listed at $160k.
Deal economics
- At list price, monthly cash flow is $450 ($5k/yr) — positive.
- The deal already cash-flows at list — no discount required.
- Meets the 1% rule at list price ($2k rent vs $160k).
- Recommended offer: $155k (3.0% below list) — sets the bar for market timing.
- Cap rate 9.7% vs local median 1.7% in Kimberling City — top-decile yield for the area; either an underpriced asset or a hidden risk that comps aren't pricing in. Stress-test before assuming the spread holds.
Location & tenants
- Location reads 69/100 on livability (#162 in MO) — a middle-class / working-renter tenant base. Strengths: crime A+, cost of living A+, housing A+; Watch: health & safety C-, employment D, amenities F.
- Reeds Spring R-IV (rural): math 34% / reading 42% proficiency, ranked #182 of 324 in MO (top 56%) — families likely to look elsewhere, expect single-tenant / working-renter base with shorter leases.
- Zoned schools: Reeds Spring Elem. (math 33% / reading 33%, grade F, #744 of 1,115 statewide, top 67%, 358 students, 62% FRL); Reeds Spring Middle (math 31% / reading 46%, grade F, #202 of 391 statewide, top 54%, 286 students, 56% FRL); Reeds Spring High (math 32% / reading 47%, grade F, #247 of 521 statewide, top 55%, 602 students, 47% FRL) — zoned schools at 55% FRL track the district average.
- Market conditions: 288 active listings in the ZIP; 1 comparable units currently listed for rent nearby; 191 units permitted in Stone County in 2024 (0 in 5+ unit buildings).
Forward outlook
- Local home prices are declining (-3.0%/yr); year-one equity from $1k of loan paydown is wiped out by about $5k of value loss. Plan a longer hold.
- Stone County population projected at -30% by 2050 — secular population decline; favor cash flow + early exit over multi-decade hold.
- At projected returns (-3.0% appreciation + 3.0% rent growth), your $45k cash investment doubles in ~10 years — after that, you're playing with house money.
Negotiation context
- It's been on market 58 days — a 3% lower offer ($155k) is reasonable based on typical stale-listing flexibility.
- 2 sale attempts since 12y ago; this cycle's ask has dropped $20k (11%) from the opening price — seller is motivated, your offer sets the floor, not the list.
Questions for the listing agent
- It's been on market 58 days. Have you received any prior offers? Is the seller open to a 3% concession, seller financing, or rate buy-down credit?
- Is there a deadline driving the sale (1031 exchange, divorce, estate, relocation)? That informs how much negotiation room exists.
- Schools are D-rated, which usually means shorter tenancies and higher turnover. Who's the typical renter profile here, and what's been the actual vacancy rate?
- What's the average days-on-market for RENTAL listings here right now (not sales)? A rising rental-DOM trend means longer vacancies and softer asking-rent achievability than the comps imply.
- What's the recent tenant-quality profile in this submarket — average credit score on applications, eviction rate, late-payment / NSF rate, and stable-employment percentage? A property-management company in the area should have these aggregated.
- How much new for-sale + rental construction is in the pipeline within 1–3 miles? Heavy new supply typically softens prices + rents 12–24 months out; constrained supply supports both.
Investment metrics
- 1% rule
- 1.09% ✓
- Cap rate
- 9.67%
- Cash-on-cash
- 12.05%
- DSCR
- 1.54
- GRM
- 7.6
CMA / ARV
- ARV (on-the-fly)
- $198,450
- Comps found
- 1
Show comp detail 1 sale within ~0.75 mi
| Address | Dist | Beds/Ba | Sqft | Sold | Price | $/sf | Match |
|---|---|---|---|---|---|---|---|
| 159 Ramona Ln | 0.04mi | 3/2.0 | 1,324 (-2%) | 1mo | $195,000 | $147 | 94 |
Match score weights: distance 35% · size 25% · config 20% · recency 20%. Top-matched comps best support the ARV.
Projected returns pro-forma
-3.0% appreciation · 3.0% rent growth · sell at horizon
- IRR
- 1.5%
- Equity multiple
- 1.06×
- Total profit
- $2,639
- Equity at exit
- $23,842
- IRR
- 11.1%
- Equity multiple
- 1.87×
- Total profit
- $38,841
- Equity at exit
- $13,825
Cash invested: $44,772 (down + closing). Projections, not guarantees.
Landlord ↔ Tenant lean methodology
- Overall (STATE)
- 81 Strongly Landlord-Friendly
- State Missouri
- 81 Strongly Landlord-Friendly · R+10
- County
- — inherits STATE
- City
- — inherits STATE
ZIP-level market 65686
- Home prices YoY
- -31.2%
- Active inventory
- 288
- Price-to-rent
- 7.6×
Monthly cashflow live
- Estimated rent
- $1,750 medium interval (Pro) →
- Mortgage (P&I)
- −$839
- Tax from tax record
- −$28 /mo · $334/yr
- Insurance
- −$67
- HOA
- −$0
- Vacancy / Maint / Mgmt
- −$368
- Net cashflow
- $450
Break-even live
Sensitivity live
| Price | -10% $540 | -5% $495 | +0% $450 | +5% $222 | +10% $167 |
|---|---|---|---|---|---|
| Rent | -10% $311 | -5% $380 | +0% $450 | +5% $519 | +10% $588 |
| Rate | -1.0pp $530 | -0.5pp $490 | base $450 | +0.5pp $408 | +1.0pp $366 |
UW: 25.0% down · 7.5% · 30yr · 1.5% tax · 5.0% vac · 8.0% maint · 8.0% mgmt
Financing live
Cash to close
- Down payment
- $39,975
- Closing costs
- $4,797
- Reserves months
- —
- Total cash needed
- —
Loan-product check · same deal, 3 products live
Conventional
25% down · 7.5% · 30yr
- Down + closing
- —
- Monthly P&I
- —
- Monthly cashflow
- —
- DSCR
- —
- Eligible?
- —
Personal DTI + credit; lowest rate.
DSCR
20% down · 8.5% · 30yr
- Down + closing
- —
- Monthly P&I
- —
- Monthly cashflow
- —
- DSCR
- —
- Eligible?
- —
No personal income docs; deal must DSCR.
Hard money
10% down · 12.0% · 12mo
- Down + closing
- —
- Monthly P&I
- —
- Monthly cashflow
- —
- DSCR
- —
- Eligible?
- —
Short-term bridge; refi at stabilization.
Rent comps 1 comps
| Address | Beds | Baths | Sqft | Rent | $/sqft | DOM | Units | Dist |
|---|---|---|---|---|---|---|---|---|
| 11 Kimberling Blvd Unit A Kimberling City, MO | 2.0 | 2.0 | 1140 | $1,750 | $1.54 | 44d | 1 | 1.03mi |
Listing history 6 events
-
2026-04-16status Pending
-
2026-04-07price $159,900
-
2026-03-24price $169,900
-
2026-02-17$179,900 Active
-
2015-02-17soldstatus 462-char remark
Show marketing remark (462 chars)
Come take a look at this spacious 3 bed, 2 bath, manufactured home on about half an acre in Kimberling City. This fantastic home features a spacious Kitchen, Open Living Room, and big Bedrooms. This home qualifies for FHA Financing with a Repair Escrow. HUD homes are Sold AS IS. Neither the seller nor the listing broker makes any representations or warranties as to the accuracy of this listing data sheet. Buyer and Buyers Agent to do their own due diligence.
-
2014-12-20$28,000 462-char remark
Show marketing remark (462 chars)
Come take a look at this spacious 3 bed, 2 bath, manufactured home on about half an acre in Kimberling City. This fantastic home features a spacious Kitchen, Open Living Room, and big Bedrooms. This home qualifies for FHA Financing with a Repair Escrow. HUD homes are Sold AS IS. Neither the seller nor the listing broker makes any representations or warranties as to the accuracy of this listing data sheet. Buyer and Buyers Agent to do their own due diligence.
ⓘ Source: listings_history table (triggers on properties + properties_extension) + one-shot
backfill from property_details.listing_events for pre-trigger history.
Tax reassessment forecast MO · Resets to sale price
- Current annual tax
- $334 · $28/mo
- Projected year-2 tax
- $1,551 · $129/mo
- Expected delta
- +$1,217/yr (+$101/mo · 364.3%)
ⓘ Screening estimate from a state-policy table — verify with the county assessor before closing.
Climate risk First Street
- Flood 1/10 Low FEMA zone X (unshaded) · 0% chance over 30 yrs
- Wildfire 1/10 Low
- Heat 4/10 Moderate 7 d/yr ≥104°F today · 20 d/yr by 30 yrs out
- Wind 2/10 Low 100% chance of damaging wind over 30 yrs
- Air quality 1/10 Low 0 unhealthy d/yr today · 0 by 30 yrs out
Nearby sold comps map
Loading sold comps map…
Walkable amenities ~0.75 mi
Loading nearby amenities…
Taxation est. · year 1
- Rental income
- $21,000
- − Mortgage interest
- −$8,957
- − Property taxes
- −$334
- − Insurance
- −$800
- − Repairs & maintenance
- −$1,680
- − Management
- −$1,680
- − Depreciation
- −$4,652
- Taxable income
- $2,898
- Est. tax owed @ 24.0%
- −$696
- After-tax cash flow
- $4,699/yr
For passive investors: Depreciation is non-cash, so a rental often shows a tax loss while cash-flowing — sheltering income. Rental losses are passive: they offset passive income freely, and up to $25,000/yr can offset ordinary (W-2) income if you actively participate and your MAGI is under $100k (phasing out to $0 by $150k); unused losses carry forward. On sale, claimed depreciation is recaptured at up to 25%, and gains may owe capital-gains tax (a 1031 exchange can defer both). Figures are a year-1 estimate at your 24.0% rate — not tax advice; consult a CPA.
Schools (NCES district)
- District
- Reeds Spring R-IV
- NCES district ID
- 2926160
- Math proficiency
- 34% ▼ -3.00%
- Reading proficiency
- 42% ▼ -1.00%
- Median HH income
- $42,158
- Composite
- 32.06/100
- National rank
- #5819
- State rank
- #182 of 324 in MO
Livability — Kimberling City
- Score
- 69/100
- State rank
- #162
- US rank
- #8879
Category grades
Schools grade is shown separately in the Schools card above.
Census & demographics
- Population (ZIP)
- 4,487
Population outlook (Stone County) Hauer SSP2
- Today (2025)
- 28,147 people
- By 2030
- 26,405 · -6.2%
- By 2040
- 22,762 · -19.1%
- By 2050
- 19,706 · -30.0%
- By 2075
- 14,742 · -47.6%
- By 2100
- 10,832 · -61.5%
Race, ethnicity, and origin ACS 2023
- Neighborhood character
- Predominantly White (96%)
- Race & ethnicity
- White 96% Two or more races 3%
- Common ancestry
- Lithuanian 4% Italian 3% Slovak 2%
- Foreign-born
- 2% · Canada
- Languages at home
- 99% English-only · Other Asian/Pacific 0%
Political lean MEDSL · Stone
- 2024 margin
- Solid R (+61.4) · D 18.9% · R 80.3%
- 2008→2024 swing
- -24.1pp toward R · 2008: -37.3pp · 2024: -61.4pp
- All cycles
- 2024: R+61.4 2020: R+61.1 2016: R+62.1 2012: R+49.2 2008: R+37.3
Not yet ingested
- Civics
- —
Market trends
- HPI YoY
- ▼ -90.17%
- Current HPI
- 198.5699
- Rent YoY
- —
- Metro
- —
- State GDP YoY
- ▲ 1.84%
- F500 in state
- 20
Industry mix (Fortune 500 HQ in MO)
| Industry | F500 HQs | Revenue |
|---|---|---|
| Healthcare | 1 | $163B |
|
||
| Insurance | 1 | $21B |
|
||
| Industrial Technology | 1 | $17B |
|
||
| Retail | 1 | $16B |
|
||
| Industrial Distribution | 1 | $10B |
|
||
| Utilities | 1 | $9B |
|
||
Price history
+471.1% since first listed6 events — show timeline
- 2026-04-16 Pending — SOMO
- 2026-04-07 Price Changed $159,900 SOMO
- 2026-03-24 Price Changed $169,900 SOMO
- 2026-02-17 Listed $179,900 SOMO
- 2015-02-17 Sold (MLS) — SOMO
- 2014-12-20 Listed $28,000 SOMO
Property tax history
+1.5%/yrLatest (2025): $334 · -0.0% YoY. Source: county tax records.
Cash-flow waterfall
monthlySold comps — $/sqft
last 12 mo · ≤1 miLoading sold comps…