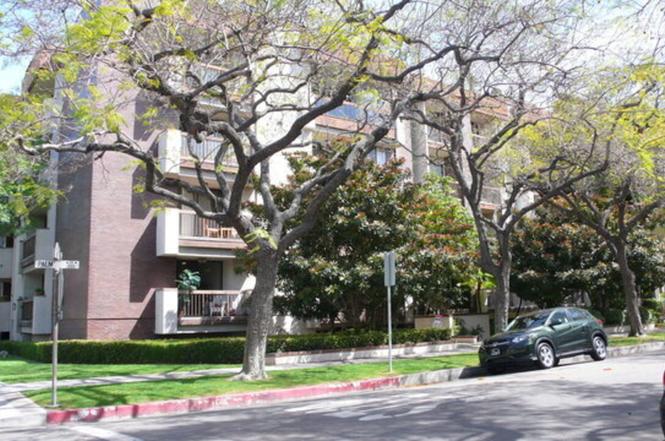
324 N Palm Dr #204 · Beverly Hills, CA
Flood risk 1/10 · Minimal
- FEMA flood zone
- X (unshaded)
- Chance of flooding over 30 yrs
- 0.0%
- Est. flood insurance / yr
- $507 – $1,088
Fire risk 1/10 · Minimal
- Est. fire insurance / yr
- $659 – $1,223
Heat risk 6/10 · Moderate
- Hot days now (above 86°F)
- 7 days/yr
- Hot days in 30 yrs
- 21 days/yr
Wind risk 1/10 · Minimal
- Chance of severe wind over 30 yrs
- —
Air-quality risk 5/10 · Moderate
- Unhealthy air days now
- 7 days/yr
- Unhealthy air days in 30 yrs
- 7 days/yr
Risk factors via First Street. Map © Google.
Why this score? — see what drove the D- grade
The composite is a weighted blend of 9 inputs, each scored 0–100. Each bar is that input's sub-score; the figure is the points it added to the 100-point composite (weight × sub-score).
- Appreciation +9.8/10.0
- ARV discount +7.5/15.0
- Schools +5.9/10.0
- Cash flow +4.7/30.0
- Livability +3.7/5.0
- Rent growth +2.9/5.0
- Condition / age +2.5/5.0
- 1% rule +1.2/10.0
- DSCR +0.0/10.0
$1,395,000
🖨 Deal sheet 📄 Offer letter ✓ Due diligence
Listing remarks MLS
Beautiful single-level condo. Prime Beverly Hills area north of Burton Way on a gorgeous tree-lined street. Security building with a doorman, a lovely large lobby, and two remodeled elevators for fast service. Front-facing large light-filled condo with two incredible view balconies. Formal entry with large storage closets. Large living room with fireplace. Large formal dining area. Sunny kitchen with room for an eat-in breakfast table or a great work office area. Inside laundry area set up for side by side washer/dryer. Primary bedroom has a private balcony, an oversized walk-in closet, and a wall of additional wardrobe closets. Primary bath has dual sinks, an oversized soaking tub and a separate shower. Generous sized second bedroom. Central heat and central A/C. Two side-by-side parking spaces in the secure garage. Extra private storage room in the garage. Incredible rooftop sundeck with panoramic views.
Key facts
- New hardwood floors
- Security building
- Fireplace
Tags
Property features AI
Finance
- Other: Disclosures: CC&R, sold/as-is
- HOA & community: HOA amenities include exercise room; HOA amenities include sun deck; HOA fees paid monthly; Pet rules: contact association; Complex has 28 units; Complex name: Royal Palm
Exterior
- Parking: Private gated 2-car garage; 2 covered parking spaces (total 2 spaces)
- Security: Automatic gate; Other security features
- Home design: Residential condo/co-op; Low-rise attached condominium; Single-level living; Entry on 2nd floor; Facing unspecified direction
- Construction: Attached construction
- Exterior features: Tree-top view; Sun deck; Has view
Interior
- Kitchen: Dishwasher; Range/Oven; Refrigerator; Garbage disposal
- Flooring: Marble floors; Hardwood floors
- Bathrooms: 2 full bathrooms
- Heating & cooling: Central heating; Central cooling
- Interior features: Family room; Breakfast area; Built-in cabinets; Fireplace in living room
- Laundry & utility: In-unit laundry with washer and dryer; Laundry area
Neighborhood map
What this means for you Summary
Snapshot
- This is a 3-bed/2.0-bath condo listed at $1.40M.
Deal economics
- At list price, monthly cash flow is $-3k ($-42k/yr) — negative.
- To cash-flow at today's rent, offer at most $985k (29.4% below list).
- To meet the 1% rule (rent ≥ 1% of price), the offer needs to be $862k (38.2% below list).
- Recommended offer: $862k (38.2% below list) — sets the bar for 1% rule.
Location & tenants
- Location reads 74/100 on livability (#138 in CA, #4,810 nationally) — a middle-class / working-renter tenant base. Strengths: schools A+, amenities A+, commute A+; Watch: housing C-, health & safety C-, crime F.
- Beverly Hills Unified (suburban): math 57% / reading 73% proficiency, ranked #61 of 517 in CA (top 12%) — acceptable for families but not a draw, mixed tenant base, ~2y average lease; only 7% free/reduced lunch — higher-income household profile.
- Market conditions: Rents rising (+1.7%/yr); 308 active listings in the ZIP; 40 comparable units currently listed for rent nearby; rentals at typical pace (median 25d on market — plan ~3-4 weeks tenant-placement turnaround); 48% of comp listings sitting > 30 days — soft ceiling on asking rent; high-income renter base; 19,697 units permitted in Los Angeles County in 2024 (9,426 in 5+ unit buildings).
- At $8,621/mo this rent would consume 55% of the median local household income ($188k/yr) (locally 911% of renters already pay >50% of income on rent) — very limited rent-growth headroom before tenants either downsize or default.
Forward outlook
- In year one you build about $143k of equity ($10k loan paydown + $133k appreciation (9.6% local appreciation)).
- Los Angeles County population projected at +9% by 2050 — modest demand growth; plan on rents tracking national, not racing it.
- By year 2, paydown + projected appreciation supports a ~$230k cash-out refi (75% LTV) — recoverable capital for the next deal without selling this one.
Negotiation context
- Only 3 days on market — expect competitive offers; lowballing is unlikely to land.
- 4 sale attempts since 29y ago with the ask held roughly flat each time — persistent listings suggest the price (not the market) is what's stuck; bring a comps-based counter.
- Current owner paid $1.15M; 21% above their basis — modest negotiation headroom, anchor on the comps not their cost.
Risks & watch-outs
- Climate carrying-cost: extreme-heat days projected 7→21/yr by 2055 (HVAC capex compounding) — expect insurance premiums to compound above CPI over the hold.
Questions for the listing agent
- What do current leases actually rent for vs. the listed asking? Can we see a recent rent roll and the last 12 months of T-12 income?
- What does the HOA fee cover, when was the last increase, and are there any pending special assessments or reserve-fund shortfalls?
- Any open or pending special assessments — roof, HVAC, plumbing, elevator, façade? What's the per-unit balance and payoff schedule, and is the seller paying it off at close or rolling it to the buyer?
- Is there a deadline driving the sale (1031 exchange, divorce, estate, relocation)? That informs how much negotiation room exists.
- Schools are A-rated — typically a magnet for longer-tenancy family renters. What's the average tenant stay here, and is there a school-zone premium baked into asking?
- Crime grade is F in this area — have there been break-ins, vandalism, or insurance claims at this property in the last 3 years? What carrier currently insures it and at what premium?
- The area grade is low — what's the realistic commute time and amenity access for the typical tenant pool here? Any planned neighborhood developments (good or bad) we should know about?
- What's the average days-on-market for RENTAL listings here right now (not sales)? A rising rental-DOM trend means longer vacancies and softer asking-rent achievability than the comps imply.
- What's the recent tenant-quality profile in this submarket — average credit score on applications, eviction rate, late-payment / NSF rate, and stable-employment percentage? A property-management company in the area should have these aggregated.
- How much new apartment / multifamily construction is in the pipeline within 1–3 miles? Heavy new supply (>2% of stock underway) typically softens rents 12–24 months out; light construction supports rent growth.
Investment metrics
- 1% rule
- 0.62% ✗
- Cap rate
- 3.28%
- Cash-on-cash
- -10.75%
- DSCR
- 0.52
- GRM
- 13.5
CMA / ARV
No comps found within radius.
Projected returns pro-forma
9.56% appreciation · 1.73% rent growth · sell at horizon
- IRR
- 15.4%
- Equity multiple
- 2.24×
- Total profit
- $484,443
- Equity at exit
- $1,211,890
- IRR
- 14.8%
- Equity multiple
- 5.02×
- Total profit
- $1,571,672
- Equity at exit
- $2,567,200
Cash invested: $390,600 (down + closing). Projections, not guarantees.
Landlord ↔ Tenant lean methodology
- Overall (STATE)
- 18 Strongly Tenant-Friendly
- State California
- 18 Strongly Tenant-Friendly · D+13
- County
- — inherits STATE
- City
- — inherits STATE
ZIP-level market 90210
- Home prices YoY
- 2.0%
- Rents YoY
- 1.7%
- Active inventory
- 308
- Price-to-rent
- 13.5×
Monthly cashflow live
- Estimated rent
- $8,621 high interval (Pro) →
- Mortgage (P&I)
- −$7,316
- Tax from tax record
- −$1,235 /mo · $14,817/yr
- Insurance
- −$581
- HOA est. from 1 same-building comp
- −$1,178
- Vacancy / Maint / Mgmt
- −$1,811
- Net cashflow
- $-3,499
Break-even live
UW: 25.0% down · 7.5% · 30yr · 1.5% tax · 5.0% vac · 8.0% maint · 8.0% mgmt
Financing live
Cash to close
- Down payment
- $348,750
- Closing costs
- $41,850
- Reserves months
- —
- Total cash needed
- —
Loan-product check · same deal, 3 products live
Conventional
25% down · 7.5% · 30yr
- Down + closing
- —
- Monthly P&I
- —
- Monthly cashflow
- —
- DSCR
- —
- Eligible?
- —
Personal DTI + credit; lowest rate.
DSCR
20% down · 8.5% · 30yr
- Down + closing
- —
- Monthly P&I
- —
- Monthly cashflow
- —
- DSCR
- —
- Eligible?
- —
No personal income docs; deal must DSCR.
Hard money
10% down · 12.0% · 12mo
- Down + closing
- —
- Monthly P&I
- —
- Monthly cashflow
- —
- DSCR
- —
- Eligible?
- —
Short-term bridge; refi at stabilization.
Rent comps 40 comps
| Address | Beds | Baths | Sqft | Rent | $/sqft | DOM | Units | Dist |
|---|---|---|---|---|---|---|---|---|
| 324 N Palm Dr #206 Beverly Hills, CA | 3.0 | 2.0 | 2014 | $7,750 | $3.85 | 18d | 1 | 0.02mi |
| 333 N Palm Dr Unit 310 Beverly Hills, CA | 2.0 | 3.0 | 1587 | $15,076 | $9.50 | 24d | 1 | 0.06mi |
| 339 N Oakhurst Dr Beverly Hills, CA | 2.0 | 2.5 | 1800 | $6,750 | $3.75 | 43d | 1 | 0.10mi |
| 350 N Palm Dr Beverly Hills, CA | 1.0–2.0 | 1.5–2.5 | 1562 | $21,500 | $13.76 | 4d | 13 | 0.14mi |
| 350 N Palm Dr Beverly Hills, CA | 1.0–2.0 | 1.5–2.5 | 1562 | $21,500 | $13.76 | 1d | 11 | 0.14mi |
| 9249 Burton Way #404 Beverly Hills, CA | 2.0 | 2.5 | 1567 | $8,500 | $5.42 | 15d | 1 | 0.14mi |
| 9152 Alden Dr Beverly Hills, CA | 2.0–3.0 | 2.5 | 1600 | $5,295 | $3.31 | 2d | 1 | 0.15mi |
| 9265 Burton Way Beverly Hills, CA | 2.0 | 2.0 | 1525 | $7,748 | $5.08 | 24d | 1 | 0.17mi |
| 326 N Doheny Dr Beverly Hills, CA | 4.0 | 3.0 | 2358 | $12,800 | $5.43 | 43d | 1 | 0.18mi |
| 403 N Oakhurst Dr Beverly Hills, CA | 2.0 | 2.0 | 1296 | $4,600 | $3.55 | 43d | 1 | 0.19mi |
| 9000 W 3rd St Los Angeles, CA | 1.0–2.0 | 2.0–2.5 | 1610 | $22,000 | $13.66 | 43d | 2 | 0.20mi |
| 408 N Palm Dr Beverly Hills, CA | 3.0 | 2.0 | 1600 | $5,350 | $3.34 | 24d | 1 | 0.21mi |
| 411 N Oakhurst Dr #305 Beverly Hills, CA | 2.0 | 3.0 | 1594 | $6,950 | $4.36 | 17d | 1 | 0.22mi |
| 9000 W 3rd St #104 Los Angeles, CA | 2.0 | 3.0 | 2400 | $29,800 | $12.42 | 1d | 1 | 0.22mi |
| 406 N Oakhurst Dr #202 Beverly Hills, CA | 2.0 | 2.0 | 1264 | $3,900 | $3.09 | 7d | 1 | 0.22mi |
| 412 N Palm Dr #302 Beverly Hills, CA | 2.0 | 2.0 | 1549 | $4,995 | $3.22 | 43d | 1 | 0.22mi |
| 9297 Burton Way Apt 1 Beverly Hills, CA | 3.0 | 2.0 | 1750 | $5,795 | $3.31 | 43d | 1 | 0.23mi |
| 9297 Burton Way #3 Beverly Hills, CA | 3.0 | 2.0 | 1750 | $6,695 | $3.83 | 15d | 1 | 0.23mi |
| 9297 Burton Way Unit A Beverly Hills, CA | 3.0 | 2.0 | 1750 | $5,795 | $3.31 | 15d | 1 | 0.23mi |
| 9297 Burton Way Unit C Beverly Hills, CA | 3.0 | 2.0 | 1750 | $6,795 | $3.88 | 43d | 1 | 0.23mi |
| 411 N Palm Dr Beverly Hills, CA | 2.0–3.0 | 2.0–2.5 | 1475 | $4,900 | $3.32 | 43d | 6 | 0.23mi |
| 209 N Doheny Dr Beverly Hills, CA | 3.0 | 4.0 | 2454 | $14,995 | $6.11 | 43d | 1 | 0.24mi |
| 412 N Oakhurst Dr Beverly Hills, CA | 2.0 | 2.0 | 1310 | $4,500 | $3.44 | 43d | 2 | 0.25mi |
| 115 N Wetherly Dr Los Angeles, CA | 3.0 | 2.0 | 1250 | $3,398 | $2.72 | 24d | 1 | 0.25mi |
| 245 N Wetherly Dr Beverly Hills, CA | 3.0 | 3.5 | 2015 | $13,500 | $6.70 | 43d | 1 | 0.25mi |
| 9303 Burton Way Unit A Beverly Hills, CA | 3.0 | 3.0 | 2154 | $9,950 | $4.62 | 3d | 1 | 0.25mi |
| 419 N Oakhurst Dr #203 Beverly Hills, CA | 2.0 | 3.0 | 1616 | $4,995 | $3.09 | 7d | 1 | 0.26mi |
| 8930 Burton Way #302 Beverly Hills, CA | 2.0 | 2.5 | 1300 | $4,699 | $3.61 | 43d | 1 | 0.29mi |
| 9323 Burton Way Unit A Beverly Hills, CA | 3.0 | 3.0 | 2145 | $8,495 | $3.96 | 43d | 1 | 0.30mi |
| 303 N La Peer Dr Beverly Hills, CA | 2.0 | 2.0 | 1500 | $4,222 | $2.81 | 43d | 4 | 0.32mi |
| 429 N Oakhurst Dr #203 Beverly Hills, CA | 2.0 | 2.0 | 1289 | $4,900 | $3.80 | 43d | 1 | 0.33mi |
| 101 N La Peer Dr Los Angeles, CA | 3.0 | 2.0 | 1517 | $7,247 | $4.78 | 43d | 1 | 0.33mi |
| 433 N Palm Dr Beverly Hills, CA | 1.0–2.0 | 1.5–2.5 | 1750 | $4,750 | $2.71 | 43d | 2 | 0.34mi |
| 325 S Swall Dr Los Angeles, CA | 2.0 | 2.0 | 1248 | $4,950 | $3.97 | 43d | 2 | 0.34mi |
| 325 S Swall Dr #301 Los Angeles, CA | 2.0 | 2.0 | 1246 | $4,950 | $3.97 | 20d | 1 | 0.34mi |
| 435 N Oakhurst Dr Unit 905 Beverly Hills, CA | 2.0 | 2.5 | 1500 | $6,850 | $4.57 | 21d | 1 | 0.35mi |
| 138 N Almont Dr West Hollywood, CA | 3.0 | 2.0 | 2000 | $7,800 | $3.90 | 43d | 1 | 0.35mi |
| 113 N Doheny Dr Beverly Hills, CA | 4.0 | 2.5 | 2425 | $9,000 | $3.71 | 2d | 1 | 0.35mi |
| 432 N Oakhurst Dr #402 Beverly Hills, CA | 3.0 | 4.0 | 2010 | $11,995 | $5.97 | 16d | 1 | 0.36mi |
| 165 N Almont Dr Beverly Hills, CA | 3.0 | 2.0 | 1250 | $3,595 | $2.88 | 15d | 1 | 0.37mi |
HOA detail condo
- Monthly dues
- $0 · $0/yr
- Likely covers
- doormansecurity
- Assessments
- None detected in remarks — confirm with the listing agent.
Listing history 4 events
-
2026-06-18days on market $1,395,000 Active 3 DOM
-
2026-06-17days on market $1,395,000 Active 2 DOM
-
2026-06-16remarks 699-char remark
-
2026-06-16$1,395,000 Active 1 DOM
ⓘ Source: listings_history table (triggers on properties + properties_extension) + one-shot
backfill from property_details.listing_events for pre-trigger history.
Tax reassessment forecast CA · Resets to sale price
- Current annual tax
- $14,817 · $1,235/mo
- Projected year-2 tax
- $14,817 · $1,235/mo
- Expected delta
- $0/yr ($0/mo · 0.0%)
ⓘ Screening estimate from a state-policy table — verify with the county assessor before closing.
Climate risk First Street
- Flood 1/10 Low FEMA zone X (unshaded) · 0% chance over 30 yrs
- Wildfire 1/10 Low
- Heat 6/10 Major 7 d/yr ≥86°F today · 21 d/yr by 30 yrs out
- Wind 1/10 Low
- Air quality 5/10 Major 7 unhealthy d/yr today · 7 by 30 yrs out
Nearby sold comps map
Loading sold comps map…
Walkable amenities ~0.75 mi
Loading nearby amenities…
Taxation est. · year 1
- Rental income
- $103,458
- − Mortgage interest
- −$78,142
- − Property taxes
- −$14,817
- − Insurance
- −$6,975
- − Repairs & maintenance
- −$8,277
- − Management
- −$8,277
- − HOA
- −$14,136
- − Depreciation
- −$40,582
- Taxable loss
- −$67,747
- Est. tax savings @ 24.0%
- +$16,259
- After-tax cash flow
- $-25,724/yr
For passive investors: Depreciation is non-cash, so a rental often shows a tax loss while cash-flowing — sheltering income. Rental losses are passive: they offset passive income freely, and up to $25,000/yr can offset ordinary (W-2) income if you actively participate and your MAGI is under $100k (phasing out to $0 by $150k); unused losses carry forward. On sale, claimed depreciation is recaptured at up to 25%, and gains may owe capital-gains tax (a 1031 exchange can defer both). Figures are a year-1 estimate at your 24.0% rate — not tax advice; consult a CPA.
Schools (NCES district)
- District
- Beverly Hills Unified
- NCES district ID
- 0604830
- Math proficiency
- 57% ▼ -7.00%
- Reading proficiency
- 73% ▼ -2.00%
- Median HH income
- $89,439
- Composite
- 58.93/100
- National rank
- #969
- State rank
- #61 of 517 in CA
Livability — Beverly Hills
- Score
- 74/100
- State rank
- #138
- US rank
- #4810
Category grades
Schools grade is shown separately in the Schools card above.
Census & demographics
- Census place
- Beverly Hills, CA
- County
- Los Angeles County · 9,444,647 people
- City population
- 38,852
- Metro
- Los Angeles-Long Beach-Anaheim, CA
- Population (ZIP)
- 19,004
- Household income
- $187,801
- Rent vs Own
- Severe rent burden
- 911.0
Population outlook (Los Angeles County) Hauer SSP2
- Today (2025)
- 10,940,515 people
- By 2030
- 11,256,481 · +2.9%
- By 2040
- 11,729,929 · +7.2%
- By 2050
- 11,948,407 · +9.2%
- By 2075
- 11,818,114 · +8.0%
- By 2100
- 10,842,928 · -0.9%
Race, ethnicity, and origin ACS 2023
- Neighborhood character
- Predominantly White (81%)
- Race & ethnicity
- White 81% Two or more races 8% Asian 7% Hispanic / Latino 6% Black 2%
- Hispanic origin (detail)
- Mexican 3%
- Common ancestry
- Scotch-Irish 5% Italian 4% Romanian 3%
- Foreign-born
- 36% · Canada, China, South Korea
- Languages at home
- 59% English-only · Other Indo-European 21% Spanish 4% French/Haitian/Cajun 3%
Political lean MEDSL · Los Angeles
- 2024 margin
- Solid D (+32.9) · D 64.8% · R 31.9% · Other 3.3%
- 2008→2024 swing
- -7.4pp toward R · 2008: 40.4pp · 2024: 32.9pp
- All cycles
- 2024: D+32.9 2020: D+44.2 2016: D+48.0 2012: D+40.0 2008: D+40.4
Not yet ingested
- Civics
- —
Market trends
- HPI YoY
- ▲ 9.56%
- Current HPI
- 495.052
- Rent YoY
- ▲ 1.73%
- Metro
- Los Angeles-Long Beach-Anaheim, CA
- State GDP YoY
- ▲ 3.21%
- F500 in state
- 116
Industry mix (Fortune 500 HQ in CA)
| Industry | F500 HQs | Revenue |
|---|---|---|
| Technology | 27 | $1,492B |
|
||
| Financial Services | 3 | $174B |
|
||
| Retail | 3 | $44B |
|
||
| Insurance | 3 | $26B |
|
||
| Media / Entertainment | 2 | $115B |
|
||
| Pharmaceuticals / Biotech | 2 | $62B |
|
||
Price history
+353.7% since first listed14 events — show timeline
- 2026-06-15 Listed $1,395,000 TheMLS
- 2021-09-30 Sold (Public Records) $1,150,000 Public Records
- 2021-09-30 Sold (MLS) $1,150,000 TheMLS
- 2021-09-03 Pending — TheMLS
- 2021-08-16 Contingent — TheMLS
- 2021-08-09 Listed $1,225,000 TheMLS
- 1998-04-14 Sold (Public Records) $338,000 Public Records
- 1998-04-14 Sold (MLS) $335,000 TheMLS
- 1998-03-11 Delisted — TheMLS
- 1998-01-19 Listed $349,000 TheMLS
- 1997-07-12 Delisted — TheMLS
- 1997-05-12 Listed — TheMLS
- 1988-05-03 Sold (Public Records) $330,000 Public Records
- 1987-06-01 Sold (Public Records) $307,500 Public Records
Property tax history
+7.2%/yrLatest (2025): $14,817 · +2.2% YoY. Source: county tax records.
Cash-flow waterfall
monthlySold comps — $/sqft
last 12 mo · ≤1 miLoading sold comps…