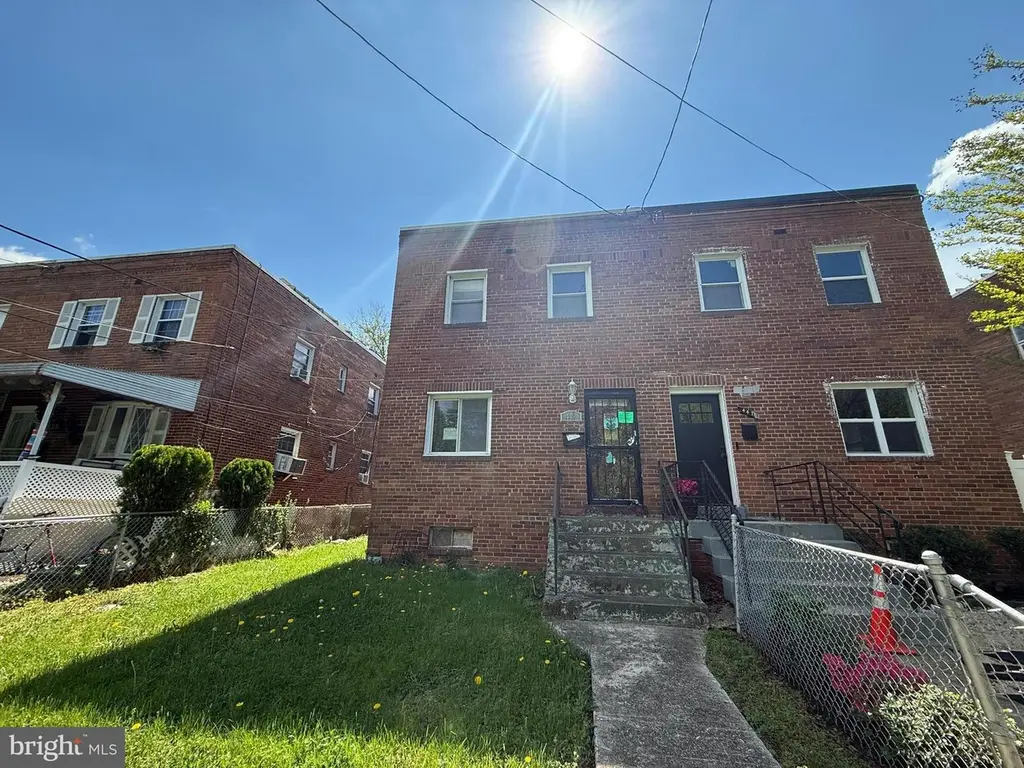
449 Valley Ave SE · Washington, DC
Flood risk 1/10 · Minimal
- FEMA flood zone
- X (unshaded)
- Chance of flooding over 30 yrs
- 0.0%
- Est. flood insurance / yr
- $473 – $860
Fire risk 3/10 · Minor
- Est. fire insurance / yr
- $631 – $1,173
Heat risk 7/10 · Major
- Hot days now (above 104°F)
- 7 days/yr
- Hot days in 30 yrs
- 16 days/yr
Wind risk 4/10 · Minor
- Chance of severe wind over 30 yrs
- 21.0%
Air-quality risk 3/10 · Minor
- Unhealthy air days now
- 2 days/yr
- Unhealthy air days in 30 yrs
- 3 days/yr
Risk factors via First Street. Map © Google.
Why this score? — see what drove the B grade
The composite is a weighted blend of 9 inputs, each scored 0–100. Each bar is that input's sub-score; the figure is the points it added to the 100-point composite (weight × sub-score).
- Cash flow +26.2/30.0
- ARV discount +15.0/15.0
- DSCR +8.9/10.0
- 1% rule +7.0/10.0
- Livability +3.7/5.0
- Schools +3.6/10.0
- Rent growth +3.5/5.0
- Condition / age +2.5/5.0
- Appreciation +0.0/10.0
$194,000
🖨 Deal sheet 📄 Offer letter ✓ Due diligence
Listing remarks
This 3-bedroom, 2-bath home presents a unique opportunity with endless potential. Featuring a walk-up basement and a fenced backyard, the property offers a flexible layout and ample outdoor space. Conveniently situated near major commuter routes, public transportation, shopping, and dining. Whether you are looking to restore, redesign, or reimagine, this property provides a great canvas in an established neighborhood.
Key facts
- Ample outdoor space
- Flexible layout
- Fenced backyard
Tags
Property features AI
Finance
- Other: Below-grade unfinished area of 648; Above-grade finished area of 1,296
- Financial info: Fee simple ownership
Exterior
- Parking: On-street parking
- Utilities: Public water; Public sewer
- Home design: Semi-detached home; Above-grade and below-grade living areas
- Construction: Brick construction; Block foundation; Built year recorded by assessor
- Exterior features: No tidal water
Interior
- Bedrooms: One bedroom on the main level; Two bedrooms on the first upper level
- Bathrooms: Two full bathrooms (one on main level, one on first upper level)
- Heating & cooling: Hot water heating; Natural gas heating fuel; Electric cooling fuel
- Interior features: Assessor-recorded living area; Walkout unfinished basement
Neighborhood map
What this means for you Summary
Snapshot
- This is a 3-bed/2.0-bath townhouse listed at $194k.
Deal economics
- At list price, monthly cash flow is $496 ($6k/yr) — positive.
- The deal already cash-flows at list — no discount required.
- Meets the 1% rule at list price ($2k rent vs $194k).
- Recommended offer: $188k (3.0% below list) — sets the bar for market timing.
- Cap rate 9.4% vs local median 2.5% in Washington — top-decile yield for the area; either an underpriced asset or a hidden risk that comps aren't pricing in. Stress-test before assuming the spread holds.
Location & tenants
- Location reads 73/100 on livability (#1 in DC) — a middle-class / working-renter tenant base. Strengths: amenities A+, commute A+, employment A+; Watch: crime F, cost of living F.
- District Of Columbia Public Schools (urban): math 33% / reading 40% proficiency, ranked #8 of 32 in DC (top 25%) — families likely to look elsewhere, expect single-tenant / working-renter base with shorter leases; 65% free/reduced lunch — lower-income household profile, screen leases tightly.
- Market conditions: Rents rising (+4.0%/yr); 145 active listings in the ZIP; 40 comparable units currently listed for rent nearby; rentals at typical pace (median 23d on market — plan ~3-4 weeks tenant-placement turnaround); 1,737 units permitted in District of Columbia in 2024 (1,506 in 5+ unit buildings).
- At $2,325/mo this rent would consume 57% of the median local household income ($49k/yr) (locally 4530% of renters already pay >50% of income on rent) — very limited rent-growth headroom before tenants either downsize or default.
Forward outlook
- Local home prices are declining (-3.0%/yr); year-one equity from $1k of loan paydown is wiped out by about $6k of value loss. Plan a longer hold.
- District of Columbia County population projected at +50% by 2050 — long-run rental-demand tailwind backs the buy-and-hold thesis.
- At projected returns (-3.0% appreciation + 4.0% rent growth), your $54k cash investment doubles in ~9 years — after that, you're playing with house money.
Negotiation context
- It's been on market 31 days — a 3% lower offer ($188k) is reasonable based on typical stale-listing flexibility.
- Current owner paid $20k; list at $194k implies a 846% gain — meaningful room to come down on a strong offer.
Risks & watch-outs
- Watch-outs: built in 1948 — expect roof / HVAC / electrical / plumbing capex.
- Climate carrying-cost: extreme-heat days projected 7→16/yr by 2055 (HVAC capex compounding) — expect insurance premiums to compound above CPI over the hold.
Questions for the listing agent
- It's been on market 31 days. Have you received any prior offers? Is the seller open to a 3% concession, seller financing, or rate buy-down credit?
- Built in 1948 — when were the roof, HVAC, electrical panel, plumbing, and water heater last replaced?
- Is there a deadline driving the sale (1031 exchange, divorce, estate, relocation)? That informs how much negotiation room exists.
- Crime grade is F in this area — have there been break-ins, vandalism, or insurance claims at this property in the last 3 years? What carrier currently insures it and at what premium?
- What's the average days-on-market for RENTAL listings here right now (not sales)? A rising rental-DOM trend means longer vacancies and softer asking-rent achievability than the comps imply.
- What's the recent tenant-quality profile in this submarket — average credit score on applications, eviction rate, late-payment / NSF rate, and stable-employment percentage? A property-management company in the area should have these aggregated.
- How much new for-sale + rental construction is in the pipeline within 1–3 miles? Heavy new supply typically softens prices + rents 12–24 months out; constrained supply supports both.
Investment metrics
- 1% rule
- 1.20% ✓
- Cap rate
- 9.36%
- Cash-on-cash
- 10.95%
- DSCR
- 1.49
- GRM
- 7.0
CMA / ARV
- ARV (on-the-fly)
- $308,448
- Comps found
- 12
Show comp detail 12 sales within ~0.75 mi
| Address | Dist | Beds/Ba | Sqft | Sold | Price | $/sf | Match |
|---|---|---|---|---|---|---|---|
| 157 Wilmington Pl SE | 0.28mi | 3/2.5 | 1,200 (-7%) | 4mo | $240,000 | $200 | 69 |
| 657 Brandywine St SE | 0.29mi | 3/1.5 | 1,416 (+9%) | 2mo | $363,000 | $256 | 67 |
| 766 Congress St SE | 0.51mi | 3/2.0 | 1,280 (-1%) | 11mo | $425,000 | $332 | 65 |
| 4003 Blakney Ln SE | 0.48mi | 3/2.5 | 1,320 (+2%) | 11mo | $314,000 | $238 | 63 |
| 406 Brandywine St SE | 0.26mi | 2/1.5 (-1) | 1,152 (-11%) | 1mo | $255,000 | $221 | 61 |
| 4613 Springmaid Ln | 0.60mi | 3/3.0 | 1,292 (-0%) | 8mo | $345,000 | $267 | 61 |
| 139 Wilmington Pl SE | 0.32mi | 3/2.5 | 1,436 (+11%) | 8mo | $349,900 | $244 | 59 |
| 427 Brandywine St SE | 0.28mi | 2/1.0 (-1) | 1,152 (-11%) | 1mo | $184,300 | $160 | 58 |
| 3330 Brothers Pl SE | 0.67mi | 3/2.0 | 1,220 (-6%) | 1mo | $160,000 | $131 | 58 |
| 1203 Congress St SE | 0.70mi | 3/2.0 | 1,358 (+5%) | 4mo | $375,000 | $276 | 56 |
| 322 Raleigh St SE | 0.72mi | 2/1.0 (-1) | 1,268 (-2%) | 7mo | $250,000 | $197 | 48 |
| 1260 Barnaby Ter SE | 0.61mi | 3/1.5 | 1,134 (-12%) | 2mo | $207,100 | $183 | 47 |
Match score weights: distance 35% · size 25% · config 20% · recency 20%. Top-matched comps best support the ARV.
Projected returns pro-forma
-3.0% appreciation · 3.96% rent growth · sell at horizon
- IRR
- 1.2%
- Equity multiple
- 1.04×
- Total profit
- $2,437
- Equity at exit
- $28,926
- IRR
- 11.7%
- Equity multiple
- 1.96×
- Total profit
- $52,403
- Equity at exit
- $16,774
Cash invested: $54,320 (down + closing). Projections, not guarantees.
Landlord ↔ Tenant lean methodology
- Overall (CITY)
- 0 Strongly Tenant-Friendly
- State District of Columbia
- 12 Strongly Tenant-Friendly · D+43
- County
- — inherits STATE
- City Washington
- 0 Strongly Tenant-Friendly · D+43
ZIP-level market 20032
- Home prices YoY
- -15.6%
- Rents YoY
- 4.0%
- Active inventory
- 145
- Price-to-rent
- 7.0×
Monthly cashflow live
- Estimated rent
- $2,325 high interval (Pro) →
- Mortgage (P&I)
- −$1,017
- Tax est. 1.5%
- −$242 /mo · $2,910/yr
- Insurance
- −$81
- HOA
- −$0
- Vacancy / Maint / Mgmt
- −$488
- Net cashflow
- $496
Break-even live
UW: 25.0% down · 7.5% · 30yr · 1.5% tax · 5.0% vac · 8.0% maint · 8.0% mgmt
Financing live
Cash to close
- Down payment
- $48,500
- Closing costs
- $5,820
- Reserves months
- —
- Total cash needed
- —
Loan-product check · same deal, 3 products live
Conventional
25% down · 7.5% · 30yr
- Down + closing
- —
- Monthly P&I
- —
- Monthly cashflow
- —
- DSCR
- —
- Eligible?
- —
Personal DTI + credit; lowest rate.
DSCR
20% down · 8.5% · 30yr
- Down + closing
- —
- Monthly P&I
- —
- Monthly cashflow
- —
- DSCR
- —
- Eligible?
- —
No personal income docs; deal must DSCR.
Hard money
10% down · 12.0% · 12mo
- Down + closing
- —
- Monthly P&I
- —
- Monthly cashflow
- —
- DSCR
- —
- Eligible?
- —
Short-term bridge; refi at stabilization.
Rent comps 40 comps
| Address | Beds | Baths | Sqft | Rent | $/sqft | DOM | Units | Dist |
|---|---|---|---|---|---|---|---|---|
| 306 Atlantic St SE Unit 7 Washington, DC | 2.0 | 1.0 | 989 | $1,699 | $1.72 | 18d | 1 | 0.24mi |
| 147 Mississippi Ave SE Washington, DC | 4.0 | 2.0 | 1459 | $2,795 | $1.92 | 22d | 1 | 0.27mi |
| 4030 Livingston Rd SE Washington, DC | 2.0 | 1.0 | 1000 | $1,648 | $1.65 | 24d | 1 | 0.37mi |
| 101 Wayne Pl SE Washington, DC | 2.0 | 1.0 | 919 | $1,695 | $1.84 | 22d | 1 | 0.37mi |
| 150 Upsal St SE Washington, DC | 2.0 | 3.0 | 1695 | $3,200 | $1.89 | 24d | 1 | 0.38mi |
| 4040 Livingston Rd SE Washington, DC | 2.0 | 1.0 | 1000 | $1,256 | $1.26 | 24d | 1 | 0.38mi |
| 3930 1st St SE Unit 301 Washington, DC | 3.0 | 1.0 | 900 | $2,200 | $2.44 | 24d | 1 | 0.40mi |
| 10 Halley Pl SE Washington, DC | 2.0–3.0 | 1.0 | 906 | $2,400 | $2.65 | 24d | 3 | 0.42mi |
| 3320 6th St SE Washington, DC | 2.0 | 1.0 | 690 | $1,398 | $2.03 | 3d | 25 | 0.44mi |
| 864 Bellevue St SE Unit 1 Washington, DC | 2.0 | 1.0 | 1628 | $1,700 | $1.04 | 24d | 1 | 0.47mi |
| 742 Congress St SE Washington, DC | 3.0 | 2.5 | 1744 | $3,000 | $1.72 | 17d | 1 | 0.48mi |
| 820 Southern Ave SE Washington, DC | 2.0–3.0 | 1.0–1.5 | 840 | $1,600 | $1.90 | 3d | 65 | 0.51mi |
| 4001 S Capitol St SW Washington, DC | 3.0 | 1.0–2.0 | 782 | $2,557 | $3.27 | 14d | 1 | 0.53mi |
| 911 Bellevue St SE Washington, DC | 4.0 | 2.0 | 1820 | $3,400 | $1.87 | 24d | 1 | 0.56mi |
| 3517 Brothers Pl SE Washington, DC | 2.0 | 1.0 | 900 | $1,595 | $1.77 | 24d | 1 | 0.58mi |
| 4805 Springmaid Ln Oxon Hill, MD | 3.0 | 2.5 | 1296 | $2,600 | $2.01 | 19d | 1 | 0.59mi |
| 1121 Varney St SE Washington, DC | 3.0 | 3.5 | 1400 | $3,000 | $2.14 | 24d | 1 | 0.60mi |
| 4306 Halley Ter SE Unit 1 Washington, DC | 4.0 | 2.0 | 1270 | $3,000 | $2.36 | 11d | 1 | 0.61mi |
| 4281 S Capitol St SW Washington, DC | 3.0 | 3.5 | 1412 | $2,900 | $2.05 | 24d | 1 | 0.63mi |
| 4285 S Capitol St SW Washington, DC | 3.0 | 3.5 | 1152 | $3,500 | $3.04 | 15d | 1 | 0.64mi |
| 4287 S Capitol St SW Washington, DC | 2.0 | 3.5 | 1412 | $2,575 | $1.82 | 24d | 1 | 0.64mi |
| 3210 8th St SE #1 Washington, DC | 2.0 | 2.0 | 1106 | $2,395 | $2.17 | 24d | 1 | 0.66mi |
| 607 Southern Ave SE Oxon Hill, MD | 2.0 | 1.0 | 900 | $1,199 | $1.33 | 20d | 1 | 0.70mi |
| 349 Parkland Pl SE Unit B Washington, DC | 4.0 | 2.0 | 1400 | $2,500 | $1.79 | 20d | 1 | 0.73mi |
| 349 Parkland Pl SE Unit A Washington, DC | 4.0 | 2.0 | 1400 | $2,500 | $1.79 | 24d | 1 | 0.73mi |
| 615 Malcolm X Ave SE Unit F Washington, DC | 3.0 | 1.0 | 1100 | $2,508 | $2.28 | 3d | 1 | 0.76mi |
| 44 Forrester St SW Unit 3 Washington, DC | 3.0 | 2.0 | 1200 | $2,450 | $2.04 | 24d | 1 | 0.79mi |
| 3325 13th St SE Apt 12 Washington, DC | 3.0 | 1.0 | 901 | $2,500 | $2.77 | 24d | 1 | 0.79mi |
| 3325 13th St SE Apt 1 Washington, DC | 3.0 | 1.0 | 902 | $2,500 | $2.77 | 2d | 1 | 0.79mi |
| 802 Malcolm X Ave SE Washington, DC | 4.0 | 1.0 | 1140 | $3,150 | $2.76 | 24d | 1 | 0.82mi |
| 2913 8th St SE #3101 Washington, DC | 2.0 | 2.0 | 1100 | $2,400 | $2.18 | 14d | 1 | 0.83mi |
| 716 Audrey Ln Oxon Hill, MD | 3.0 | 2.0 | 1344 | $2,500 | $1.86 | 19d | 1 | 0.88mi |
| 4334 Martin Luther King Jr Ave SW Washington, DC | 3.0 | 2.0 | 1323 | $3,200 | $2.42 | 24d | 1 | 0.88mi |
| 425 Oakwood St SE Unit 425 Washington, DC | 3.0 | 2.5 | 1008 | $3,500 | $3.47 | 24d | 1 | 0.90mi |
| 1306 Sutler Ter Oxon Hill, MD | 4.0 | 2.5 | 1320 | $3,079 | $2.33 | 3d | 1 | 0.92mi |
| 118 Galveston St SW Washington, DC | 1.0–3.0 | 1.0–2.0 | 951 | $2,130 | $2.24 | 2d | 10 | 0.93mi |
| 2942 2nd St SE Washington, DC | 1.0–2.0 | 1.0–2.0 | 762 | $1,539 | $2.02 | 3d | 9 | 0.94mi |
| 1439 Southern Ave SE Oxon Hill, MD | 2.0–3.0 | 1.0–2.0 | 1080 | $2,342 | $2.17 | 44d | 1 | 0.94mi |
| 1201 Oak Dr SE Washington, DC | 3.0 | 1.0–2.0 | 853 | $2,220 | $2.60 | 2d | 19 | 0.94mi |
| 446 Mellon St SE #2 Washington, DC | 2.0 | 1.0 | 928 | $2,400 | $2.59 | 15d | 1 | 0.95mi |
Listing history 15 events
-
2026-06-18days on market $194,000 Active 31 DOM
-
2026-06-17days on market $194,000 Active 30 DOM
-
2026-06-16days on market $194,000 Active 29 DOM
-
2026-06-15days on market $194,000 Active 28 DOM
-
2026-06-13days on market $194,000 Active 26 DOM
-
2026-06-09days on market $194,000 Active 22 DOM
-
2026-06-08days on market $194,000 Active 21 DOM
-
2026-06-07days on market $194,000 Active 20 DOM
-
2026-06-04days on market $194,000 Active 17 DOM
-
2026-06-03days on market $194,000 Active 16 DOM
-
2026-06-02days on market $194,000 Active 15 DOM
-
2026-06-01days on market $194,000 Active 14 DOM
-
2026-05-31days on market $194,000 Active 13 DOM
-
2026-05-18$194,000 Active
-
1978-10-13soldstatus $20,500
ⓘ Source: listings_history table (triggers on properties + properties_extension) + one-shot
backfill from property_details.listing_events for pre-trigger history.
Climate risk First Street
- Flood 1/10 Low FEMA zone X (unshaded) · 0% chance over 30 yrs
- Wildfire 3/10 Moderate
- Heat 7/10 Severe 7 d/yr ≥104°F today · 16 d/yr by 30 yrs out
- Wind 4/10 Moderate 21% chance of damaging wind over 30 yrs
- Air quality 3/10 Moderate 2 unhealthy d/yr today · 3 by 30 yrs out
Nearby sold comps map
Loading sold comps map…
Walkable amenities ~0.75 mi
Loading nearby amenities…
Taxation est. · year 1
- Rental income
- $27,895
- − Mortgage interest
- −$10,867
- − Property taxes
- −$2,910
- − Insurance
- −$970
- − Repairs & maintenance
- −$2,232
- − Management
- −$2,232
- − Depreciation
- −$5,644
- Taxable income
- $3,041
- Est. tax owed @ 24.0%
- −$730
- After-tax cash flow
- $5,219/yr
For passive investors: Depreciation is non-cash, so a rental often shows a tax loss while cash-flowing — sheltering income. Rental losses are passive: they offset passive income freely, and up to $25,000/yr can offset ordinary (W-2) income if you actively participate and your MAGI is under $100k (phasing out to $0 by $150k); unused losses carry forward. On sale, claimed depreciation is recaptured at up to 25%, and gains may owe capital-gains tax (a 1031 exchange can defer both). Figures are a year-1 estimate at your 24.0% rate — not tax advice; consult a CPA.
Schools (NCES district)
- District
- District Of Columbia Public Schools
- NCES district ID
- 1100030
- Math proficiency
- 33% ▲ 3.00%
- Reading proficiency
- 40% ▲ 5.00%
- Median HH income
- $67,671
- Composite
- 35.84/100
- National rank
- #9606
- State rank
- #8 of 32 in DC
Livability — Washington
- Score
- 73/100
- State rank
- #1
- US rank
- #5327
Category grades
Schools grade is shown separately in the Schools card above.
Census & demographics
- Census place
- Washington, DC
- County
- District of Columbia · 671,873 people
- City population
- 671,873
- Metro
- Washington-Arlington-Alexandria, DC-VA-MD-WV
- Population (ZIP)
- 40,920
- Household income
- $49,139
- Rent vs Own
- Severe rent burden
- 4530.0
Population outlook (District of Columbia County) Hauer SSP2
- Today (2025)
- 821,926 people
- By 2030
- 899,517 · +9.4%
- By 2040
- 1,061,162 · +29.1%
- By 2050
- 1,231,493 · +49.8%
- By 2075
- 1,603,312 · +95.1%
- By 2100
- 1,847,141 · +124.7%
Race, ethnicity, and origin ACS 2023
- Neighborhood character
- Predominantly Black (80%)
- Race & ethnicity
- Black 80% White 8% Two or more races 7% Hispanic / Latino 5%
- Foreign-born
- 4% · Canada
- Languages at home
- 95% English-only · Spanish 3%
Political lean MEDSL · District of Columbia
- 2024 margin
- Solid D (+86.1) · D 91.2% · R 5.1% · Other 3.8%
- 2008→2024 swing
- +0.1pp no change · 2008: 85.9pp · 2024: 86.1pp
- All cycles
- 2024: D+86.1 2020: D+86.8 2016: D+88.7 2012: D+84.2 2008: D+85.9
Not yet ingested
- Civics
- —
Market trends
- HPI YoY
- ▼ -60.34%
- Current HPI
- 326.4077
- Rent YoY
- ▲ 3.96%
- Metro
- Washington-Arlington-Alexandria, DC-VA-MD-WV
- State GDP YoY
- ▲ 1.33%
- F500 in state
- 6
Industry mix (Fortune 500 HQ in DC)
| Industry | F500 HQs | Revenue |
|---|---|---|
| Financial Services | 1 | $153B |
|
||
| Life Sciences / Industrials | 1 | $25B |
|
||
| Industrial Machinery | 1 | $8B |
|
||
Price history
+846.3% since first listed2 events — show timeline
- 2026-05-18 Listed $194,000 BRIGHT MLS
- 1978-10-13 Sold (Public Records) $20,500 Public Records
Property tax history
+27.0%/yrLatest (2025): $13,125 · +3.2% YoY. Source: county tax records.
Cash-flow waterfall
monthlySold comps — $/sqft
last 12 mo · ≤1 miLoading sold comps…