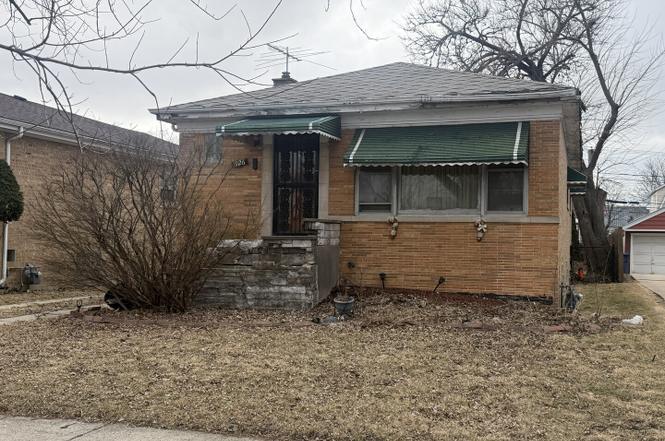
1926 S 24th Ave · Maywood, IL
Flood risk 1/10 · Minimal
- FEMA flood zone
- X (unshaded)
- Chance of flooding over 30 yrs
- 0.0%
- Est. flood insurance / yr
- $473 – $860
Fire risk 1/10 · Minimal
- Est. fire insurance / yr
- $804 – $1,492
Heat risk 3/10 · Minor
- Hot days now (above 101°F)
- 7 days/yr
- Hot days in 30 yrs
- 14 days/yr
Wind risk 2/10 · Minimal
- Chance of severe wind over 30 yrs
- 0.0%
Air-quality risk 4/10 · Minor
- Unhealthy air days now
- 6 days/yr
- Unhealthy air days in 30 yrs
- 7 days/yr
Risk factors via First Street. Map © Google.
Why this score? — see what drove the B grade
The composite is a weighted blend of 9 inputs, each scored 0–100. Each bar is that input's sub-score; the figure is the points it added to the 100-point composite (weight × sub-score).
- Cash flow +27.6/30.0
- ARV discount +15.0/15.0
- DSCR +9.7/10.0
- 1% rule +7.5/10.0
- Livability +3.9/5.0
- Rent growth +2.5/5.0
- Condition / age +2.5/5.0
- Schools +1.4/10.0
- Appreciation +0.0/10.0
$160,000
🖨 Deal sheet 📄 Offer letter ✓ Due diligence
Listing remarks
Multiple offers received. Highest and Best Offers Due by Tuesday March 10th by 5PM. Attention experienced rehabbers and investors! This property presents an exceptional opportunity, though require some work. Buyers will be responsible for full property clean-out and any necessary repairs. The property is being sold strictly "as is, " with no survey provided. All offers must include proof of funding and a pre-approval letter. All earnest money must be submitted in certified funds. Please note that the property details, including room count and lot size, are not guaranteed. The purchase options for this remarkable property are CASH, CONVENTIONAL, OR REHAB FINANCING ONLY. SCHEDULE YO
Key facts
- 5,374 sq ft lot
- 2 garage spots
- Built 1952
Neighborhood map
What this means for you Summary
Snapshot
- This is a 3-bed/1.0-bath single-family listed at $160k.
Deal economics
- At list price, monthly cash flow is $477 ($6k/yr) — positive.
- The deal already cash-flows at list — no discount required.
- Meets the 1% rule at list price ($2k rent vs $160k).
- Recommended offer: $158k (1.5% below list) — sets the bar for market timing.
- Cap rate 9.9% vs local median 4.5% in Maywood — top-decile yield for the area; either an underpriced asset or a hidden risk that comps aren't pricing in. Stress-test before assuming the spread holds.
Location & tenants
- Location reads 78/100 on livability (#146 in IL, #2,694 nationally) — a middle-class / working-renter tenant base. Strengths: commute A+, cost of living A+, housing A+; Watch: health & safety C-, crime D+, schools F.
- Proviso Twp Hsd 209 (suburban): math 12% / reading 17% proficiency, ranked #507 of 620 in IL (top 82%) — low school quality limits family demand, transient renter base, plan for 1-2y turnover.
- Market conditions: 72 active listings in the ZIP; 20 comparable units currently listed for rent nearby; rentals at typical pace (median 20d on market — plan ~3-4 weeks tenant-placement turnaround); 6,272 units permitted in Cook County in 2024 (4,658 in 5+ unit buildings).
- This rent runs 35% of the median local income ($69k/yr) — at the standard rent-burdened threshold; future hikes will face affordability resistance.
Forward outlook
- Local home prices are declining (-3.0%/yr); year-one equity from $1k of loan paydown is wiped out by about $5k of value loss. Plan a longer hold.
- At projected returns (-3.0% appreciation + 3.0% rent growth), your $45k cash investment doubles in ~9 years — after that, you're playing with house money.
Negotiation context
- It's been on market 17 days — a 2% lower offer ($158k) is reasonable based on typical stale-listing flexibility.
Risks & watch-outs
- Watch-outs: built in 1952 — expect roof / HVAC / electrical / plumbing capex.
Questions for the listing agent
- Built in 1952 — when were the roof, HVAC, electrical panel, plumbing, and water heater last replaced?
- Is there a deadline driving the sale (1031 exchange, divorce, estate, relocation)? That informs how much negotiation room exists.
- Schools are F-rated, which usually means shorter tenancies and higher turnover. Who's the typical renter profile here, and what's been the actual vacancy rate?
- Crime grade is D in this area — have there been break-ins, vandalism, or insurance claims at this property in the last 3 years? What carrier currently insures it and at what premium?
- What's the average days-on-market for RENTAL listings here right now (not sales)? A rising rental-DOM trend means longer vacancies and softer asking-rent achievability than the comps imply.
- What's the recent tenant-quality profile in this submarket — average credit score on applications, eviction rate, late-payment / NSF rate, and stable-employment percentage? A property-management company in the area should have these aggregated.
- How much new for-sale + rental construction is in the pipeline within 1–3 miles? Heavy new supply typically softens prices + rents 12–24 months out; constrained supply supports both.
Investment metrics
- 1% rule
- 1.25% ✓
- Cap rate
- 9.87%
- Cash-on-cash
- 12.77%
- DSCR
- 1.57
- GRM
- 6.7
CMA / ARV
- ARV (on-the-fly)
- $288,920
- Comps found
- 12
Show comp detail 12 sales within ~0.75 mi
| Address | Dist | Beds/Ba | Sqft | Sold | Price | $/sf | Match |
|---|---|---|---|---|---|---|---|
| 1925 S 22nd Ave | 0.16mi | 3/2.0 | 1,260 (+2%) | 2mo | $345,000 | $274 | 84 |
| 2111 S 24th Ave | 0.22mi | 3/2.0 | 1,286 (+4%) | 2mo | $300,000 | $233 | 78 |
| 1433 S 21st Ave | 0.42mi | 3/2.0 | 1,226 (-1%) | 1mo | $290,000 | $237 | 74 |
| 2247 S 21st Ave | 0.46mi | 3/1.5 | 1,176 (-5%) | 1mo | $295,000 | $251 | 67 |
| 1615 S 20th Ave | 0.41mi | 2/2.0 (-1) | 1,260 (+2%) | 3mo | $263,000 | $209 | 67 |
| 1124 31st Ave | 0.51mi | 4/1.0 (+1) | 1,224 (-1%) | 2mo | $255,000 | $208 | 67 |
| 1433 Bristol Ave | 0.71mi | 3/1.5 | 1,225 (-1%) | 1mo | $353,500 | $289 | 62 |
| 1911 S 18th Ave | 0.41mi | 4/1.0 (+1) | 1,340 (+8%) | 1mo | $130,000 | $97 | 61 |
| 2036 S 15th Ave | 0.59mi | 3/1.0 | 1,153 (-7%) | 1mo | $257,500 | $223 | 60 |
| 1037 24th Ave | 0.36mi | 2/1.0 (-1) | 1,106 (-11%) | 2mo | $215,000 | $194 | 58 |
| 2341 S 24th Ave | 0.53mi | 3/1.0 | 1,112 (-10%) | 2mo | $279,500 | $251 | 57 |
| 1844 S 13th Ave | 0.70mi | 3/1.5 | 1,404 (+13%) | 1mo | $177,000 | $126 | 42 |
Match score weights: distance 35% · size 25% · config 20% · recency 20%. Top-matched comps best support the ARV.
Projected returns pro-forma
-3.0% appreciation · 3.0% rent growth · sell at horizon
- IRR
- 2.6%
- Equity multiple
- 1.10×
- Total profit
- $4,478
- Equity at exit
- $23,857
- IRR
- 12.2%
- Equity multiple
- 1.96×
- Total profit
- $43,135
- Equity at exit
- $13,834
Cash invested: $44,800 (down + closing). Projections, not guarantees.
Landlord ↔ Tenant lean methodology
- Overall (STATE)
- 43 Moderately Tenant-Leaning
- State Illinois
- 43 Moderately Tenant-Leaning · D+7
- County
- — inherits STATE
- City
- — inherits STATE
ZIP-level market 60153
- Home prices YoY
- -20.5%
- Active inventory
- 72
- Price-to-rent
- 6.7×
Monthly cashflow live
- Estimated rent
- $2,003 high interval (Pro) →
- Mortgage (P&I)
- −$839
- Tax est. 1.5%
- −$200 /mo · $2,400/yr
- Insurance
- −$67
- HOA
- −$0
- Vacancy / Maint / Mgmt
- −$421
- Net cashflow
- $477
Break-even live
UW: 25.0% down · 7.5% · 30yr · 1.5% tax · 5.0% vac · 8.0% maint · 8.0% mgmt
Financing live
Cash to close
- Down payment
- $40,000
- Closing costs
- $4,800
- Reserves months
- —
- Total cash needed
- —
Loan-product check · same deal, 3 products live
Conventional
25% down · 7.5% · 30yr
- Down + closing
- —
- Monthly P&I
- —
- Monthly cashflow
- —
- DSCR
- —
- Eligible?
- —
Personal DTI + credit; lowest rate.
DSCR
20% down · 8.5% · 30yr
- Down + closing
- —
- Monthly P&I
- —
- Monthly cashflow
- —
- DSCR
- —
- Eligible?
- —
No personal income docs; deal must DSCR.
Hard money
10% down · 12.0% · 12mo
- Down + closing
- —
- Monthly P&I
- —
- Monthly cashflow
- —
- DSCR
- —
- Eligible?
- —
Short-term bridge; refi at stabilization.
Rent comps 20 comps
| Address | Beds | Baths | Sqft | Rent | $/sqft | DOM | Units | Dist |
|---|---|---|---|---|---|---|---|---|
| 2416 W Roosevelt Rd Apt 1S Broadview, IL | 2.0 | 1.0 | 884 | $1,475 | $1.67 | 24d | 1 | 0.31mi |
| 723 Manchester Ave Westchester, IL | 3.0 | 2.0 | 1151 | $2,721 | $2.36 | 24d | 1 | 0.43mi |
| 2040 16th Ave Unit 2C Broadview, IL | 2.0 | 1.0 | 900 | $1,595 | $1.77 | 13d | 1 | 0.55mi |
| 1104 Rice Ave Bellwood, IL | 2.0 | 1.0 | 995 | $1,725 | $1.73 | 22d | 1 | 0.72mi |
| 631 Balmoral Ave Westchester, IL | 2.0 | 1.0 | 903 | $2,100 | $2.33 | 24d | 1 | 0.89mi |
| 1814 Warren St Maywood, IL | 3.0 | 1.0 | 1200 | $2,500 | $2.08 | 10d | 1 | 0.90mi |
| 1814 Warren St Unit 2W Maywood, IL | 3.0 | 1.0 | 1200 | $2,500 | $2.08 | 1d | 1 | 0.90mi |
| 1013 Bellwood Ave Unit 2W Bellwood, IL | 2.0 | 1.0 | 925 | $1,850 | $2.00 | 20d | 1 | 0.91mi |
| 1215 Balmoral Ave Unit 1 Westchester, IL | 3.0 | 1.5 | 1500 | $2,750 | $1.83 | 24d | 1 | 0.94mi |
| 1215 Balmoral Ave Unit 2 Westchester, IL | 3.0 | 1.5 | 1500 | $2,950 | $1.97 | 15d | 1 | 0.94mi |
| 323 22nd Ave Unit G Bellwood, IL | 2.0 | 1.0 | 750 | $1,750 | $2.33 | 24d | 1 | 1.30mi |
| 312 23rd Ave Unit 2 Bellwood, IL | 2.0 | 1.0 | 850 | $1,775 | $2.09 | 21d | 1 | 1.32mi |
| 10351 Canterbury St Unit 2E Westchester, IL | 2.0 | 1.0 | 850 | $1,650 | $1.94 | 24d | 1 | 1.32mi |
| 218 S 13th Ave Unit 2 Maywood, IL | 2.0 | 1.0 | 1050 | $1,650 | $1.57 | 5d | 1 | 1.36mi |
| 3108 Saint Charles Rd Unit 2B Bellwood, IL | 2.0 | 1.0 | 750 | $1,550 | $2.07 | 24d | 1 | 1.39mi |
| 903 S 5th Ave Unit 2D Maywood, IL | 3.0 | 2.0 | 1008 | $2,100 | $2.08 | 1d | 1 | 1.45mi |
| 2036 S 1st Ave Maywood, IL | 4.0 | 2.0 | 1363 | $2,750 | $2.02 | 1d | 1 | 1.46mi |
| 410 School St Unit 1B Maywood, IL | 3.0 | 2.0 | 1218 | $2,200 | $1.81 | 1d | 1 | 1.46mi |
| 404 School St Maywood, IL | 2.0 | 1.0 | 737 | $1,565 | $2.12 | 1d | 1 | 1.48mi |
| 422 Granville Ave Hillside, IL | 3.0 | 1.0 | 1194 | $2,571 | $2.15 | 7d | 1 | 1.49mi |
Listing history 2 events
-
2026-03-18status Pending
-
2026-03-01$160,000 Active
ⓘ Source: listings_history table (triggers on properties + properties_extension) + one-shot
backfill from property_details.listing_events for pre-trigger history.
Climate risk First Street
- Flood 1/10 Low FEMA zone X (unshaded) · 0% chance over 30 yrs
- Wildfire 1/10 Low
- Heat 3/10 Moderate 7 d/yr ≥101°F today · 14 d/yr by 30 yrs out
- Wind 2/10 Low 0% chance of damaging wind over 30 yrs
- Air quality 4/10 Moderate 6 unhealthy d/yr today · 7 by 30 yrs out
Nearby sold comps map
Loading sold comps map…
Walkable amenities ~0.75 mi
Loading nearby amenities…
Taxation est. · year 1
- Rental income
- $24,040
- − Mortgage interest
- −$8,962
- − Property taxes
- −$2,400
- − Insurance
- −$800
- − Repairs & maintenance
- −$1,923
- − Management
- −$1,923
- − Depreciation
- −$4,655
- Taxable income
- $3,377
- Est. tax owed @ 24.0%
- −$810
- After-tax cash flow
- $4,913/yr
For passive investors: Depreciation is non-cash, so a rental often shows a tax loss while cash-flowing — sheltering income. Rental losses are passive: they offset passive income freely, and up to $25,000/yr can offset ordinary (W-2) income if you actively participate and your MAGI is under $100k (phasing out to $0 by $150k); unused losses carry forward. On sale, claimed depreciation is recaptured at up to 25%, and gains may owe capital-gains tax (a 1031 exchange can defer both). Figures are a year-1 estimate at your 24.0% rate — not tax advice; consult a CPA.
Schools (NCES district)
- District
- Proviso Twp Hsd 209
- NCES district ID
- 1732910
- Math proficiency
- 12% ▼ -4.00%
- Reading proficiency
- 17% ▼ -3.00%
- Median HH income
- $51,744
- Composite
- 13.5/100
- National rank
- #9518
- State rank
- #507 of 620 in IL
Livability — Maywood
- Score
- 78/100
- State rank
- #146
- US rank
- #2694
Category grades
Schools grade is shown separately in the Schools card above.
Census & demographics
- Census place
- Maywood, IL
- County
- Cook County · 4,486,803 people
- City population
- 23,201
- Metro
- Chicago-Naperville-Elgin, IL-IN-WI
- Population (ZIP)
- 23,201
- Household income
- $68,815
- Rent vs Own
- Severe rent burden
- 869.0
Population outlook (Cook County) Hauer SSP2
- Today (2025)
- 5,347,519 people
- By 2030
- 5,357,703 · +0.2%
- By 2040
- 5,324,924 · -0.4%
- By 2050
- 5,230,762 · -2.2%
- By 2075
- 4,785,735 · -10.5%
- By 2100
- 4,188,836 · -21.7%
Race, ethnicity, and origin ACS 2023
- Neighborhood character
- Diverse neighborhood (Simpson 0.56)
- Race & ethnicity
- Black 57% Hispanic / Latino 33% Two or more races 11% White 6%
- Hispanic origin (detail)
- Mexican 28% Puerto Rican 3%
- Common ancestry
- Romanian 1% British 1%
- Foreign-born
- 14% · Canada, Jamaica
- Languages at home
- 68% English-only · Spanish 30% French/Haitian/Cajun 2%
Political lean MEDSL · Cook
- 2024 margin
- Solid D (+42.0) · D 70.4% · R 28.4% · Other 1.2%
- 2008→2024 swing
- -11.4pp toward R · 2008: 53.4pp · 2024: 42.0pp
- All cycles
- 2024: D+42.0 2020: D+50.3 2016: D+53.0 2012: D+49.4 2008: D+53.4
Not yet ingested
- Civics
- —
Market trends
- HPI YoY
- ▼ -86.90%
- Current HPI
- 336.2159
- Rent YoY
- —
- Metro
- Chicago-Naperville-Elgin, IL-IN-WI
- State GDP YoY
- ▲ 1.59%
- F500 in state
- 60
Industry mix (Fortune 500 HQ in IL)
| Industry | F500 HQs | Revenue |
|---|---|---|
| Insurance | 4 | $201B |
|
||
| Consumer Goods | 4 | $87B |
|
||
| Industrial Machinery | 3 | $64B |
|
||
| Healthcare | 2 | $55B |
|
||
| Retail / Pharmacy | 1 | $148B |
|
||
| Agriculture / Food | 1 | $86B |
|
||
Price history
2 events — show timeline
- 2026-03-18 Pending — MRED as Distributed by MLS Grid
- 2026-03-01 Listed $160,000 MRED as Distributed by MLS Grid
Property tax history
+4.7%/yrLatest (2023): $8,279 · -0.4% YoY. Source: county tax records.
Cash-flow waterfall
monthlySold comps — $/sqft
last 12 mo · ≤1 miLoading sold comps…