 🌊 Lakefront
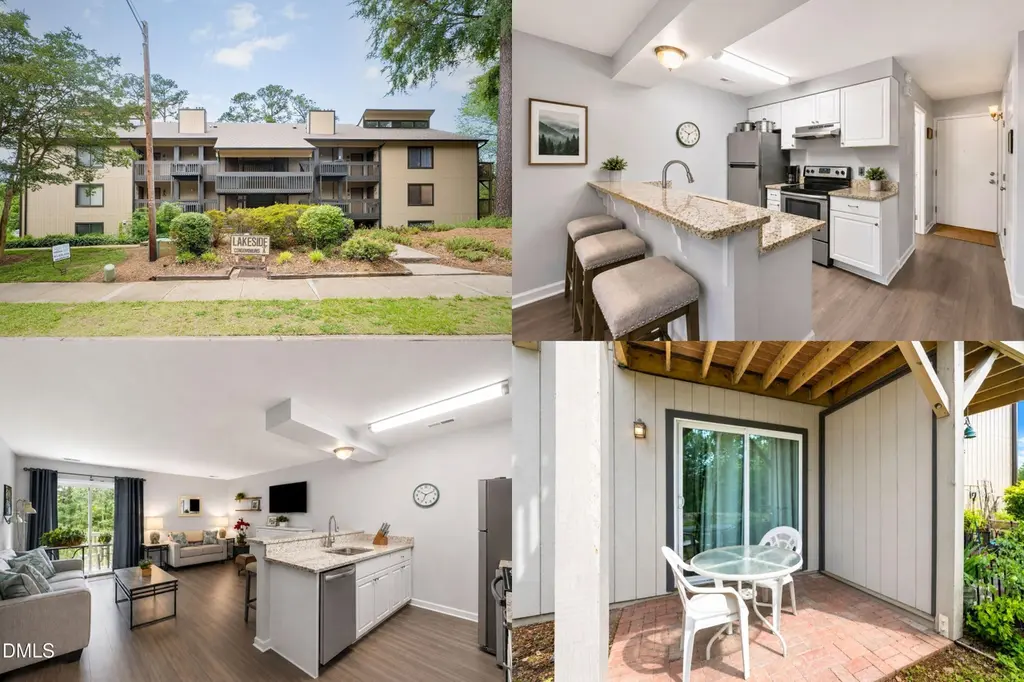
3003 Huntleigh Dr · Raleigh, NC
Flood risk 3/10 · Minor
- FEMA flood zone
- X (unshaded)
- Chance of flooding over 30 yrs
- 0.1%
- Est. flood insurance / yr
- $507 – $1,088
Fire risk 1/10 · Minimal
- Est. fire insurance / yr
- $906 – $1,684
Heat risk 7/10 · Major
- Hot days now (above 105°F)
- 7 days/yr
- Hot days in 30 yrs
- 17 days/yr
Wind risk 6/10 · Moderate
- Chance of severe wind over 30 yrs
- 55.0%
Air-quality risk 3/10 · Minor
- Unhealthy air days now
- 2 days/yr
- Unhealthy air days in 30 yrs
- 2 days/yr
Risk factors via First Street. Map © Google.
Why this score? — see what drove the D grade
The composite is a weighted blend of 9 inputs, each scored 0–100. Each bar is that input's sub-score; the figure is the points it added to the 100-point composite (weight × sub-score).
- Cash flow +12.7/30.0
- ARV discount +7.5/15.0
- Schools +4.9/10.0
- 1% rule +4.6/10.0
- Livability +4.2/5.0
- DSCR +3.8/10.0
- Condition / age +2.5/5.0
- Rent growth +2.4/5.0
- Appreciation +0.0/10.0
$125,000
🖨 Deal sheet (PDF) 📄 Offer letter ✓ Due diligence
Listing remarks
Enjoy a connected Raleigh lifestyle in this beautiful STUDIO CONDO at a location that brings together everyday convenience and a comfortable neighborhood setting. Positioned just minutes from Downtown Raleigh, this home offers easy access to dining, shopping, major commuter routes, and key destinations throughout the Triangle. The surrounding neighborhood features established homes and mature trees, creating a welcoming environment with a true sense of community. Nearby parks and greenways provide opportunities to enjoy the outdoors, whether for a morning walk, afternoon bike ride, or relaxing evening close to home. Conveniently located near NC State, and other universities, this property a
Key facts
- $159 HOA
- 2 parking spots
- Built 1983
Tags
Property features AI
Finance
- Other: Zoning: OX-4; Not a senior community
- HOA & community: Community Association (CAMS) with monthly fee; Association fee includes maintenance of structure
Exterior
- Parking: Open parking (2 spaces); Parking lot
- Utilities: Public water; Public sewer
- Home design: Site-built property; One level; 2+ common walls
- Construction: Wood siding; Shingle roof; Slab foundation; Built as site-built structure
- Exterior features: Covered patio; Patio
Interior
- Kitchen: Dishwasher; Electric oven; Electric range
- Bedrooms: 1 bedroom (main level)
- Flooring: Laminate
- Bathrooms: 1 full bathroom
- Heating & cooling: Electric heating; Central air conditioning
- Interior features: Dishwasher; Electric oven; Electric range
- Laundry & utility: Laundry in hall
Neighborhood map
What this means for you Summary
Snapshot
- This is a 1-bed/1.0-bath condo listed at $125k.
Deal economics
- At list price, monthly cash flow is $-15 ($-175/yr) — negative.
- To cash-flow at today's rent, offer at most $122k (2.1% below list).
- To meet the 1% rule (rent ≥ 1% of price), the offer needs to be $120k (3.6% below list).
- Recommended offer: $120k (3.6% below list) — sets the bar for 1% rule.
- Cap rate 6.2% vs local median 2.7% in Raleigh — top-decile yield for the area; either an underpriced asset or a hidden risk that comps aren't pricing in. Stress-test before assuming the spread holds.
Location & tenants
- Location reads 83/100 on livability (#10 in NC, #1,028 nationally) — a professional / high-income tenant draw. Strengths: amenities A+, commute A+, housing A+; Watch: crime F.
- Wake County Schools (suburban): math 52% / reading 60% proficiency, ranked #35 of 178 in NC (top 20%) — acceptable for families but not a draw, mixed tenant base, ~2y average lease.
- Zoned schools: Brentwood Elementary (math 32% / reading 37%, grade F, #835 of 1,410 statewide, top 62%, 389 students, 72% FRL); East Millbrook Middle (math 17% / reading 27%, grade F, #416 of 475 statewide, top 89%, 769 students, 73% FRL); Heritage High (math 72% / reading 70%, grade B+, #116 of 535 statewide, top 22%, 1,811 students, 25% FRL) — zoned schools average 57% FRL vs 30% district-wide (26 pts higher); higher-poverty schools than district average — tighter screening recommended.
- Zoned-school proficiency averages 42% at this address vs 56% district-wide (-14 pts) — the specific schools serving this property underperform the Wake County Schools average; the district grade overstates school quality for this exact location.
- Market conditions: Rents soft (-0.3%/yr); 403 active listings in the ZIP; 10 comparable units currently listed for rent nearby; rentals at typical pace (median 15d on market — plan ~3-4 weeks tenant-placement turnaround); 15,249 units permitted in Wake County in 2024 (5,568 in 5+ unit buildings).
Forward outlook
- Local home prices are declining (-3.0%/yr); year-one equity from $864 of loan paydown is wiped out by about $4k of value loss. Plan a longer hold.
- Wake County population projected at +51% by 2050 — long-run rental-demand tailwind backs the buy-and-hold thesis.
Negotiation context
- It's been on market 16 days — a 2% lower offer ($123k) is reasonable based on typical stale-listing flexibility.
Risks & watch-outs
- Climate carrying-cost: major wind risk, 55% chance of damaging wind over 30y; extreme-heat days projected 7→17/yr by 2055 (HVAC capex compounding) — expect insurance premiums to compound above CPI over the hold.
Questions for the listing agent
- What do current leases actually rent for vs. the listed asking? Can we see a recent rent roll and the last 12 months of T-12 income?
- What does the HOA fee cover, when was the last increase, and are there any pending special assessments or reserve-fund shortfalls?
- Any open or pending special assessments — roof, HVAC, plumbing, elevator, façade? What's the per-unit balance and payoff schedule, and is the seller paying it off at close or rolling it to the buyer?
- Is there a deadline driving the sale (1031 exchange, divorce, estate, relocation)? That informs how much negotiation room exists.
- Schools are B-rated — typically a magnet for longer-tenancy family renters. What's the average tenant stay here, and is there a school-zone premium baked into asking?
- Crime grade is F in this area — have there been break-ins, vandalism, or insurance claims at this property in the last 3 years? What carrier currently insures it and at what premium?
- The area grade is low — what's the realistic commute time and amenity access for the typical tenant pool here? Any planned neighborhood developments (good or bad) we should know about?
- This sits on a lake — are riparian / water-frontage rights deeded with the parcel? Any dock permits, shoreline easements, or HOA water-use restrictions?
- What's the documented flood / surge / shoreline-erosion history here (FEMA AND non-FEMA — e.g., storm surge, creek backup, septic-field saturation)?
- Any water-quality or seasonal algae-bloom issues that affect tenant satisfaction or short-term-rental demand?
- What's the average days-on-market for RENTAL listings here right now (not sales)? A rising rental-DOM trend means longer vacancies and softer asking-rent achievability than the comps imply.
- What's the recent tenant-quality profile in this submarket — average credit score on applications, eviction rate, late-payment / NSF rate, and stable-employment percentage? A property-management company in the area should have these aggregated.
- How much new apartment / multifamily construction is in the pipeline within 1–3 miles? Heavy new supply (>2% of stock underway) typically softens rents 12–24 months out; light construction supports rent growth.
Investment metrics
- 1% rule
- 0.96% ✗
- Cap rate
- 6.15%
- Cash-on-cash
- -0.50%
- DSCR
- 0.98
- GRM
- 8.6
CMA / ARV
No comps found within radius.
Projected returns pro-forma
-3.0% appreciation · 0.0% rent growth · sell at horizon
- IRR
- -20.9%
- Equity multiple
- 0.30×
- Total profit
- $-24,632
- Equity at exit
- $18,638
- IRR
- -24.6%
- Equity multiple
- -0.03×
- Total profit
- $-35,960
- Equity at exit
- $10,808
Cash invested: $35,000 (down + closing). Projections, not guarantees.
Landlord ↔ Tenant lean methodology
- Overall (STATE)
- 85 Strongly Landlord-Friendly
- State North Carolina
- 85 Strongly Landlord-Friendly · R+3
- County
- — inherits STATE
- City
- — inherits STATE
ZIP-level market 27604
- Rents YoY
- -0.3%
- Active inventory
- 403
- Price-to-rent
- 8.6×
Monthly cashflow live
- Estimated rent
- $1,205 high interval (Pro) →
- Mortgage (P&I)
- −$656
- Tax from tax record
- −$100 /mo · $1,198/yr
- Insurance
- −$52
- HOA
- −$159
- Vacancy / Maint / Mgmt
- −$253
- Net cashflow
- $-15
Break-even live
Sensitivity live
| Price | -10% $56 | -5% $21 | +0% $-15 | +5% $-50 | +10% $-85 |
|---|---|---|---|---|---|
| Rent | -10% $-110 | -5% $-62 | +0% $-15 | +5% $33 | +10% $81 |
| Rate | -1.0pp $48 | -0.5pp $17 | base $-15 | +0.5pp $-47 | +1.0pp $-80 |
UW: 25.0% down · 7.5% · 30yr · 1.5% tax · 5.0% vac · 8.0% maint · 8.0% mgmt
Financing live
Cash to close
- Down payment
- $31,250
- Closing costs
- $3,750
- Reserves months
- —
- Total cash needed
- —
Loan-product check · same deal, 3 products live
Conventional
25% down · 7.5% · 30yr
- Down + closing
- —
- Monthly P&I
- —
- Monthly cashflow
- —
- DSCR
- —
- Eligible?
- —
Personal DTI + credit; lowest rate.
DSCR
20% down · 8.5% · 30yr
- Down + closing
- —
- Monthly P&I
- —
- Monthly cashflow
- —
- DSCR
- —
- Eligible?
- —
No personal income docs; deal must DSCR.
Hard money
10% down · 12.0% · 12mo
- Down + closing
- —
- Monthly P&I
- —
- Monthly cashflow
- —
- DSCR
- —
- Eligible?
- —
Short-term bridge; refi at stabilization.
Rent comps 10 comps
| Address | Beds | Baths | Sqft | Rent | $/sqft | DOM | Units | Dist |
|---|---|---|---|---|---|---|---|---|
| 3065 Huntleigh Dr Raleigh, NC | — | 1.0 | 512 | $1,095 | $2.14 | 16d | 1 | 0.09mi |
| 3081 Huntleigh Dr Raleigh, NC | 1.0 | 1.0 | 590 | $1,250 | $2.12 | 14d | 1 | 0.09mi |
| 3071 Huntleigh Dr Raleigh, NC | — | 1.0 | 512 | $1,150 | $2.25 | 14d | 1 | 0.09mi |
| 2911 Mid-Century Dr Raleigh, NC | 3.0 | 1.0–2.0 | 1038 | $1,630 | $1.57 | 3d | 37 | 0.43mi |
| 2717 Capital Blvd Raleigh, NC | 1.0 | 1.0 | 296 | $1,116 | $3.76 | 4d | 9 | 0.73mi |
| 4219 Brockton Dr Raleigh, NC | 1.0–2.0 | 1.0–1.5 | 800 | $1,084 | $1.35 | 4d | 6 | 1.06mi |
| 800 Moratuck Dr Raleigh, NC | 1.0 | 2.0 | 750 | $1,100 | $1.47 | 25d | 1 | 1.27mi |
| 2080 Brentmoor Dr Raleigh, NC | 1.0 | 1.0 | 735 | $1,325 | $1.80 | 14d | 1 | 1.30mi |
| 2080 Brentmoor Dr Raleigh, NC | 1.0 | 1.0 | 735 | $1,325 | $1.80 | 25d | 1 | 1.30mi |
| 4000 Saint James Church Rd Raleigh, NC | 1.0–2.0 | 1.0 | 838 | $840 | $1.00 | 25d | 1 | 1.49mi |
HOA detail condo
- Monthly dues
- $159 · $1,908/yr
- Assessments
- None detected in remarks — confirm with the listing agent.
Listing history 11 events
-
2026-06-21days on market $125,000 Active 16 DOM
-
2026-06-18days on market $125,000 Active 13 DOM
-
2026-06-17days on market $125,000 Active 12 DOM
-
2026-06-16days on market $125,000 Active 11 DOM
-
2026-06-15days on market $125,000 Active 10 DOM
-
2026-06-13days on market $125,000 Active 8 DOM
-
2026-06-13days on market $125,000 Active 7 DOM
-
2026-06-09days on market $125,000 Active 4 DOM
-
2026-06-08days on market $125,000 Active 3 DOM
-
2026-06-07remarks 699-char remark
-
2026-06-07$125,000 Active 2 DOM
ⓘ Source: listings_history table (triggers on properties + properties_extension) + one-shot
backfill from property_details.listing_events for pre-trigger history.
Tax reassessment forecast NC · Resets to sale price
- Current annual tax
- $1,198 · $100/mo
- Projected year-2 tax
- $1,198 · $100/mo
- Expected delta
- $0/yr ($0/mo · 0.0%)
ⓘ Screening estimate from a state-policy table — verify with the county assessor before closing.
Climate risk First Street
- Flood 3/10 Moderate FEMA zone X (unshaded) · 10% chance over 30 yrs
- Wildfire 1/10 Low
- Heat 7/10 Severe 7 d/yr ≥105°F today · 17 d/yr by 30 yrs out
- Wind 6/10 Major 55% chance of damaging wind over 30 yrs
- Air quality 3/10 Moderate 2 unhealthy d/yr today · 2 by 30 yrs out
Nearby sold comps map
Loading sold comps map…
Walkable amenities ~0.75 mi
Loading nearby amenities…
Taxation est. · year 1
- Rental income
- $14,459
- − Mortgage interest
- −$7,002
- − Property taxes
- −$1,198
- − Insurance
- −$625
- − Repairs & maintenance
- −$1,157
- − Management
- −$1,157
- − HOA
- −$1,908
- − Depreciation
- −$3,636
- Taxable loss
- −$2,224
- Est. tax savings @ 24.0%
- +$534
- After-tax cash flow
- $359/yr
For passive investors: Depreciation is non-cash, so a rental often shows a tax loss while cash-flowing — sheltering income. Rental losses are passive: they offset passive income freely, and up to $25,000/yr can offset ordinary (W-2) income if you actively participate and your MAGI is under $100k (phasing out to $0 by $150k); unused losses carry forward. On sale, claimed depreciation is recaptured at up to 25%, and gains may owe capital-gains tax (a 1031 exchange can defer both). Figures are a year-1 estimate at your 24.0% rate — not tax advice; consult a CPA.
Schools (NCES district)
- District
- Wake County Schools
- NCES district ID
- 3704720
- Math proficiency
- 52% ▲ 2.00%
- Reading proficiency
- 60% ▲ 4.00%
- Median HH income
- $67,509
- Composite
- 49.41/100
- National rank
- #2010
- State rank
- #35 of 178 in NC
Livability — Raleigh
- Score
- 83/100
- State rank
- #10
- US rank
- #1028
Category grades
Schools grade is shown separately in the Schools card above.
Census & demographics
- Census place
- Raleigh, NC
- County
- Wake County · 1,216,256 people
- City population
- 569,344
- Metro
- Raleigh-Cary, NC
- Population (ZIP)
- 44,514
- Household income
- $70,375
- Rent vs Own
- Severe rent burden
- 1951.0
Population outlook (Wake County) Hauer SSP2
- Today (2025)
- 1,293,152 people
- By 2030
- 1,428,223 · +10.4%
- By 2040
- 1,698,188 · +31.3%
- By 2050
- 1,955,807 · +51.2%
- By 2075
- 2,520,273 · +94.9%
- By 2100
- 2,893,335 · +123.7%
Race, ethnicity, and origin ACS 2023
- Neighborhood character
- Highly diverse neighborhood (Simpson 0.72)
- Race & ethnicity
- White 38% Black 30% Hispanic / Latino 21% Two or more races 8% Asian 7%
- Hispanic origin (detail)
- Mexican 6% Puerto Rican 2% Cuban 1% Dominican 3%
- Common ancestry
- Slovak 2% Romanian 2% Lithuanian 1%
- Foreign-born
- 21% · Canada, Vietnam, South Korea
- Languages at home
- 72% English-only · Spanish 18% Vietnamese 4% Other Indo-European 1%
Political lean MEDSL · Wake
- 2024 margin
- Strong D (+25.5) · D 61.9% · R 36.4% · Other 1.7%
- 2008→2024 swing
- +11.1pp toward D · 2008: 14.4pp · 2024: 25.5pp
- All cycles
- 2024: D+25.5 2020: D+26.4 2016: D+20.5 2012: D+10.2 2008: D+14.4
Not yet ingested
- Civics
- —
Market trends
- HPI YoY
- ▼ -346.76%
- Current HPI
- 234.0741
- Rent YoY
- ▼ -0.27%
- Metro
- Raleigh-Cary, NC
- State GDP YoY
- ▲ 3.28%
- F500 in state
- 26
Industry mix (Fortune 500 HQ in NC)
| Industry | F500 HQs | Revenue |
|---|---|---|
| Financial Services | 2 | $213B |
|
||
| Retail | 2 | $95B |
|
||
| Industrial Conglomerate | 1 | $38B |
|
||
| Metals / Steel | 1 | $35B |
|
||
| Utilities | 1 | $30B |
|
||
| Industrial Machinery | 1 | $19B |
|
||
Price history
+431.9% since first listed6 events — show timeline
- 2026-06-05 Listed $125,000 TMLS
- 2023-10-05 Sold (Public Records) $140,000 Public Records
- 2019-09-03 Sold (Public Records) $59,000 Public Records
- 2017-09-28 Sold (Public Records) $45,000 Public Records
- 2016-05-13 Sold (Public Records) $25,000 Public Records
- 1989-06-30 Sold (Public Records) $23,500 Public Records
Property tax history
+7.6%/yrLatest (2025): $1,198 · +0.4% YoY. Source: county tax records.
Cash-flow waterfall
monthlySold comps — $/sqft
last 12 mo · ≤1 miLoading sold comps…