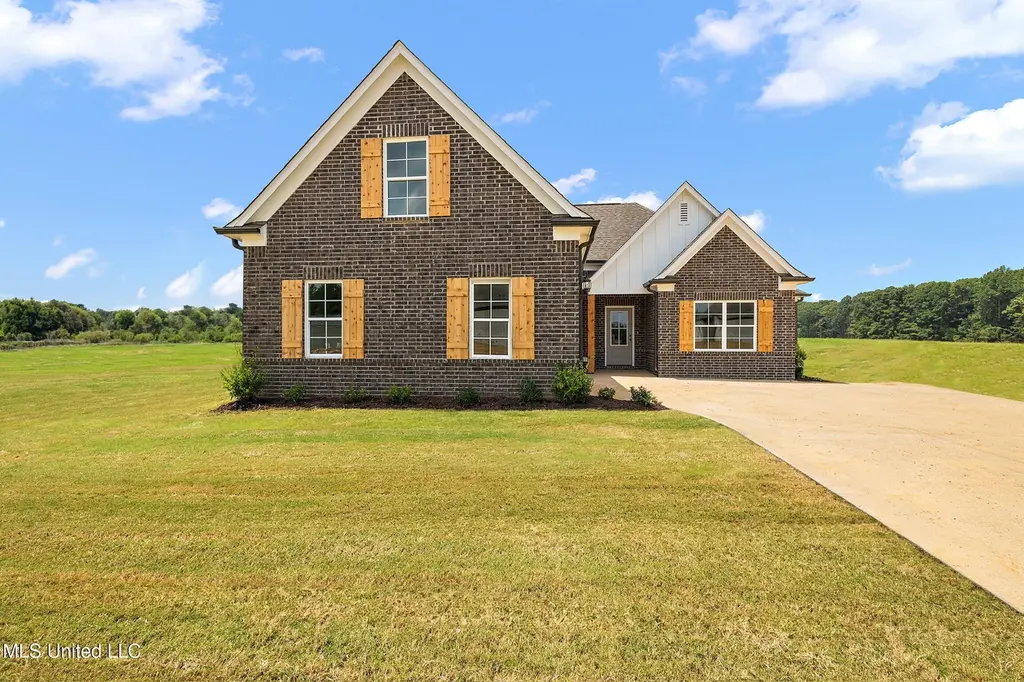
6326 River Ln · Lynchburg, MS
Flood risk No data
- FEMA flood zone
- —
- Chance of flooding over 30 yrs
- —
- Est. flood insurance / yr
- —
Fire risk No data
- Est. fire insurance / yr
- —
Heat risk No data
- Hot days now (above threshold)
- —
- Hot days in 30 yrs
- —
Wind risk No data
- Chance of severe wind over 30 yrs
- —
Air-quality risk No data
- Unhealthy air days now
- —
- Unhealthy air days in 30 yrs
- —
Risk factors via First Street. Map © Google.
Why this score? — see what drove the D- grade
The composite is a weighted blend of 9 inputs, each scored 0–100. Each bar is that input's sub-score; the figure is the points it added to the 100-point composite (weight × sub-score).
- Appreciation +10.0/10.0
- ARV discount +7.7/15.0
- Cash flow +6.2/30.0
- Schools +4.0/10.0
- Livability +3.2/5.0
- Rent growth +2.5/5.0
- Condition / age +2.5/5.0
- 1% rule +1.6/10.0
- DSCR +0.5/10.0
$309,900
🖨 Deal sheet 📄 Offer letter ✓ Due diligence
Listing remarks
Seller will consider paying 3% in concessions towards buyers closing expenses with acceptable offer. NEW CONSTRUCTION! Welcome to the Sorghum plan. You'll love this split plan 4-bedroom home. As you enter thru a grand foyer into the spacious family room (with a gas FP), it opens into the roomy kitchen with a bar that separates them. Just off the kitchen area is a pantry and a door that leads to the laundry area, along with stairs to the upstairs bonus/4th bedroom! Back downstairs you will find 2 bedrooms on the other side of the house with bathroom as well. Back off of the kitchen is the primary bedroom with primary bath. In the bathroom you will find a double vanity, large walk-in closet,
Key facts
- Pantry
- Grand foyer
- New construction
Tags
Property features AI
Finance
- HOA & community: Homeowners association with annual fee of $300; Community features include curbs and sidewalks
Exterior
- Parking: Attached 2-car garage with garage door opener and concrete floor
- Security: Smoke detectors; Carbon monoxide detectors; Deadbolt locks
- Utilities: Public water; Public sewer; Electricity connected; Natural gas connected; Fiber to the house; Underground utilities
- Home design: Single-family house; Two levels; Move-in ready; New construction (builder model: Sorghum)
- Construction: Brick construction; Slab foundation; Architectural shingle roof; Year built and living area reported by builder
- Exterior features: Patio; Rain gutters; Landscaped, level lot
Interior
- Kitchen: Dishwasher; Disposal; Electric range; Free-standing electric oven; Microwave; Exhaust fan; Oven; Plumbed for ice maker; Stainless steel appliances; Granite countertops; Pantry; Breakfast bar
- Bedrooms: Primary bedroom (first level) — 13x16; Bedroom (first level) — 10x12; Bedroom (first level) — 10x12; Bonus room (second level) — 13x16; Family room (first level) — 14x20; Dining room (first level) — 12x10; Kitchen (first level) — 10x10; Total rooms: 7
- Flooring: Luxury vinyl; Carpet; Combination of flooring types
- Bathrooms: 2 full bathrooms
- Heating & cooling: Central heating (forced air, natural gas); Central air conditioning (electric, multi-unit system)
- Interior features: Open floorplan; Cathedral ceilings; Ceiling fans; Breakfast bar; Pantry; Recessed lighting; Double vanity; Granite counters; Bay windows with vinyl frames; Deadbolt locks; Fiberglass insulated doors; Gas-log fireplace with gas starter in the living room
- Laundry & utility: Laundry located on lower level
Neighborhood map
What this means for you Summary
Snapshot
- This is a 4-bed/2.0-bath single-family listed at $310k.
Deal economics
- At list price, monthly cash flow is $-562 ($-7k/yr) — negative.
- To cash-flow at today's rent, offer at most $229k (26.2% below list).
- To meet the 1% rule (rent ≥ 1% of price), the offer needs to be $203k (34.5% below list).
- Recommended offer: $203k (34.5% below list) — sets the bar for 1% rule.
Location & tenants
- Location reads 63/100 on livability (#145 in MS) — a middle-class / working-renter tenant base. Strengths: crime A+, cost of living A+, housing A+; Watch: amenities F, commute F, health & safety F.
- Desoto County School District (suburban): math 48% / reading 42% proficiency, ranked #20 of 130 in MS (top 15%) — families likely to look elsewhere, expect single-tenant / working-renter base with shorter leases.
- Zoned schools: Lake Cormorant Elementary (math 48% / reading 55%, grade C-, #56 of 375 statewide, top 15%, 647 students, 100% FRL); Lake Cormorant Middle (math 51% / reading 30%, grade F, #60 of 179 statewide, top 37%, 764 students, 100% FRL); Lake Cormorant High (math 29% / reading 42%, grade F, #66 of 197 statewide, top 34%, 969 students, 100% FRL) — zoned schools average 100% FRL vs 43% district-wide (56 pts higher); higher-poverty schools than district average — tighter screening recommended.
- Market conditions: 51 active listings in the ZIP; 12 comparable units currently listed for rent nearby; rentals at typical pace (median 17d on market — plan ~3-4 weeks tenant-placement turnaround); 1,155 units permitted in DeSoto County in 2024 (0 in 5+ unit buildings).
- This rent runs 41% of the median local income ($60k/yr) — at the standard rent-burdened threshold; future hikes will face affordability resistance.
Forward outlook
- In year one you build about $33k of equity ($2k loan paydown + $31k appreciation (10.0% local appreciation)).
- DeSoto County population projected at +33% by 2050 — long-run rental-demand tailwind backs the buy-and-hold thesis.
- By year 2, paydown + projected appreciation supports a ~$53k cash-out refi (75% LTV) — recoverable capital for the next deal without selling this one.
Negotiation context
- It's been on market 36 days — a 3% lower offer ($301k) is reasonable based on typical stale-listing flexibility.
Questions for the listing agent
- What do current leases actually rent for vs. the listed asking? Can we see a recent rent roll and the last 12 months of T-12 income?
- It's been on market 36 days. Have you received any prior offers? Is the seller open to a 34% concession, seller financing, or rate buy-down credit?
- What does the HOA fee cover, when was the last increase, and are there any pending special assessments or reserve-fund shortfalls?
- Is there a deadline driving the sale (1031 exchange, divorce, estate, relocation)? That informs how much negotiation room exists.
- Schools are F-rated, which usually means shorter tenancies and higher turnover. Who's the typical renter profile here, and what's been the actual vacancy rate?
- The area grade is low — what's the realistic commute time and amenity access for the typical tenant pool here? Any planned neighborhood developments (good or bad) we should know about?
- What's the average days-on-market for RENTAL listings here right now (not sales)? A rising rental-DOM trend means longer vacancies and softer asking-rent achievability than the comps imply.
- What's the recent tenant-quality profile in this submarket — average credit score on applications, eviction rate, late-payment / NSF rate, and stable-employment percentage? A property-management company in the area should have these aggregated.
- How much new for-sale + rental construction is in the pipeline within 1–3 miles? Heavy new supply typically softens prices + rents 12–24 months out; constrained supply supports both.
Investment metrics
- 1% rule
- 0.66% ✗
- Cap rate
- 4.12%
- Cash-on-cash
- -7.77%
- DSCR
- 0.65
- GRM
- 12.7
CMA / ARV
- ARV (median comp)
- $311,367
- List price
- $309,900
- Delta
- -0.47%
- Verdict
- FAIR
- Comps
- 20 within 1.0 mi
Show comp detail 12 sales within ~0.75 mi
| Address | Dist | Beds/Ba | Sqft | Sold | Price | $/sf | Match |
|---|---|---|---|---|---|---|---|
| 6432 Clover Ct | 0.03mi | 4/2.0 | 1,853 (+1%) | 2mo | $309,900 | $167 | 96 |
| 6343 Jameson Cv | 0.04mi | 4/2.0 | 1,853 (+1%) | 3mo | $309,900 | $167 | 95 |
| 6510 Benjamin Cv | 0.10mi | 4/2.0 | 1,839 (-0%) | 1mo | $309,900 | $169 | 94 |
| 6416 Clover Ct | 0.04mi | 4/2.0 | 1,840 (0%) | 5mo | $307,900 | $167 | 94 |
| 6518 Benjamin Cv | 0.11mi | 4/2.0 | 1,840 (0%) | 3mo | $309,900 | $168 | 92 |
| 6393 Jameson Cv | 0.07mi | 4/2.0 | 1,839 (-0%) | 5mo | $309,900 | $169 | 92 |
| 6394 Jameson Cv | 0.10mi | 4/2.0 | 1,839 (-0%) | 5mo | $309,900 | $169 | 91 |
| 6359 Jameson Cv | 0.05mi | 4/2.0 | 1,903 (+3%) | 1mo | $319,900 | $168 | 91 |
| 6502 Benjamin Cv | 0.10mi | 4/2.0 | 1,903 (+3%) | 2mo | $319,900 | $168 | 88 |
| 6398 Jameson Cv | 0.10mi | 4/2.0 | 1,903 (+3%) | 6mo | $315,900 | $166 | 85 |
| 6251 Clover Ct | 0.20mi | 4/2.0 | 1,986 (+8%) | 2mo | $330,900 | $167 | 76 |
| 6263 Clover Ct | 0.19mi | 3/2.0 (-1) | 1,940 (+5%) | 3mo | $324,900 | $167 | 74 |
Match score weights: distance 35% · size 25% · config 20% · recency 20%. Top-matched comps best support the ARV.
Projected returns pro-forma
10.0% appreciation · 3.0% rent growth · sell at horizon
- IRR
- 18.8%
- Equity multiple
- 2.53×
- Total profit
- $133,036
- Equity at exit
- $279,182
- IRR
- 17.4%
- Equity multiple
- 5.84×
- Total profit
- $420,005
- Equity at exit
- $602,068
Cash invested: $86,772 (down + closing). Projections, not guarantees.
Landlord ↔ Tenant lean methodology
- Overall (STATE)
- 90 Strongly Landlord-Friendly
- State Mississippi
- 90 Strongly Landlord-Friendly · R+11
- County
- — inherits STATE
- City
- — inherits STATE
ZIP-level market 38680
- Home prices YoY
- 4.6%
- Active inventory
- 51
- Price-to-rent
- 12.7×
Monthly cashflow live
- Estimated rent
- $2,031 high interval (Pro) →
- Mortgage (P&I)
- −$1,625
- Tax est. 1.5%
- −$387 /mo · $4,648/yr
- Insurance
- −$129
- HOA
- −$25
- Vacancy / Maint / Mgmt
- −$427
- Net cashflow
- $-562
Break-even live
UW: 25.0% down · 7.5% · 30yr · 1.5% tax · 5.0% vac · 8.0% maint · 8.0% mgmt
Financing live
Cash to close
- Down payment
- $77,475
- Closing costs
- $9,297
- Reserves months
- —
- Total cash needed
- —
Loan-product check · same deal, 3 products live
Conventional
25% down · 7.5% · 30yr
- Down + closing
- —
- Monthly P&I
- —
- Monthly cashflow
- —
- DSCR
- —
- Eligible?
- —
Personal DTI + credit; lowest rate.
DSCR
20% down · 8.5% · 30yr
- Down + closing
- —
- Monthly P&I
- —
- Monthly cashflow
- —
- DSCR
- —
- Eligible?
- —
No personal income docs; deal must DSCR.
Hard money
10% down · 12.0% · 12mo
- Down + closing
- —
- Monthly P&I
- —
- Monthly cashflow
- —
- DSCR
- —
- Eligible?
- —
Short-term bridge; refi at stabilization.
Rent comps 12 comps
| Address | Beds | Baths | Sqft | Rent | $/sqft | DOM | Units | Dist |
|---|---|---|---|---|---|---|---|---|
| 6670 Tangleberry Cv Walls, MS | 3.0 | 2.0 | 1600 | $1,770 | $1.11 | 20d | 1 | 0.26mi |
| 6640 Poplar Corner Rd Walls, MS | 3.0 | 3.0 | 2267 | $2,300 | $1.01 | 4d | 1 | 0.57mi |
| 7051 Lake Forest Dr N Walls, MS | 3.0 | 2.0 | 1551 | $1,595 | $1.03 | 43d | 1 | 0.77mi |
| 6757 River Birch Rd Walls, MS | 3.0 | 2.0 | 1331 | $1,720 | $1.29 | 11d | 1 | 0.87mi |
| 5968 Shannon Dr Horn Lake, MS | 3.0 | 2.0 | 1374 | $1,650 | $1.20 | 20d | 1 | 1.00mi |
| 6915 Black Thorn Dr Walls, MS | 4.0 | 2.0 | 1382 | $1,655 | $1.20 | 4d | 1 | 1.02mi |
| 6916 Fox Briar Cv Walls, MS | 3.0 | 2.0 | 1350 | $1,600 | $1.19 | 4d | 1 | 1.10mi |
| 7089 Willow Point Dr Horn Lake, MS | 3.0 | 2.0 | 1900 | $1,895 | $1.00 | 17d | 1 | 1.22mi |
| 5309 Longwood Cv Horn Lake, MS | 4.0 | 2.0 | 1704 | $1,400 | $0.82 | 21d | 1 | 1.22mi |
| 6205 Liberty Estates Dr Walls, MS | 3.0 | 2.0 | 1357 | $1,555 | $1.15 | 4d | 1 | 1.24mi |
| 7601 Broken Hickory Dr Walls, MS | 4.0 | 3.0 | 2176 | $1,811 | $0.83 | 43d | 1 | 1.28mi |
| 5331 Greenwood Rd Horn Lake, MS | 4.0 | 2.0 | 1774 | $1,970 | $1.11 | 11d | 1 | 1.45mi |
HOA detail
- Monthly dues
- $25 · $300/yr
- Likely covers
- gas
Listing history 14 events
-
2026-06-18days on market $309,900 Active 36 DOM
-
2026-06-17days on market $309,900 Active 35 DOM
-
2026-06-16days on market $309,900 Active 34 DOM
-
2026-06-15days on market $309,900 Active 33 DOM
-
2026-06-13days on market $309,900 Active 31 DOM
-
2026-06-10days on market $309,900 Active 28 DOM
-
2026-06-09days on market $309,900 Active 27 DOM
-
2026-06-08days on market $309,900 Active 26 DOM
-
2026-06-07days on market $309,900 Active 25 DOM
-
2026-06-03days on market $309,900 Active 21 DOM
-
2026-06-02days on market $309,900 Active 20 DOM
-
2026-06-01days on market $309,900 Active 19 DOM
-
2026-05-31days on market $309,900 Active 18 DOM
-
2026-05-13$309,900 Active 823-char remark
ⓘ Source: listings_history table (triggers on properties + properties_extension) + one-shot
backfill from property_details.listing_events for pre-trigger history.
Nearby sold comps map
Loading sold comps map…
Walkable amenities ~0.75 mi
Loading nearby amenities…
Taxation est. · year 1
- Rental income
- $24,375
- − Mortgage interest
- −$17,359
- − Property taxes
- −$4,648
- − Insurance
- −$1,550
- − Repairs & maintenance
- −$1,950
- − Management
- −$1,950
- − HOA
- −$300
- − Depreciation
- −$9,015
- Taxable loss
- −$12,397
- Est. tax savings @ 24.0%
- +$2,975
- After-tax cash flow
- $-3,768/yr
For passive investors: Depreciation is non-cash, so a rental often shows a tax loss while cash-flowing — sheltering income. Rental losses are passive: they offset passive income freely, and up to $25,000/yr can offset ordinary (W-2) income if you actively participate and your MAGI is under $100k (phasing out to $0 by $150k); unused losses carry forward. On sale, claimed depreciation is recaptured at up to 25%, and gains may owe capital-gains tax (a 1031 exchange can defer both). Figures are a year-1 estimate at your 24.0% rate — not tax advice; consult a CPA.
Schools (NCES district)
- District
- Desoto County School District
- NCES district ID
- 2801320
- Math proficiency
- 48% ▼ -13.00%
- Reading proficiency
- 42% ▼ -6.00%
- Median HH income
- $59,272
- Composite
- 39.56/100
- National rank
- #3933
- State rank
- #20 of 130 in MS
Livability — Lynchburg
- Score
- 63/100
- State rank
- #145
- US rank
- #14967
Category grades
Schools grade is shown separately in the Schools card above.
Census & demographics
- Census place
- Lynchburg, MS
- County
- DeSoto County · 176,513 people
- Metro
- Memphis, TN-MS-AR
- Population (ZIP)
- 6,839
- Household income
- $59,503
- Rent vs Own
- Severe rent burden
- 229.0
Population outlook (DeSoto County) Hauer SSP2
- Today (2025)
- 203,338 people
- By 2030
- 217,692 · +7.1%
- By 2040
- 245,320 · +20.6%
- By 2050
- 270,133 · +32.8%
- By 2075
- 323,341 · +59.0%
- By 2100
- 348,742 · +71.5%
Race, ethnicity, and origin ACS 2023
- Neighborhood character
- Diverse neighborhood (Simpson 0.60)
- Race & ethnicity
- Black 46% White 42% Hispanic / Latino 8% Two or more races 3% Native American 1% Asian 1%
- Hispanic origin (detail)
- Mexican 6%
- Common ancestry
- Romanian 1% Serbian 1% British 1%
- Foreign-born
- 4% · Canada
- Languages at home
- 93% English-only · Spanish 6%
Political lean MEDSL · DeSoto
- 2024 margin
- Strong R (+24.1) · D 36.7% · R 60.8% · Other 2.5%
- 2008→2024 swing
- +14.2pp toward D · 2008: -38.2pp · 2024: -24.1pp
- All cycles
- 2024: R+24.1 2020: R+23.9 2016: R+34.8 2012: R+33.5 2008: R+38.2
Not yet ingested
- Civics
- —
Market trends
- HPI YoY
- ▲ 10.29%
- Current HPI
- 232.28
- Rent YoY
- —
- Metro
- Memphis, TN-MS-AR
- State GDP YoY
- —
- F500 in state
- 0
Price history
1 event — show timeline
- 2026-05-13 Listed $309,900 MLSU
Cash-flow waterfall
monthlySold comps — $/sqft
last 12 mo · ≤1 miLoading sold comps…