 Fourplex
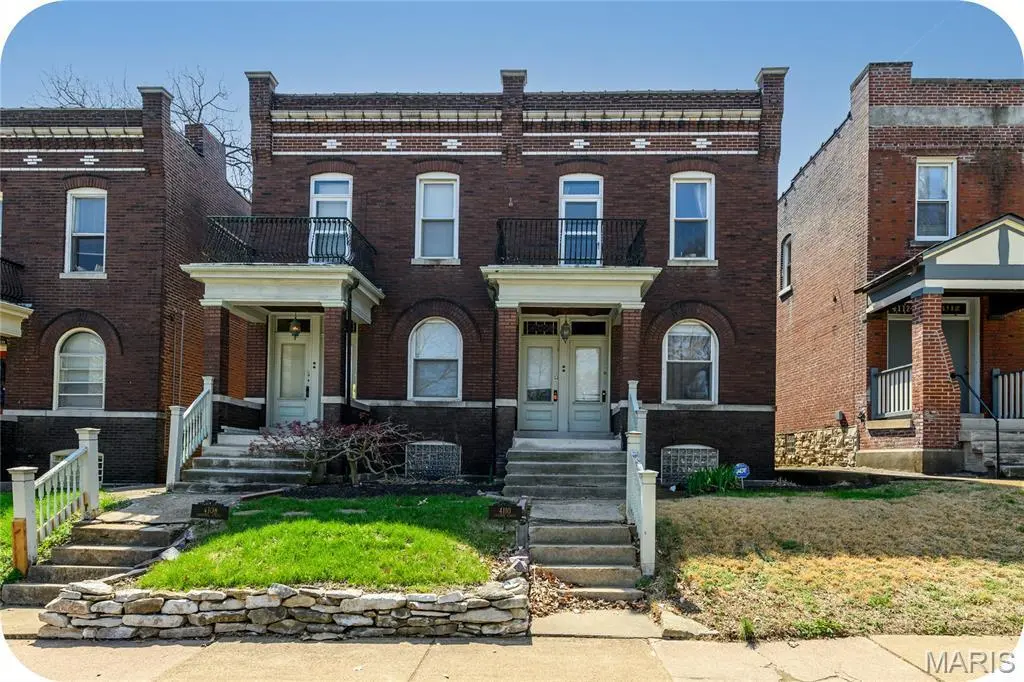
4108-4110 Arsenal St · St. Louis, MO
Flood risk 1/10 · Minimal
- FEMA flood zone
- X (unshaded)
- Chance of flooding over 30 yrs
- 0.0%
- Est. flood insurance / yr
- $473 – $860
Fire risk 1/10 · Minimal
- Est. fire insurance / yr
- $1,054 – $1,958
Heat risk 5/10 · Moderate
- Hot days now (above 108°F)
- 7 days/yr
- Hot days in 30 yrs
- 20 days/yr
Wind risk 2/10 · Minimal
- Chance of severe wind over 30 yrs
- 1.0%
Air-quality risk 3/10 · Minor
- Unhealthy air days now
- 3 days/yr
- Unhealthy air days in 30 yrs
- 4 days/yr
Risk factors via First Street. Map © Google.
Why this score? — see what drove the B- grade
The composite is a weighted blend of 9 inputs, each scored 0–100. Each bar is that input's sub-score; the figure is the points it added to the 100-point composite (weight × sub-score).
- Cash flow +30.0/30.0
- DSCR +10.0/10.0
- 1% rule +8.9/10.0
- ARV discount +8.3/15.0
- Condition / age +3.8/5.0
- Rent growth +3.2/5.0
- Livability +2.5/5.0
- Schools +1.2/10.0
- Appreciation +0.0/10.0
$475,000
🖨 Deal sheet 📄 Offer letter ✓ Due diligence
Multi-family units
County records classify this as Multi-Family (2-4 Unit). Listing-text estimate: 4 units. confirmed
Listing remarks MLS
Outstanding investment opportunity in highly desirable Tower Grove Heights, ideally situated just steps from Tower Grove Park, one of the city’s most vibrant and well-loved green spaces. This well maintained historic 4 family blends timeless charm with strong income potential. Ideal for investors looking to expand their portfolio or for those who want to occupy one unit while generating rental income. The building offers four spacious units, each with 1 bedroom, 1 bathroom and just over 1,000 square feet of living space. The property maintains historic character with original fireplaces, pocket doors and detailed trim that add charm and appeal. The property has a strong rental history with consistent demand, currently leased between $875 and $975 per month. One unit is on a flexible month to month lease, offering immediate upside or an opportunity for an owner occupant. Tenants enjoy the convenience of off street parking in the rear, along with access to laundry and additional storage in the basement. Unbeatable location just steps from the park, offering farmers markets, food trucks, festivals, pickleball and tennis courts, kickball fields and walking paths that are perfect for biking and strolls. Easy to rent and consistently income producing, this is a rare opportunity in one of St. Louis’ most desirable neighborhoods.
Key facts
- Pocket doors
- Historic 4 family
- Original fireplaces
Tags
Neighborhood map
What this means for you Summary
Snapshot
- This is a 4 × 4-bed/4.0-bath units multifamily listed at $475k. Condition is rated good.
Deal economics
- At list price, monthly cash flow is $2k ($23k/yr) — positive. Per door: $481/mo.
- The deal already cash-flows at list — no discount required.
- Meets the 1% rule at list price ($7k rent vs $475k).
- Recommended offer: $461k (3.0% below list) — sets the bar for market timing.
- Cap rate 11.2% vs local median 5.0% in St. Louis — top-decile yield for the area; either an underpriced asset or a hidden risk that comps aren't pricing in. Stress-test before assuming the spread holds.
Location & tenants
- Location reads: area grade B — affects rentability + tenant quality, not the cash-flow math above.
- St. Louis City (urban): math 10% / reading 18% proficiency, ranked #312 of 324 in MO (top 96%) — low school quality limits family demand, transient renter base, plan for 1-2y turnover; 80% free/reduced lunch — lower-income household profile, screen leases tightly.
- Market conditions: Rents rising (+2.6%/yr); 255 active listings in the ZIP; 294 units permitted in St. Louis city in 2024 (227 in 5+ unit buildings).
- At $6,590/mo this rent would consume 129% of the median local household income ($61k/yr) (locally 1923% of renters already pay >50% of income on rent) — very limited rent-growth headroom before tenants either downsize or default.
Forward outlook
- Local home prices are declining (-3.0%/yr); year-one equity from $3k of loan paydown is wiped out by about $14k of value loss. Plan a longer hold.
- St. Louis County population projected to shrink 6% by 2050 — rents likely to lag national; underwrite the cash flow, not the appreciation.
- At projected returns (-3.0% appreciation + 2.6% rent growth), your $133k cash investment doubles in ~8 years — after that, you're playing with house money.
Negotiation context
- It's been on market 35 days — a 3% lower offer ($461k) is reasonable based on typical stale-listing flexibility.
Risks & watch-outs
- Watch-outs: built in 1912 — expect roof / HVAC / electrical / plumbing capex.
- Climate carrying-cost: extreme-heat days projected 7→20/yr by 2055 (HVAC capex compounding) — expect insurance premiums to compound above CPI over the hold.
Questions for the listing agent
- It's been on market 35 days. Have you received any prior offers? Is the seller open to a 3% concession, seller financing, or rate buy-down credit?
- Can we see the unit-by-unit rent roll, current vacancy, and any below-market leases? What's the average tenancy length?
- What capital expenditures (roof, boiler, parking lot, exteriors) have been made in the last 5 years, and what's planned in the next 2?
- Built in 1912 — when were the roof, HVAC, electrical panel, plumbing, and water heater last replaced?
- Is there a deadline driving the sale (1031 exchange, divorce, estate, relocation)? That informs how much negotiation room exists.
- What's the average days-on-market for RENTAL listings here right now (not sales)? A rising rental-DOM trend means longer vacancies and softer asking-rent achievability than the comps imply.
- What's the recent tenant-quality profile in this submarket — average credit score on applications, eviction rate, late-payment / NSF rate, and stable-employment percentage? A property-management company in the area should have these aggregated.
- How much new apartment / multifamily construction is in the pipeline within 1–3 miles? Heavy new supply (>2% of stock underway) typically softens rents 12–24 months out; light construction supports rent growth.
Investment metrics
- 1% rule
- 1.39% ✓
- Cap rate
- 11.15%
- Cash-on-cash
- 17.35%
- DSCR
- 1.77
- GRM
- 6.0
CMA / ARV
- ARV (median comp)
- $483,523
- List price
- $475,000
- Delta
- -1.76%
- Verdict
- FAIR
- Comps
- 20 within 1.0 mi
Projected returns pro-forma
-3.0% appreciation · 2.62% rent growth · sell at horizon
- IRR
- 8.3%
- Equity multiple
- 1.32×
- Total profit
- $43,126
- Equity at exit
- $70,824
- IRR
- 17.2%
- Equity multiple
- 2.39×
- Total profit
- $185,484
- Equity at exit
- $41,069
Cash invested: $133,000 (down + closing). Projections, not guarantees.
Landlord ↔ Tenant lean methodology
- Overall (STATE)
- 81 Strongly Landlord-Friendly
- State Missouri
- 81 Strongly Landlord-Friendly · R+10
- County
- — inherits STATE
- City
- — inherits STATE
ZIP-level market 63116
- Rents YoY
- 2.6%
- Active inventory
- 255
- Price-to-rent
- 24.0×
Monthly cashflow live
- Estimated rent
- $6,590 high interval (Pro) →
- Mortgage (P&I)
- −$2,491
- Tax est. 1.5%
- −$594 /mo · $7,125/yr
- Insurance
- −$198
- HOA
- −$0
- Vacancy / Maint / Mgmt
- −$1,384
- Net cashflow
- $1,923
Break-even live
4-unit breakdown (identical units grouped — click to expand)
| Units | Beds | Baths | Est. rent |
|---|---|---|---|
| 4× units | 4 | 4 | $6,588 |
| #1 | 4 | 4 | $1,647 |
| #2 | 4 | 4 | $1,647 |
| #3 | 4 | 4 | $1,647 |
| #4 | 4 | 4 | $1,647 |
| Total (4 units) | $6,590 | ||
UW: 25.0% down · 7.5% · 30yr · 1.5% tax · 5.0% vac · 8.0% maint · 8.0% mgmt
Financing live
Cash to close
- Down payment
- $118,750
- Closing costs
- $14,250
- Reserves months
- —
- Total cash needed
- —
Loan-product check · same deal, 3 products live
Conventional
25% down · 7.5% · 30yr
- Down + closing
- —
- Monthly P&I
- —
- Monthly cashflow
- —
- DSCR
- —
- Eligible?
- —
Personal DTI + credit; lowest rate.
DSCR
20% down · 8.5% · 30yr
- Down + closing
- —
- Monthly P&I
- —
- Monthly cashflow
- —
- DSCR
- —
- Eligible?
- —
No personal income docs; deal must DSCR.
Hard money
10% down · 12.0% · 12mo
- Down + closing
- —
- Monthly P&I
- —
- Monthly cashflow
- —
- DSCR
- —
- Eligible?
- —
Short-term bridge; refi at stabilization.
Listing history 3 events
-
2026-05-11status Pending 1355-char remark
Show marketing remark (1355 chars)
Outstanding investment opportunity in highly desirable Tower Grove Heights, ideally situated just steps from Tower Grove Park, one of the city’s most vibrant and well-loved green spaces. This well maintained historic 4 family blends timeless charm with strong income potential. Ideal for investors looking to expand their portfolio or for those who want to occupy one unit while generating rental income. The building offers four spacious units, each with 1 bedroom, 1 bathroom and just over 1,000 square feet of living space. The property maintains historic character with original fireplaces, pocket doors and detailed trim that add charm and appeal. The property has a strong rental history with consistent demand, currently leased between $875 and $975 per month. One unit is on a flexible month to month lease, offering immediate upside or an opportunity for an owner occupant. Tenants enjoy the convenience of off street parking in the rear, along with access to laundry and additional storage in the basement. Unbeatable location just steps from the park, offering farmers markets, food trucks, festivals, pickleball and tennis courts, kickball fields and walking paths that are perfect for biking and strolls. Easy to rent and consistently income producing, this is a rare opportunity in one of St. Louis’ most desirable neighborhoods.
-
2026-05-05price $475,000 1355-char remark
Show marketing remark (1355 chars)
Outstanding investment opportunity in highly desirable Tower Grove Heights, ideally situated just steps from Tower Grove Park, one of the city’s most vibrant and well-loved green spaces. This well maintained historic 4 family blends timeless charm with strong income potential. Ideal for investors looking to expand their portfolio or for those who want to occupy one unit while generating rental income. The building offers four spacious units, each with 1 bedroom, 1 bathroom and just over 1,000 square feet of living space. The property maintains historic character with original fireplaces, pocket doors and detailed trim that add charm and appeal. The property has a strong rental history with consistent demand, currently leased between $875 and $975 per month. One unit is on a flexible month to month lease, offering immediate upside or an opportunity for an owner occupant. Tenants enjoy the convenience of off street parking in the rear, along with access to laundry and additional storage in the basement. Unbeatable location just steps from the park, offering farmers markets, food trucks, festivals, pickleball and tennis courts, kickball fields and walking paths that are perfect for biking and strolls. Easy to rent and consistently income producing, this is a rare opportunity in one of St. Louis’ most desirable neighborhoods.
-
2026-04-06$500,000 Active 1355-char remark
Show marketing remark (1355 chars)
Outstanding investment opportunity in highly desirable Tower Grove Heights, ideally situated just steps from Tower Grove Park, one of the city’s most vibrant and well-loved green spaces. This well maintained historic 4 family blends timeless charm with strong income potential. Ideal for investors looking to expand their portfolio or for those who want to occupy one unit while generating rental income. The building offers four spacious units, each with 1 bedroom, 1 bathroom and just over 1,000 square feet of living space. The property maintains historic character with original fireplaces, pocket doors and detailed trim that add charm and appeal. The property has a strong rental history with consistent demand, currently leased between $875 and $975 per month. One unit is on a flexible month to month lease, offering immediate upside or an opportunity for an owner occupant. Tenants enjoy the convenience of off street parking in the rear, along with access to laundry and additional storage in the basement. Unbeatable location just steps from the park, offering farmers markets, food trucks, festivals, pickleball and tennis courts, kickball fields and walking paths that are perfect for biking and strolls. Easy to rent and consistently income producing, this is a rare opportunity in one of St. Louis’ most desirable neighborhoods.
ⓘ Source: listings_history table (triggers on properties + properties_extension) + one-shot
backfill from property_details.listing_events for pre-trigger history.
Climate risk First Street
- Flood 1/10 Low FEMA zone X (unshaded) · 0% chance over 30 yrs
- Wildfire 1/10 Low
- Heat 5/10 Major 7 d/yr ≥108°F today · 20 d/yr by 30 yrs out
- Wind 2/10 Low 100% chance of damaging wind over 30 yrs
- Air quality 3/10 Moderate 3 unhealthy d/yr today · 4 by 30 yrs out
Nearby sold comps map
Loading sold comps map…
Walkable amenities ~0.75 mi
Loading nearby amenities…
Taxation est. · year 1
- Rental income
- $79,080
- − Mortgage interest
- −$26,607
- − Property taxes
- −$7,125
- − Insurance
- −$2,375
- − Repairs & maintenance
- −$6,326
- − Management
- −$6,326
- − Depreciation
- −$13,818
- Taxable income
- $16,502
- Est. tax owed @ 24.0%
- −$3,960
- After-tax cash flow
- $19,121/yr
For passive investors: Depreciation is non-cash, so a rental often shows a tax loss while cash-flowing — sheltering income. Rental losses are passive: they offset passive income freely, and up to $25,000/yr can offset ordinary (W-2) income if you actively participate and your MAGI is under $100k (phasing out to $0 by $150k); unused losses carry forward. On sale, claimed depreciation is recaptured at up to 25%, and gains may owe capital-gains tax (a 1031 exchange can defer both). Figures are a year-1 estimate at your 24.0% rate — not tax advice; consult a CPA.
Condition & rehab AI · 14 photos
This multi-family property in Tower Grove Heights is in good condition with minimal repairs needed. Painting the exterior and interior and landscaping can significantly increase its value.
Repairs flagged
- Minor Paint — The paint appears to be in good condition with no visible damage or wear.
- Minor Landscaping — The landscaping appears to be in good condition with no visible damage or wear.
Value-add opportunities
- Both Painting the exterior and interior — Painting the exterior and interior can enhance the curb appeal and interior aesthetics, which can increase both resale and rental value.
- Both Landscaping — Landscaping can enhance the curb appeal and interior aesthetics, which can increase both resale and rental value.
Renovation cost estimate screening
| Repair item | Severity | Est. cost |
|---|---|---|
| Paint · The paint appears to be in good condition with no visible damage or wear. | Minor | $500–3,000 |
| Landscaping · The landscaping appears to be in good condition with no visible damage or wear. | Minor | $500–3,000 |
| Total estimated repair cost · 2 items | $1,000–6,000 |
Value-add ROI direction
- Both Painting the exterior and interior — Painting the exterior and interior can enhance the curb appeal and interior aesthetics, which can increase both resale and rental value. ↑
- Both Landscaping — Landscaping can enhance the curb appeal and interior aesthetics, which can increase both resale and rental value. ↑
ⓘ Cost ranges are severity-bucket heuristics (US national rule-of-thumb). Get contractor quotes + a written scope before underwriting a rehab budget.
Schools (NCES district)
- District
- St. Louis City
- NCES district ID
- 2929280
- Math proficiency
- 10% ▼ -6.00%
- Reading proficiency
- 18% ▼ -3.00%
- Median HH income
- $35,685
- Composite
- 11.54/100
- National rank
- #9699
- State rank
- #312 of 324 in MO
Livability — St. Louis
No livability data for this city. (Only ~50 U.S. cities are tracked.)
Census & demographics
- Census place
- St. Louis, MO
- County
- Saint Louis City · 254,015 people
- City population
- 283,259
- Metro
- St. Louis, MO-IL
- Population (ZIP)
- 42,170
- Household income
- $61,433
- Rent vs Own
- Severe rent burden
- 1923.0
Population outlook (St. Louis County) Hauer SSP2
- Today (2025)
- 315,737 people
- By 2030
- 313,865 · -0.6%
- By 2040
- 305,439 · -3.3%
- By 2050
- 296,529 · -6.1%
- By 2075
- 271,028 · -14.2%
- By 2100
- 255,359 · -19.1%
Race, ethnicity, and origin ACS 2023
- Neighborhood character
- Diverse neighborhood (Simpson 0.63)
- Race & ethnicity
- White 54% Black 27% Hispanic / Latino 10% Two or more races 8% Asian 5%
- Hispanic origin (detail)
- Mexican 7%
- Common ancestry
- Lithuanian 4% Romanian 2% Italian 2%
- Foreign-born
- 11% · Canada, Vietnam, Philippines
- Languages at home
- 85% English-only · Spanish 6% Vietnamese 2% Arabic 2%
Political lean MEDSL · St. Louis
- 2024 margin
- Solid D (+64.7) · D 81.4% · R 16.7% · Other 2.0%
- 2008→2024 swing
- -3.5pp toward R · 2008: 68.2pp · 2024: 64.7pp
- All cycles
- 2024: D+64.7 2020: D+66.2 2016: D+63.7 2012: D+66.6 2008: D+68.2
Not yet ingested
- Civics
- —
Market trends
- HPI YoY
- ▼ -271.19%
- Current HPI
- 215.7108
- Rent YoY
- ▲ 2.62%
- Metro
- St. Louis, MO-IL
- State GDP YoY
- ▲ 1.84%
- F500 in state
- 20
Industry mix (Fortune 500 HQ in MO)
| Industry | F500 HQs | Revenue |
|---|---|---|
| Healthcare | 1 | $163B |
|
||
| Insurance | 1 | $21B |
|
||
| Industrial Technology | 1 | $17B |
|
||
| Retail | 1 | $16B |
|
||
| Industrial Distribution | 1 | $10B |
|
||
| Utilities | 1 | $9B |
|
||
Price history
-5.0% since first listed3 events — show timeline
- 2026-05-11 Pending — MARIS as Distributed by MLS Grid
- 2026-05-05 Price Changed $475,000 MARIS as Distributed by MLS Grid
- 2026-04-06 Listed $500,000 MARIS as Distributed by MLS Grid
Cash-flow waterfall
monthlySold comps — $/sqft
last 12 mo · ≤1 miLoading sold comps…