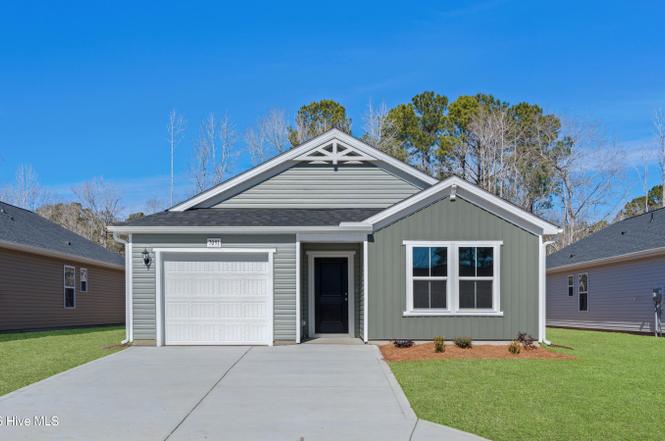
7091 Woodline Dr SW · Sunset Beach, NC
Flood risk No data
- FEMA flood zone
- —
- Chance of flooding over 30 yrs
- —
- Est. flood insurance / yr
- —
Fire risk No data
- Est. fire insurance / yr
- —
Heat risk No data
- Hot days now (above threshold)
- —
- Hot days in 30 yrs
- —
Wind risk No data
- Chance of severe wind over 30 yrs
- —
Air-quality risk No data
- Unhealthy air days now
- —
- Unhealthy air days in 30 yrs
- —
Risk factors via First Street. Map © Google.
Why this score? — see what drove the D- grade
The composite is a weighted blend of 9 inputs, each scored 0–100. Each bar is that input's sub-score; the figure is the points it added to the 100-point composite (weight × sub-score).
- Cash flow +11.5/30.0
- ARV discount +5.7/15.0
- Schools +3.9/10.0
- 1% rule +3.6/10.0
- DSCR +3.4/10.0
- Livability +3.3/5.0
- Rent growth +2.5/5.0
- Condition / age +2.5/5.0
- Appreciation +0.0/10.0
$269,990
🖨 Deal sheet 📄 Offer letter ✓ Due diligence
Listing remarks
Discover the Vantage plan! This traditional three bedroom, two bath ranch is a beautiful home boasting clean lines and an open concept. The kitchen features granite countertops, a large kitchen island and stainless appliances - Electric Range, Over the range Microwave oven, and dishwasher. The Owner's Suite has a double vanity with quartz countertops and a large walk-in closet. Relax in the evenings or grill outside on your back patio. Located centrally between Sunset Beach and Ocean Isle Beach, you can be at either beach within minutes. In addition, there is a marina & yacht club nearby.
Key facts
- Large kitchen island
- Double vanity
- Walk-in closet
Tags
Neighborhood map
What this means for you Summary
Snapshot
- This is a 3-bed/2.0-bath single-family listed at $270k.
Deal economics
- At list price, monthly cash flow is $-87 ($-1k/yr) — negative.
- To cash-flow at today's rent, offer at most $257k (4.7% below list).
- To meet the 1% rule (rent ≥ 1% of price), the offer needs to be $231k (14.5% below list).
- Recommended offer: $231k (14.5% below list) — sets the bar for 1% rule.
- Cap rate 5.9% vs local median 2.3% in Sunset Beach — top-decile yield for the area; either an underpriced asset or a hidden risk that comps aren't pricing in. Stress-test before assuming the spread holds.
Location & tenants
- Location reads 66/100 on livability (#257 in NC) — a middle-class / working-renter tenant base. Strengths: crime A+, housing B+, cost of living B; Watch: health & safety D, amenities F, commute F.
- Brunswick County Schools (rural): math 45% / reading 47% proficiency, ranked #82 of 178 in NC (top 46%) — families likely to look elsewhere, expect single-tenant / working-renter base with shorter leases.
- Zoned schools: Jessie Mae Monroe Elementary (math 43% / reading 41%, grade F, #633 of 1,410 statewide, top 48%, 394 students, 99% FRL); Shallotte Middle (math 40% / reading 50%, grade D, #160 of 475 statewide, top 35%, 674 students, 100% FRL); West Brunswick High (math 50% / reading 56%, grade C-, #281 of 535 statewide, top 53%, 1,526 students, 100% FRL) — zoned schools average 100% FRL vs 53% district-wide (46 pts higher); higher-poverty schools than district average — tighter screening recommended.
- Market conditions: 362 active listings in the ZIP; 2 comparable units currently listed for rent nearby; solid renter incomes; 6,112 units permitted in Brunswick County in 2024 (990 in 5+ unit buildings).
- This rent runs 33% of the median local income ($83k/yr) — at the standard rent-burdened threshold; future hikes will face affordability resistance.
Forward outlook
- Local home prices are declining (-3.0%/yr); year-one equity from $2k of loan paydown is wiped out by about $8k of value loss. Plan a longer hold.
- Brunswick County population projected at +36% by 2050 — long-run rental-demand tailwind backs the buy-and-hold thesis.
Negotiation context
- It's been on market 80 days — a 6% lower offer ($254k) is reasonable based on typical stale-listing flexibility.
Questions for the listing agent
- What do current leases actually rent for vs. the listed asking? Can we see a recent rent roll and the last 12 months of T-12 income?
- It's been on market 80 days. Have you received any prior offers? Is the seller open to a 14% concession, seller financing, or rate buy-down credit?
- What does the HOA fee cover, when was the last increase, and are there any pending special assessments or reserve-fund shortfalls?
- Why hasn't it sold? Are there any deal-killer items the seller is aware of (foundation, flood, title, zoning, code violations)?
- Is there a deadline driving the sale (1031 exchange, divorce, estate, relocation)? That informs how much negotiation room exists.
- The area grade is low — what's the realistic commute time and amenity access for the typical tenant pool here? Any planned neighborhood developments (good or bad) we should know about?
- What's the average days-on-market for RENTAL listings here right now (not sales)? A rising rental-DOM trend means longer vacancies and softer asking-rent achievability than the comps imply.
- What's the recent tenant-quality profile in this submarket — average credit score on applications, eviction rate, late-payment / NSF rate, and stable-employment percentage? A property-management company in the area should have these aggregated.
- How much new for-sale + rental construction is in the pipeline within 1–3 miles? Heavy new supply typically softens prices + rents 12–24 months out; constrained supply supports both.
Investment metrics
- 1% rule
- 0.86% ✗
- Cap rate
- 5.91%
- Cash-on-cash
- -1.38%
- DSCR
- 0.94
- GRM
- 9.7
CMA / ARV
- ARV (on-the-fly)
- $259,749
- Comps found
- 12
Show comp detail 12 sales within ~0.75 mi
| Address | Dist | Beds/Ba | Sqft | Sold | Price | $/sf | Match |
|---|---|---|---|---|---|---|---|
| 7091 Woodline Dr SW | 0.00mi | 3/2.0 | 1,519 (0%) | 1mo | $265,000 | $174 | 99 |
| 272 Mandolin Ct SW | 0.03mi | 3/2.0 | 1,519 (0%) | 1mo | $259,990 | $171 | 98 |
| 6998 Seaside Palms Pl SW | 0.03mi | 3/2.0 | 1,519 (0%) | 1mo | $249,000 | $164 | 98 |
| 7118 Woodline Dr SW | 0.08mi | 3/2.0 | 1,519 (0%) | 3mo | $264,990 | $174 | 94 |
| 6986 Seaside Palms Pl SW | 0.06mi | 3/2.0 | 1,519 (0%) | 10mo | $290,990 | $192 | 89 |
| 6970 Seaside Palms Pl SW | 0.09mi | 3/2.5 | 1,470 (-3%) | 7mo | $240,990 | $164 | 83 |
| 7099 Woodline Dr SW | 0.02mi | 3/2.0 | 1,725 (+14%) | 1mo | $290,000 | $168 | 75 |
| 7079 Woodline Dr SW | 0.03mi | 3/2.0 | 1,725 (+14%) | 2mo | $270,000 | $157 | 75 |
| 7001 Seaside Palms Pl SW | 0.04mi | 3/2.0 | 1,725 (+14%) | 7mo | $319,990 | $186 | 70 |
| 284 Mandolin Ct SW | 0.06mi | 3/2.0 | 1,725 (+14%) | 8mo | $306,000 | $177 | 68 |
| 6978 Seaside Palms Pl SW | 0.07mi | 3/2.0 | 1,725 (+14%) | 11mo | $286,990 | $166 | 65 |
| 6918 Seaside Palms Pl SW | 0.20mi | 3/2.0 | 1,725 (+14%) | 10mo | $269,490 | $156 | 59 |
Match score weights: distance 35% · size 25% · config 20% · recency 20%. Top-matched comps best support the ARV.
Projected returns pro-forma
-3.0% appreciation · 3.0% rent growth · sell at horizon
- IRR
- -18.5%
- Equity multiple
- 0.35×
- Total profit
- $-49,219
- Equity at exit
- $40,256
- IRR
- -10.9%
- Equity multiple
- 0.34×
- Total profit
- $-49,728
- Equity at exit
- $23,344
Cash invested: $75,597 (down + closing). Projections, not guarantees.
Landlord ↔ Tenant lean methodology
- Overall (STATE)
- 85 Strongly Landlord-Friendly
- State North Carolina
- 85 Strongly Landlord-Friendly · R+3
- County
- — inherits STATE
- City
- — inherits STATE
ZIP-level market 28468
- Active inventory
- 362
- Price-to-rent
- 9.7×
Monthly cashflow live
- Estimated rent
- $2,309 medium interval (Pro) →
- Mortgage (P&I)
- −$1,416
- Tax est. 1.5%
- −$337 /mo · $4,050/yr
- Insurance
- −$112
- HOA
- −$45
- Vacancy / Maint / Mgmt
- −$485
- Net cashflow
- $-87
Break-even live
UW: 25.0% down · 7.5% · 30yr · 1.5% tax · 5.0% vac · 8.0% maint · 8.0% mgmt
Financing live
Cash to close
- Down payment
- $67,498
- Closing costs
- $8,100
- Reserves months
- —
- Total cash needed
- —
Loan-product check · same deal, 3 products live
Conventional
25% down · 7.5% · 30yr
- Down + closing
- —
- Monthly P&I
- —
- Monthly cashflow
- —
- DSCR
- —
- Eligible?
- —
Personal DTI + credit; lowest rate.
DSCR
20% down · 8.5% · 30yr
- Down + closing
- —
- Monthly P&I
- —
- Monthly cashflow
- —
- DSCR
- —
- Eligible?
- —
No personal income docs; deal must DSCR.
Hard money
10% down · 12.0% · 12mo
- Down + closing
- —
- Monthly P&I
- —
- Monthly cashflow
- —
- DSCR
- —
- Eligible?
- —
Short-term bridge; refi at stabilization.
Rent comps 2 comps
| Address | Beds | Baths | Sqft | Rent | $/sqft | DOM | Units | Dist |
|---|---|---|---|---|---|---|---|---|
| 7091 Woodline Dr Sunset Beach, NC | 3.0 | 2.0 | 1519 | $2,400 | $1.58 | 14d | 1 | 0.01mi |
| 1956 Sparrowstar Way SW Shallotte, NC | 1.0–2.0 | 1.5–2.5 | 1182 | $1,830 | $1.55 | 23d | 12 | 1.48mi |
HOA detail
- Monthly dues
- $45 · $540/yr
- Likely covers
- electric
Listing history 6 events
-
2026-04-20status Pending
-
2026-04-14price $269,990
-
2026-04-06price $279,990
-
2026-02-13price $289,990
-
2026-02-08price $299,990
-
2026-01-30$305,360 Active
ⓘ Source: listings_history table (triggers on properties + properties_extension) + one-shot
backfill from property_details.listing_events for pre-trigger history.
Nearby sold comps map
Loading sold comps map…
Walkable amenities ~0.75 mi
Loading nearby amenities…
Taxation est. · year 1
- Rental income
- $27,706
- − Mortgage interest
- −$15,124
- − Property taxes
- −$4,050
- − Insurance
- −$1,350
- − Repairs & maintenance
- −$2,216
- − Management
- −$2,216
- − HOA
- −$540
- − Depreciation
- −$7,854
- Taxable loss
- −$5,644
- Est. tax savings @ 24.0%
- +$1,355
- After-tax cash flow
- $312/yr
For passive investors: Depreciation is non-cash, so a rental often shows a tax loss while cash-flowing — sheltering income. Rental losses are passive: they offset passive income freely, and up to $25,000/yr can offset ordinary (W-2) income if you actively participate and your MAGI is under $100k (phasing out to $0 by $150k); unused losses carry forward. On sale, claimed depreciation is recaptured at up to 25%, and gains may owe capital-gains tax (a 1031 exchange can defer both). Figures are a year-1 estimate at your 24.0% rate — not tax advice; consult a CPA.
Schools (NCES district)
- District
- Brunswick County Schools
- NCES district ID
- 3700420
- Math proficiency
- 45% ▲ 4.00%
- Reading proficiency
- 47% ▲ 4.00%
- Median HH income
- $47,494
- Composite
- 39.23/100
- National rank
- #4011
- State rank
- #82 of 178 in NC
Livability — Sunset Beach
- Score
- 66/100
- State rank
- #257
- US rank
- #11344
Category grades
Schools grade is shown separately in the Schools card above.
Census & demographics
- County
- Brunswick County · 131,536 people
- City population
- 5,154
- Metro
- Myrtle Beach-Conway-North Myrtle Beach, SC-NC
- Population (ZIP)
- 5,154
- Household income
- $83,358
- Rent vs Own
- Severe rent burden
- 80.0
Population outlook (Brunswick County) Hauer SSP2
- Today (2025)
- 152,111 people
- By 2030
- 165,705 · +8.9%
- By 2040
- 188,494 · +23.9%
- By 2050
- 206,228 · +35.6%
- By 2075
- 237,876 · +56.4%
- By 2100
- 251,451 · +65.3%
Race, ethnicity, and origin ACS 2023
- Neighborhood character
- Predominantly White (88%)
- Race & ethnicity
- White 88% Black 5% Two or more races 4% Hispanic / Latino 2% Asian 1%
- Common ancestry
- Serbian 4% Lithuanian 4% Slovak 4%
- Foreign-born
- 4% · Canada, China
- Languages at home
- 97% English-only · French/Haitian/Cajun 1% Spanish 1%
Political lean MEDSL · Brunswick
- 2024 margin
- Strong R (+24.9) · D 37.2% · R 62.0%
- 2008→2024 swing
- -6.9pp toward R · 2008: -17.9pp · 2024: -24.9pp
- All cycles
- 2024: R+24.9 2020: R+25.0 2016: R+28.7 2012: R+22.2 2008: R+17.9
Not yet ingested
- Civics
- —
Market trends
- HPI YoY
- ▼ -259.35%
- Current HPI
- 124.6475
- Rent YoY
- —
- Metro
- Myrtle Beach-Conway-North Myrtle Beach, SC-NC
- State GDP YoY
- ▲ 3.28%
- F500 in state
- 26
Industry mix (Fortune 500 HQ in NC)
| Industry | F500 HQs | Revenue |
|---|---|---|
| Financial Services | 2 | $213B |
|
||
| Retail | 2 | $95B |
|
||
| Industrial Conglomerate | 1 | $38B |
|
||
| Metals / Steel | 1 | $35B |
|
||
| Utilities | 1 | $30B |
|
||
| Industrial Machinery | 1 | $19B |
|
||
Price history
-11.6% since first listed6 events — show timeline
- 2026-04-20 Pending — Hive MLS
- 2026-04-14 Price Changed $269,990 Hive MLS
- 2026-04-06 Price Changed $279,990 Hive MLS
- 2026-02-13 Price Changed $289,990 Hive MLS
- 2026-02-08 Price Changed $299,990 Hive MLS
- 2026-01-30 Listed $305,360 Hive MLS
Cash-flow waterfall
monthlySold comps — $/sqft
last 12 mo · ≤1 miLoading sold comps…