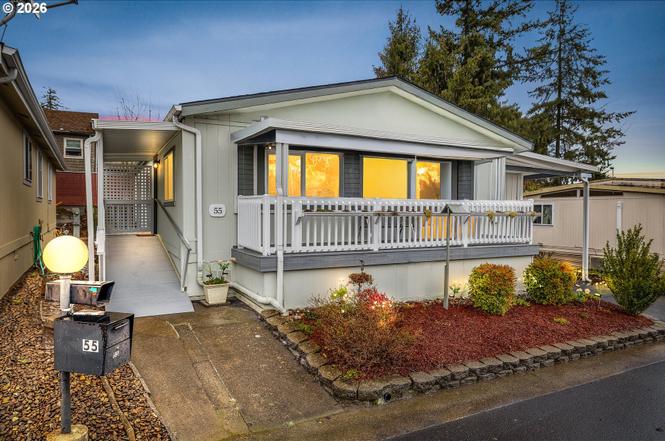
3500 SE Concord Rd #55 · Oak Grove, OR
Flood risk 1/10 · Minimal
- FEMA flood zone
- X (unshaded)
- Chance of flooding over 30 yrs
- 0.0%
- Est. flood insurance / yr
- $507 – $1,088
Fire risk 1/10 · Minimal
- Est. fire insurance / yr
- $498 – $926
Heat risk 3/10 · Minor
- Hot days now (above 94°F)
- 7 days/yr
- Hot days in 30 yrs
- 15 days/yr
Wind risk 1/10 · Minimal
- Chance of severe wind over 30 yrs
- —
Air-quality risk 10/10 · Severe
- Unhealthy air days now
- 18 days/yr
- Unhealthy air days in 30 yrs
- 20 days/yr
Risk factors via First Street. Map © Google.
Why this score? — see what drove the B- grade
The composite is a weighted blend of 9 inputs, each scored 0–100. Each bar is that input's sub-score; the figure is the points it added to the 100-point composite (weight × sub-score).
- Cash flow +30.0/30.0
- DSCR +10.0/10.0
- 1% rule +7.9/10.0
- ARV discount +7.5/15.0
- Livability +4.2/5.0
- Schools +3.2/10.0
- Rent growth +2.7/5.0
- Condition / age +2.5/5.0
- Appreciation +0.0/10.0
$139,900
🖨 Deal sheet (PDF) 📄 Offer letter ✓ Due diligence
Listing remarks
Meticulously maintained home offering abundant storage and is move-in ready. Enjoy newer composite decking, a shed, multiple exterior service outlets, and vaulted ceilings. Built with sturdy 2"x6" exterior wall studs, the roof has been well maintained. A newer front entrance ramp, washer and dryer, and open floor plan enhance the appeal. The home features 1,187 sqft, a primary en suite, second bedroom, updated windows, covered composite deck, covered carport and patio. The rec room includes extra washers and dryers, pool table, piano, and more. Conveniently located near shopping, dining, parks, and public transportation. Home Warranty Included. This is truly a MUST-SEE!
Key facts
- Open floor plan
- Updated windows
- Covered carport
Tags
Property features AI
Finance
- Other: Land lease expires December 31, 2026
- Financial info: Monthly lot rent applies
- HOA & community: Located in Concord Terrace park; Senior community; Land lease (monthly lot rent)
Exterior
- Parking: Carport and driveway
- Security: Security lights
- Utilities: Public water; Public sewer; Electric service
- Home design: Manufactured home in a park (residential); Not attached; Resale condition; Home warranty included; Built in 1991; Main living area on a single level; Foundation on pillar/post/pier
- Construction: Composition roof; Manufacturer: Golden West Homes
- Exterior features: Covered deck and covered patio; Patio and tool shed; Wood composite exterior; Level lot; Concrete and paved road access; Mountain and trees/woods views
Interior
- Kitchen: Dishwasher; Built-in oven; Free-standing range; Free-standing refrigerator; Disposal
- Bedrooms: Primary bedroom on main level with attached bathroom and closet; Second bedroom on main level with closet
- Flooring: Laminate flooring in kitchen, dining and other areas; Wall-to-wall carpet in bedrooms and living areas
- Bathrooms: Two full bathrooms, both on the main level; Primary bath features bathtub with shower
- Heating & cooling: Forced air heating; Heat pump cooling; Electric hot water
- Interior features: One-level living with minimal steps and accessible approach (ramp); Accessible bathroom and kitchen cabinets; Laundry area with washer/dryer; Laminate flooring and wall-to-wall carpet; Vinyl window frames; Vaulted ceiling in living room
- Laundry & utility: Main-level laundry with washer and dryer
Neighborhood map
What this means for you Summary
Snapshot
- This is a 2-bed/2.0-bath single-family listed at $140k.
Deal economics
- At list price, monthly cash flow is $562 ($7k/yr) — positive.
- The deal already cash-flows at list — no discount required.
- Meets the 1% rule at list price ($2k rent vs $140k).
- Recommended offer: $136k (3.0% below list) — sets the bar for market timing.
- Cap rate 11.1% vs local median 2.6% in Oak Grove — top-decile yield for the area; either an underpriced asset or a hidden risk that comps aren't pricing in. Stress-test before assuming the spread holds.
Location & tenants
- Location reads 84/100 on livability (#37 in OR, #832 nationally) — a professional / high-income tenant draw. Strengths: amenities A+, commute A+, health & safety A+; Watch: cost of living F.
- North Clackamas SD 12 (suburban): math 29% / reading 43% proficiency, ranked #22 of 58 in OR (top 38%) — families likely to look elsewhere, expect single-tenant / working-renter base with shorter leases.
- Zoned schools: Riverside Elementary School (math 15% / reading 24%, grade F, #366 of 412 statewide, top 91%, 331 students, 70% FRL); Alder Creek Middle School (math 13% / reading 36%, grade F, #108 of 128 statewide, top 89%, 846 students, 49% FRL); Putnam High School (math 34% / reading 74%, grade C-, #30 of 143 statewide, top 20%, 1,106 students, 38% FRL) — zoned schools average 53% FRL vs 34% district-wide (18 pts higher); higher-poverty schools than district average — tighter screening recommended.
- Market conditions: Rents flat; 176 active listings in the ZIP; 33 comparable units currently listed for rent nearby; rentals at typical pace (median 23d on market — plan ~3-4 weeks tenant-placement turnaround); solid renter incomes; 946 units permitted in Clackamas County in 2024 (188 in 5+ unit buildings).
Forward outlook
- Local home prices are declining (-3.0%/yr); year-one equity from $967 of loan paydown is wiped out by about $4k of value loss. Plan a longer hold.
- Clackamas County population projected at +25% by 2050 — long-run rental-demand tailwind backs the buy-and-hold thesis.
- At projected returns (-3.0% appreciation + 0.8% rent growth), your $39k cash investment doubles in ~9 years — after that, you're playing with house money.
Negotiation context
- It's been on market 56 days — a 3% lower offer ($136k) is reasonable based on typical stale-listing flexibility.
- 2 sale attempts with the ask held roughly flat each time — persistent listings suggest the price (not the market) is what's stuck; bring a comps-based counter.
Questions for the listing agent
- It's been on market 56 days. Have you received any prior offers? Is the seller open to a 3% concession, seller financing, or rate buy-down credit?
- Is there a deadline driving the sale (1031 exchange, divorce, estate, relocation)? That informs how much negotiation room exists.
- What's the average days-on-market for RENTAL listings here right now (not sales)? A rising rental-DOM trend means longer vacancies and softer asking-rent achievability than the comps imply.
- What's the recent tenant-quality profile in this submarket — average credit score on applications, eviction rate, late-payment / NSF rate, and stable-employment percentage? A property-management company in the area should have these aggregated.
- How much new for-sale + rental construction is in the pipeline within 1–3 miles? Heavy new supply typically softens prices + rents 12–24 months out; constrained supply supports both.
Investment metrics
- 1% rule
- 1.29% ✓
- Cap rate
- 11.11%
- Cash-on-cash
- 17.21%
- DSCR
- 1.77
- GRM
- 6.5
CMA / ARV
- ARV (on-the-fly)
- $460,556
- Comps found
- 12
Show comp detail 12 sales within ~0.75 mi
| Address | Dist | Beds/Ba | Sqft | Sold | Price | $/sf | Match |
|---|---|---|---|---|---|---|---|
| 3227 SE Westview Ave | 0.10mi | 3/1.0 (+1) | 1,206 (+2%) | 11mo | $440,000 | $365 | 75 |
| 3886 SE Sunset Ct | 0.46mi | 3/2.0 (+1) | 1,144 (-4%) | 2mo | $437,500 | $382 | 65 |
| 15314 SE Linden Ln | 0.59mi | 3/2.0 (+1) | 1,172 (-1%) | 3mo | $500,000 | $427 | 63 |
| 16470 SE Sterling Cir | 0.35mi | 3/1.0 (+1) | 1,160 (-2%) | 11mo | $450,000 | $388 | 62 |
| 16010 SE Lisa Ln | 0.67mi | 3/2.0 (+1) | 1,200 (+1%) | 3mo | $498,000 | $415 | 59 |
| 14915 SE Kronberg Ave | 0.53mi | 2/2.0 | 1,251 (+5%) | 10mo | $400,000 | $320 | 58 |
| 15015 SE Linden Ln | 0.73mi | 2/2.0 | 1,228 (+4%) | 3mo | $463,000 | $377 | 58 |
| 15113 SE Oatfield Rd | 0.47mi | 3/2.0 (+1) | 1,246 (+5%) | 11mo | $490,000 | $393 | 55 |
| 16165 SE Harold Ave | 0.37mi | 3/2.0 (+1) | 1,312 (+10%) | 9mo | $370,000 | $282 | 53 |
| 2606 SE Risley Ave | 0.50mi | 3/2.0 (+1) | 1,287 (+8%) | 9mo | $549,000 | $427 | 50 |
| 4615 SE Roethe Rd | 0.73mi | 3/1.0 (+1) | 1,222 (+3%) | 2mo | $440,000 | $360 | 50 |
| 16807 SE Berghammer St | 0.62mi | 3/2.0 (+1) | 1,291 (+9%) | 10mo | $510,000 | $395 | 43 |
Match score weights: distance 35% · size 25% · config 20% · recency 20%. Top-matched comps best support the ARV.
Projected returns pro-forma
-3.0% appreciation · 0.81% rent growth · sell at horizon
- IRR
- 6.2%
- Equity multiple
- 1.23×
- Total profit
- $9,195
- Equity at exit
- $20,860
- IRR
- 13.6%
- Equity multiple
- 1.99×
- Total profit
- $38,680
- Equity at exit
- $12,096
Cash invested: $39,172 (down + closing). Projections, not guarantees.
Landlord ↔ Tenant lean methodology
- Overall (STATE)
- 28 Tenant-Leaning
- State Oregon
- 28 Tenant-Leaning · D+6
- County
- — inherits STATE
- City
- — inherits STATE
ZIP-level market 97267
- Rents YoY
- 0.8%
- Active inventory
- 176
- Price-to-rent
- 6.5×
Monthly cashflow live
- Estimated rent
- $1,801 high interval (Pro) →
- Mortgage (P&I)
- −$734
- Tax from tax record
- −$69 /mo · $832/yr
- Insurance
- −$58
- HOA
- −$0
- Vacancy / Maint / Mgmt
- −$378
- Net cashflow
- $562
Break-even live
Sensitivity live
| Price | -10% $641 | -5% $601 | +0% $562 | +5% $522 | +10% $483 |
|---|---|---|---|---|---|
| Rent | -10% $420 | -5% $491 | +0% $562 | +5% $633 | +10% $704 |
| Rate | -1.0pp $632 | -0.5pp $597 | base $562 | +0.5pp $526 | +1.0pp $489 |
UW: 25.0% down · 7.5% · 30yr · 1.5% tax · 5.0% vac · 8.0% maint · 8.0% mgmt
Financing live
Cash to close
- Down payment
- $34,975
- Closing costs
- $4,197
- Reserves months
- —
- Total cash needed
- —
Loan-product check · same deal, 3 products live
Conventional
25% down · 7.5% · 30yr
- Down + closing
- —
- Monthly P&I
- —
- Monthly cashflow
- —
- DSCR
- —
- Eligible?
- —
Personal DTI + credit; lowest rate.
DSCR
20% down · 8.5% · 30yr
- Down + closing
- —
- Monthly P&I
- —
- Monthly cashflow
- —
- DSCR
- —
- Eligible?
- —
No personal income docs; deal must DSCR.
Hard money
10% down · 12.0% · 12mo
- Down + closing
- —
- Monthly P&I
- —
- Monthly cashflow
- —
- DSCR
- —
- Eligible?
- —
Short-term bridge; refi at stabilization.
Rent comps 33 comps
| Address | Beds | Baths | Sqft | Rent | $/sqft | DOM | Units | Dist |
|---|---|---|---|---|---|---|---|---|
| 3624 SE Westview Ave Portland, OR | 3.0 | 2.0 | 1052 | $1,950 | $1.85 | 16d | 2 | 0.08mi |
| 3416 SE Vineyard Rd Oak Grove, OR | 2.0 | 1.0 | 1100 | $1,600 | $1.45 | 0d | 1 | 0.24mi |
| 3412 SE Vineyard Rd Unit 1 Milwaukie, OR | 2.0 | 2.0 | 1400 | $1,950 | $1.39 | 18d | 1 | 0.26mi |
| 15500 SE East Ave Unit 15530 Oak Grove, OR | 2.0 | 1.5 | 900 | $1,450 | $1.61 | 23d | 1 | 0.35mi |
| 15318 SE Risley Ct Milwaukie, OR | 2.0 | 1.0 | 1100 | $2,395 | $2.18 | 13d | 1 | 0.36mi |
| 4400 SE Naef Rd Portland, OR | 1.0 | 1.0 | 717 | $1,350 | $1.88 | 25d | 1 | 0.55mi |
| 4400 SE Naef Rd Portland, OR | 1.0 | 1.0 | 717 | $1,375 | $1.92 | 0d | 9 | 0.55mi |
| 4400 SE Naef Rd Unit F30 Milwaukie, OR | 2.0 | 2.0 | 1010 | $1,620 | $1.60 | 25d | 1 | 0.56mi |
| 4400 SE Naef Rd Apt B22 Milwaukie, OR | 1.0 | 1.0 | 717 | $1,385 | $1.93 | 25d | 1 | 0.56mi |
| 15607 SE Meadowlark Ln Portland, OR | 3.0 | 2.5 | 1336 | $2,695 | $2.02 | 23d | 1 | 0.58mi |
| 4545 SE Ina Ave Portland, OR | 2.0 | 1.0 | 900 | $1,495 | $1.66 | 3d | 1 | 0.86mi |
| 3025 SE Maple St Unit 4 Portland, OR | 2.0 | 1.0 | 900 | $1,695 | $1.88 | 9d | 1 | 0.87mi |
| 3025 SE Maple St Portland, OR | 2.0 | 1.0 | 900 | $1,695 | $1.88 | 0d | 1 | 0.87mi |
| 15303 SE Lee Ave Portland, OR | 3.0 | 1.0 | 1398 | $2,795 | $2.00 | 45d | 1 | 0.87mi |
| 4713 SE Ina Ave Portland, OR | 3.0 | 1.5 | 1300 | $2,395 | $1.84 | 9d | 1 | 0.89mi |
| 4520 SE Ina Ave Apt 6 Portland, OR | 1.0 | 1.0 | 775 | $1,399 | $1.81 | 45d | 1 | 0.91mi |
| 4807 SE Boardman Ave Unit 2 Portland, OR | 3.0 | 1.0 | 986 | $1,895 | $1.92 | 45d | 1 | 0.97mi |
| 4803 SE Boardman Ave Milwaukie, OR | 3.0 | 1.0 | 986 | $1,895 | $1.92 | 45d | 1 | 1.00mi |
| 4803 SE Boardman Ave Unit 0702 Milwaukie, OR | 3.0 | 1.0 | 986 | $1,895 | $1.92 | 25d | 1 | 1.00mi |
| 4800 SE Boardman Ave Apt 6 Milwaukie, OR | 2.0 | 1.0 | 830 | $1,595 | $1.92 | 5d | 1 | 1.03mi |
| 3190 Furman Dr Lake Oswego, OR | 1.0–2.0 | 1.0 | 648 | $1,554 | $2.40 | 45d | 1 | 1.04mi |
| 14832 SE Cedar Ave Unit 3 Milwaukie, OR | 2.0 | 1.0 | 850 | $1,395 | $1.64 | 13d | 1 | 1.07mi |
| 13822 SE Oatfield Rd Unit 3C Milwaukie, OR | 3.0 | 2.5 | 1385 | $2,595 | $1.87 | 18d | 1 | 1.11mi |
| 2600 SE Courtney Ave Portland, OR | 1.0 | 1.0 | 600 | $1,378 | $2.30 | 25d | 3 | 1.15mi |
| 18101 SE Arista Dr Apt 5 Milwaukie, OR | 2.0 | 1.0 | 800 | $1,695 | $2.12 | 16d | 1 | 1.20mi |
| 17966 SE Addie St Portland, OR | 2.0 | 1.0 | 850 | $1,500 | $1.76 | 45d | 1 | 1.23mi |
| 14020 SE Arista Dr Portland, OR | 2.0 | 1.5 | 970 | $1,900 | $1.96 | 0d | 1 | 1.23mi |
| 2301 SE Courtney Ave Unit 10 Oak Grove, OR | 2.0 | 1.0 | 962 | $1,295 | $1.35 | 25d | 1 | 1.25mi |
| 2295 SE Courtney Ave Portland, OR | 1.0 | 1.0 | 727 | $1,195 | $1.64 | 4d | 1 | 1.27mi |
| 2295 SE Courtney Ave Portland, OR | 2.0 | 1.0 | 962 | $1,295 | $1.35 | 25d | 1 | 1.27mi |
| 2311 SE Courtney Ave Portland, OR | 2.0 | 1.5 | 1000 | $1,795 | $1.79 | 25d | 1 | 1.28mi |
| 13500 SE Linden Ln Portland, OR | 2.0 | 1.0 | 750 | $1,500 | $2.00 | 25d | 1 | 1.36mi |
| 18484 SE Abernethy Ln Portland, OR | 2.0 | 1.5 | 1100 | $1,440 | $1.31 | 3d | 1 | 1.48mi |
Listing history 11 events
-
2026-06-21days on market $139,900 Active 56 DOM
-
2026-06-18days on market $139,900 Active 53 DOM
-
2026-06-17days on market $139,900 Active 52 DOM
-
2026-06-16days on market $139,900 Active 51 DOM
-
2026-06-15days on market $139,900 Active 50 DOM
-
2026-06-13days on market $139,900 Active 48 DOM
-
2026-06-09days on market $139,900 Active 44 DOM
-
2026-06-08days on market $139,900 Active 43 DOM
-
2026-06-07days on market $139,900 Active 42 DOM
-
2026-06-05remarks 678-char remark
-
2026-06-05$139,900 Active 39 DOM
ⓘ Source: listings_history table (triggers on properties + properties_extension) + one-shot
backfill from property_details.listing_events for pre-trigger history.
Tax reassessment forecast OR · Resets to sale price
- Current annual tax
- $832 · $69/mo
- Projected year-2 tax
- $1,357 · $113/mo
- Expected delta
- +$525/yr (+$44/mo · 63.2%)
ⓘ Screening estimate from a state-policy table — verify with the county assessor before closing.
Climate risk First Street
- Flood 1/10 Low FEMA zone X (unshaded) · 0% chance over 30 yrs
- Wildfire 1/10 Low
- Heat 3/10 Moderate 7 d/yr ≥94°F today · 15 d/yr by 30 yrs out
- Wind 1/10 Low
- Air quality 10/10 Extreme 18 unhealthy d/yr today · 20 by 30 yrs out
Nearby sold comps map
Loading sold comps map…
Walkable amenities ~0.75 mi
Loading nearby amenities…
Taxation est. · year 1
- Rental income
- $21,617
- − Mortgage interest
- −$7,837
- − Property taxes
- −$832
- − Insurance
- −$700
- − Repairs & maintenance
- −$1,729
- − Management
- −$1,729
- − Depreciation
- −$4,070
- Taxable income
- $4,721
- Est. tax owed @ 24.0%
- −$1,133
- After-tax cash flow
- $5,610/yr
For passive investors: Depreciation is non-cash, so a rental often shows a tax loss while cash-flowing — sheltering income. Rental losses are passive: they offset passive income freely, and up to $25,000/yr can offset ordinary (W-2) income if you actively participate and your MAGI is under $100k (phasing out to $0 by $150k); unused losses carry forward. On sale, claimed depreciation is recaptured at up to 25%, and gains may owe capital-gains tax (a 1031 exchange can defer both). Figures are a year-1 estimate at your 24.0% rate — not tax advice; consult a CPA.
Schools (NCES district)
- District
- North Clackamas SD 12
- NCES district ID
- 4108830
- Math proficiency
- 29% ▼ -14.00%
- Reading proficiency
- 43% ▼ -13.00%
- Median HH income
- $60,217
- Composite
- 32.1/100
- National rank
- #5807
- State rank
- #22 of 58 in OR
Livability — Oak Grove
- Score
- 84/100
- State rank
- #37
- US rank
- #832
Category grades
Schools grade is shown separately in the Schools card above.
Census & demographics
- Census place
- Oak Grove, OR
- County
- Clackamas County · 361,406 people
- Metro
- Portland-Vancouver-Hillsboro, OR-WA
- Population (ZIP)
- 31,311
- Household income
- $87,418
- Rent vs Own
- Severe rent burden
- 1226.0
Population outlook (Clackamas County) Hauer SSP2
- Today (2025)
- 458,456 people
- By 2030
- 485,185 · +5.8%
- By 2040
- 532,932 · +16.2%
- By 2050
- 574,445 · +25.3%
- By 2075
- 665,497 · +45.2%
- By 2100
- 697,488 · +52.1%
Race, ethnicity, and origin ACS 2023
- Neighborhood character
- Predominantly White (78%)
- Race & ethnicity
- White 78% Hispanic / Latino 12% Two or more races 10% Asian 2% Native American 1%
- Hispanic origin (detail)
- Mexican 9%
- Common ancestry
- Portuguese 5% Lithuanian 4% Italian 3%
- Foreign-born
- 8% · Canada
- Languages at home
- 88% English-only · Spanish 7% Russian/Polish/Slavic 2% Other Indo-European 1%
Political lean MEDSL · Clackamas
- 2024 margin
- Lean D (+9.7) · D 53.4% · R 43.6% · Other 3.0%
- 2008→2024 swing
- -0.6pp no change · 2008: 10.4pp · 2024: 9.7pp
- All cycles
- 2024: D+9.7 2020: D+11.1 2016: D+6.1 2012: D+3.5 2008: D+10.4
Not yet ingested
- Civics
- —
Market trends
- HPI YoY
- ▼ -526.38%
- Current HPI
- 292.1818
- Rent YoY
- ▲ 0.81%
- Metro
- Portland-Vancouver-Hillsboro, OR-WA
- State GDP YoY
- ▲ 2.05%
- F500 in state
- 2
Industry mix (Fortune 500 HQ in OR)
| Industry | F500 HQs | Revenue |
|---|---|---|
| Consumer Goods | 1 | $51B |
|
||
Price history
2 events — show timeline
- 2026-06-04 Relisted — RMLS
- 2026-03-12 Listed $139,900 RMLS
Property tax history
+4.2%/yrLatest (2025): $832 · +3.7% YoY. Source: county tax records.
Cash-flow waterfall
monthlySold comps — $/sqft
last 12 mo · ≤1 miLoading sold comps…