 🌊 Lakefront
401 Lake Frances Dr #401 · West Palm Beach, FL
Flood risk 1/10 · Minimal
- FEMA flood zone
- X (unshaded)
- Chance of flooding over 30 yrs
- 0.0%
- Est. flood insurance / yr
- $507 – $1,088
Fire risk 5/10 · Moderate
- Est. fire insurance / yr
- $947 – $1,759
Heat risk 10/10 · Severe
- Hot days now (above 106°F)
- 7 days/yr
- Hot days in 30 yrs
- 26 days/yr
Wind risk 10/10 · Severe
- Chance of severe wind over 30 yrs
- 99.0%
Air-quality risk 2/10 · Minimal
- Unhealthy air days now
- 0 days/yr
- Unhealthy air days in 30 yrs
- 1 days/yr
Risk factors via First Street. Map © Google.
Why this score? — see what drove the C- grade
The composite is a weighted blend of 9 inputs, each scored 0–100. Each bar is that input's sub-score; the figure is the points it added to the 100-point composite (weight × sub-score).
- Cash flow +11.9/30.0
- Appreciation +10.0/10.0
- 1% rule +8.2/10.0
- ARV discount +7.5/15.0
- Schools +4.3/10.0
- Livability +4.1/5.0
- DSCR +3.5/10.0
- Rent growth +2.7/5.0
- Condition / age +2.5/5.0
$139,999
🖨 Deal sheet 📄 Offer letter ✓ Due diligence
Listing remarks
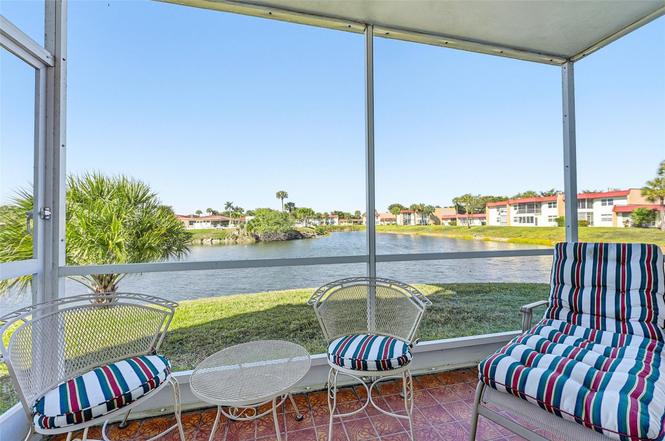
BACK ON MARKET!! REDUCED for Quick Sale! Serene Lakefront Living! Welcome to this charming & private FIRST FLOOR, CORNER LAKEFRONT CONDO featuring 2 Bedrooms/2 baths. Ideal for year-round living or a sunny winter retreat, this move-in ready residence offers a desirable split-bedroom floor plan, IMPACT windows and a private entry that enhances both comfort and privacy. Take in wonderful waterfront views from your living room, bedrooms or your serene private patio-an ideal setting for morning coffee, alfresco dining or enjoying sunsets over the lake. Located within Golden Lakes, a premier 55+ resort-style gated community, residents enjoy a refined lifestyle just minutes from Airport, Ci
Key facts
- Gated community
- Waterfront views
- Private patio
Tags
Property features AI
Finance
- HOA & community: Monthly HOA fee of $530; Association amenities include clubhouse, pool, shuffleboard court, community room, library, pickleball courts, and internet included; HOA covers insurance, grounds and structure maintenance, water, common areas, reserve funds, roof repairs, recreation facility, and pool service; Senior community
Exterior
- Parking: Assigned parking
- Security: Security guard; Key card entry
- Utilities: Water included in association; Electric service (electric heating and cooling)
- Home design: Condominium; Resale unit; 2-story building; First-floor entry
- Construction: Block construction
- Exterior features: Patio; Waterfront property (no specific waterfront features listed)
Interior
- Kitchen: Dishwasher; Electric range; Microwave; Refrigerator
- Bedrooms: 2 bedrooms (main level)
- Flooring: Laminate flooring; Tile flooring
- Bathrooms: 2 full bathrooms (main level)
- Heating & cooling: Central electric heating; Central air conditioning; Ceiling fans
- Interior features: Split bedroom layout
- Laundry & utility: Electric water heater
Neighborhood map
What this means for you Summary
Snapshot
- This is a 2-bed/2.0-bath condo listed at $140k.
Deal economics
- At list price, monthly cash flow is $-36 ($-437/yr) — negative.
- To cash-flow at today's rent, offer at most $135k (3.8% below list).
- Meets the 1% rule at list price ($2k rent vs $140k).
- Recommended offer: $127k (9.0% below list) — sets the bar for market timing.
Location & tenants
- Location reads 82/100 on livability (#75 in FL, #1,255 nationally) — a professional / high-income tenant draw. Strengths: commute A+, housing A+, health & safety A+; Watch: employment C-, crime F.
- Palm Beach (suburban): math 46% / reading 53% proficiency, ranked #34 of 73 in FL (top 47%) — families likely to look elsewhere, expect single-tenant / working-renter base with shorter leases.
- Zoned schools: Benoist Farms Elementary School (math 22% / reading 28%, grade F, #2,030 of 2,144 statewide, top 95%, 421 students, 80% FRL); Jeaga Middle School (math 18% / reading 30%, grade F, #532 of 571 statewide, top 94%, 941 students, 78% FRL); Royal Palm Beach High School (math 22% / reading 38%, grade F, #441 of 667 statewide, top 67%, 2,343 students, 57% FRL) — zoned schools average 72% FRL vs 52% district-wide (20 pts higher); higher-poverty schools than district average — tighter screening recommended.
- Zoned-school proficiency averages 26% at this address vs 50% district-wide (-23 pts) — the specific schools serving this property underperform the Palm Beach average; the district grade overstates school quality for this exact location.
- Market conditions: Rents flat; 574 active listings in the ZIP; 40 comparable units currently listed for rent nearby; rentals at typical pace (median 21d on market — plan ~3-4 weeks tenant-placement turnaround); solid renter incomes; 3,974 units permitted in Palm Beach County in 2024 (1,012 in 5+ unit buildings).
Forward outlook
- In year one you build about $15k of equity ($968 loan paydown + $14k appreciation (10.0% local appreciation)).
- Palm Beach County population projected at +30% by 2050 — long-run rental-demand tailwind backs the buy-and-hold thesis.
- At projected returns (10.0% appreciation + 0.8% rent growth), your $39k cash investment doubles in ~3 years — after that, you're playing with house money.
- By year 3, paydown + projected appreciation supports a ~$38k cash-out refi (75% LTV) — recoverable capital for the next deal without selling this one.
Negotiation context
- It's been on market 99 days — a 9% lower offer ($127k) is reasonable based on typical stale-listing flexibility.
- 2 sale attempts; this cycle's ask has dropped $35k (20%) from the opening price — seller is motivated, your offer sets the floor, not the list.
Risks & watch-outs
- Watch-outs: HOA is 29% of rent.
- Climate carrying-cost: severe wind risk, 99% chance of damaging wind over 30y; moderate wildfire risk; extreme-heat days projected 7→26/yr by 2055 (HVAC capex compounding) — expect insurance premiums to compound above CPI over the hold.
Questions for the listing agent
- What do current leases actually rent for vs. the listed asking? Can we see a recent rent roll and the last 12 months of T-12 income?
- It's been on market 99 days. Have you received any prior offers? Is the seller open to a 9% concession, seller financing, or rate buy-down credit?
- Built in 1978 — when were the roof, HVAC, electrical panel, plumbing, and water heater last replaced?
- What does the HOA fee cover, when was the last increase, and are there any pending special assessments or reserve-fund shortfalls?
- Any open or pending special assessments — roof, HVAC, plumbing, elevator, façade? What's the per-unit balance and payoff schedule, and is the seller paying it off at close or rolling it to the buyer?
- Why hasn't it sold? Are there any deal-killer items the seller is aware of (foundation, flood, title, zoning, code violations)?
- Is there a deadline driving the sale (1031 exchange, divorce, estate, relocation)? That informs how much negotiation room exists.
- Crime grade is F in this area — have there been break-ins, vandalism, or insurance claims at this property in the last 3 years? What carrier currently insures it and at what premium?
- This sits on a lake — are riparian / water-frontage rights deeded with the parcel? Any dock permits, shoreline easements, or HOA water-use restrictions?
- What's the documented flood / surge / shoreline-erosion history here (FEMA AND non-FEMA — e.g., storm surge, creek backup, septic-field saturation)?
- Any water-quality or seasonal algae-bloom issues that affect tenant satisfaction or short-term-rental demand?
- What's the average days-on-market for RENTAL listings here right now (not sales)? A rising rental-DOM trend means longer vacancies and softer asking-rent achievability than the comps imply.
- What's the recent tenant-quality profile in this submarket — average credit score on applications, eviction rate, late-payment / NSF rate, and stable-employment percentage? A property-management company in the area should have these aggregated.
- How much new apartment / multifamily construction is in the pipeline within 1–3 miles? Heavy new supply (>2% of stock underway) typically softens rents 12–24 months out; light construction supports rent growth.
Investment metrics
- 1% rule
- 1.32% ✓
- Cap rate
- 5.98%
- Cash-on-cash
- -1.12%
- DSCR
- 0.95
- GRM
- 6.3
CMA / ARV
No comps found within radius.
Projected returns pro-forma
10.0% appreciation · 0.85% rent growth · sell at horizon
- IRR
- 22.5%
- Equity multiple
- 2.80×
- Total profit
- $70,364
- Equity at exit
- $126,122
- IRR
- 19.5%
- Equity multiple
- 6.16×
- Total profit
- $202,467
- Equity at exit
- $271,987
Cash invested: $39,200 (down + closing). Projections, not guarantees.
Landlord ↔ Tenant lean methodology
- Overall (STATE)
- 87 Strongly Landlord-Friendly
- State Florida
- 87 Strongly Landlord-Friendly · R+3
- County
- — inherits STATE
- City
- — inherits STATE
ZIP-level market 33411
- Home prices YoY
- 1.9%
- Rents YoY
- 0.8%
- Active inventory
- 574
- Price-to-rent
- 6.3×
Monthly cashflow live
- Estimated rent
- $1,849 high interval (Pro) →
- Mortgage (P&I)
- −$734
- Tax est. 1.5%
- −$175 /mo · $2,100/yr
- Insurance
- −$58
- HOA
- −$530
- Vacancy / Maint / Mgmt
- −$388
- Net cashflow
- $-36
Break-even live
UW: 25.0% down · 7.5% · 30yr · 1.5% tax · 5.0% vac · 8.0% maint · 8.0% mgmt
Financing live
Cash to close
- Down payment
- $35,000
- Closing costs
- $4,200
- Reserves months
- —
- Total cash needed
- —
Loan-product check · same deal, 3 products live
Conventional
25% down · 7.5% · 30yr
- Down + closing
- —
- Monthly P&I
- —
- Monthly cashflow
- —
- DSCR
- —
- Eligible?
- —
Personal DTI + credit; lowest rate.
DSCR
20% down · 8.5% · 30yr
- Down + closing
- —
- Monthly P&I
- —
- Monthly cashflow
- —
- DSCR
- —
- Eligible?
- —
No personal income docs; deal must DSCR.
Hard money
10% down · 12.0% · 12mo
- Down + closing
- —
- Monthly P&I
- —
- Monthly cashflow
- —
- DSCR
- —
- Eligible?
- —
Short-term bridge; refi at stabilization.
Rent comps 40 comps
| Address | Beds | Baths | Sqft | Rent | $/sqft | DOM | Units | Dist |
|---|---|---|---|---|---|---|---|---|
| 230 Lake Dora Dr #230 West Palm Beach, FL | 2.0 | 2.0 | 888 | $1,700 | $1.91 | 7d | 1 | 0.07mi |
| 161 Lake Frances Dr Unit 161 West Palm Beach, FL | 1.0 | 1.5 | 704 | $1,430 | $2.03 | 7d | 1 | 0.09mi |
| 138 Lake Frances Dr West Palm Beach, FL | 2.0 | 2.0 | 812 | $1,845 | $2.27 | 24d | 1 | 0.12mi |
| 155 Lake Carol Dr Unit 155 West Palm Beach, FL | 2.0 | 2.0 | 812 | $1,950 | $2.40 | 24d | 1 | 0.28mi |
| 314 Lake Dora Dr West Palm Beach, FL | 2.0 | 2.0 | 888 | $1,650 | $1.86 | 20d | 1 | 0.33mi |
| 129 Lake Carol Dr #129 West Palm Beach, FL | 1.0 | 1.0 | 600 | $1,500 | $2.50 | 24d | 1 | 0.33mi |
| 228 Lake Dora Dr West Palm Beach, FL | 1.0 | 1.5 | 704 | $1,500 | $2.13 | 24d | 1 | 0.33mi |
| 228 Lake Dora Dr West Palm Beach, FL | 1.0 | 1.5 | 704 | $1,500 | $2.13 | 22d | 1 | 0.33mi |
| 173 Lake Dora Dr #173 West Palm Beach, FL | 1.0 | 1.5 | 704 | $1,400 | $1.99 | 24d | 1 | 0.33mi |
| 106 Lake Dora Dr West Palm Beach, FL | 2.0 | 2.0 | 812 | $1,600 | $1.97 | 24d | 1 | 0.33mi |
| 200 Lake Carol Dr West Palm Beach, FL | 2.0 | 2.0 | 888 | $1,750 | $1.97 | 24d | 1 | 0.33mi |
| 321 Lake Evelyn Dr West Palm Beach, FL | 2.0 | 2.0 | 888 | $1,600 | $1.80 | 24d | 1 | 0.33mi |
| 175 Lake Carol Dr #175 West Palm Beach, FL | 1.0 | 1.0 | 600 | $1,300 | $2.17 | 24d | 1 | 0.33mi |
| 235 Lake Dora Dr West Palm Beach, FL | 2.0 | 2.0 | 812 | $1,860 | $2.29 | 24d | 1 | 0.33mi |
| 108 Lake Nancy Dr West Palm Beach, FL | 2.0 | 2.0 | 967 | $1,800 | $1.86 | 24d | 1 | 0.34mi |
| 203 Lake Carol Dr West Palm Beach, FL | 1.0 | 1.0 | 600 | $1,500 | $2.50 | 24d | 1 | 0.35mi |
| 221 Lake Meryl Dr West Palm Beach, FL | 2.0 | 2.0 | 1000 | $1,550 | $1.55 | 24d | 1 | 0.35mi |
| 1542 Lake Crystal Dr Unit H West Palm Beach, FL | 2.0 | 2.0 | 900 | $1,900 | $2.11 | 22d | 1 | 0.36mi |
| 1542 Lake Crystal Dr Unit H West Palm Beach, FL | 2.0 | 2.0 | 900 | $1,900 | $2.11 | 24d | 1 | 0.36mi |
| 1564 Lake Crystal Dr Unit F West Palm Beach, FL | 2.0 | 2.0 | 904 | $1,850 | $2.05 | 17d | 1 | 0.37mi |
| 7130 Okeechobee Blvd West Palm Beach, FL | 1.0–3.0 | 1.0–2.0 | 1086 | $2,488 | $2.29 | 3d | 9 | 0.39mi |
| 1547 Lake Crystal Dr Unit A West Palm Beach, FL | 2.0 | 2.0 | 900 | $1,950 | $2.17 | 24d | 1 | 0.40mi |
| 1547 Lake Crystal Dr Unit A West Palm Beach, FL | 2.0 | 2.0 | 900 | $1,900 | $2.11 | 14d | 1 | 0.40mi |
| 1545 Lake Crystal Dr Unit D West Palm Beach, FL | 1.0 | 1.0 | 700 | $1,675 | $2.39 | 14d | 1 | 0.40mi |
| 1525 Lake Crystal Dr Unit C West Palm Beach, FL | 2.0 | 2.0 | 904 | $1,800 | $1.99 | 7d | 1 | 0.44mi |
| 1477 Lake Crystal Dr Unit D West Palm Beach, FL | 2.0 | 2.0 | 928 | $1,975 | $2.13 | 17d | 1 | 0.46mi |
| 1760 Windorah Way Unit H West Palm Beach, FL | 2.0 | 1.0 | 904 | $1,850 | $2.05 | 24d | 1 | 0.48mi |
| 1465 Lake Crystal Dr Unit A West Palm Beach, FL | 2.0 | 2.0 | 904 | $1,900 | $2.10 | 2d | 1 | 0.49mi |
| 1455 Lake Crystal Dr Unit H West Palm Beach, FL | 2.0 | 2.0 | 904 | $1,850 | $2.05 | 14d | 1 | 0.50mi |
| 1455 Lake Crystal Dr Unit H West Palm Beach, FL | 2.0 | 2.0 | 904 | $1,850 | $2.05 | 15d | 1 | 0.50mi |
| 1453 Lake Crystal Dr Unit D West Palm Beach, FL | 2.0 | 2.0 | 904 | $1,900 | $2.10 | 14d | 1 | 0.51mi |
| 1700 Windorah Way Unit A West Palm Beach, FL | 2.0 | 2.0 | 904 | $1,900 | $2.10 | 14d | 1 | 0.53mi |
| 1660 Windorah Way Unit H West Palm Beach, FL | 2.0 | 2.0 | 904 | $1,900 | $2.10 | 5d | 1 | 0.54mi |
| 1500 Windorah Way Unit D West Palm Beach, FL | 2.0 | 2.0 | 904 | $1,850 | $2.05 | 7d | 1 | 0.55mi |
| 1500 Windorah Way Unit D West Palm Beach, FL | 2.0 | 2.0 | 904 | $1,850 | $2.05 | 24d | 1 | 0.55mi |
| 1540 Windorah Way Unit D West Palm Beach, FL | 2.0 | 2.0 | 904 | $1,850 | $2.05 | 19d | 1 | 0.56mi |
| 1139 Lake Terry Dr Unit A West Palm Beach, FL | 3.0 | 2.0 | 918 | $2,300 | $2.51 | 20d | 1 | 0.58mi |
| 1440 Windorah Way Unit D West Palm Beach, FL | 2.0 | 2.0 | 904 | $1,900 | $2.10 | 4d | 1 | 0.60mi |
| 1701 Balfour Point Dr Unit G West Palm Beach, FL | 2.0 | 2.0 | 916 | $1,900 | $2.07 | 14d | 1 | 0.60mi |
| 1581 Windorah Way Unit A West Palm Beach, FL | 2.0 | 2.0 | 904 | $1,850 | $2.05 | 11d | 1 | 0.61mi |
HOA detail condo
- Monthly dues
- $530 · $6,360/yr
- Likely covers
- watersecurity
- Assessments
- None detected in remarks — confirm with the listing agent.
Listing history 18 events
-
2026-06-18days on market $139,999 Active 99 DOM
-
2026-06-17days on market $139,999 Active 98 DOM
-
2026-06-16days on market $139,999 Active 97 DOM
-
2026-06-15days on market $139,999 Active 96 DOM
-
2026-06-13days on market $139,999 Active 94 DOM
-
2026-06-09days on market $139,999 Active 90 DOM
-
2026-06-08days on market $139,999 Active 89 DOM
-
2026-06-07days on market $139,999 Active 88 DOM
-
2026-06-04days on market $139,999 Active 85 DOM
-
2026-06-03days on market $139,999 Active 84 DOM
-
2026-06-02days on market $139,999 Active 83 DOM
-
2026-06-01days on market $139,999 Active 82 DOM
-
2026-05-31days on market $139,999 Active 81 DOM
-
2026-05-02status Active
-
2026-05-02price $139,999
-
2026-04-06historical Active Under Contract
-
2026-03-26price $144,999
-
2026-02-02$174,999 Active
ⓘ Source: listings_history table (triggers on properties + properties_extension) + one-shot
backfill from property_details.listing_events for pre-trigger history.
Climate risk First Street
- Flood 1/10 Low FEMA zone X (unshaded) · 0% chance over 30 yrs
- Wildfire 5/10 Major
- Heat 10/10 Extreme 7 d/yr ≥106°F today · 26 d/yr by 30 yrs out
- Wind 10/10 Extreme 99% chance of damaging wind over 30 yrs
- Air quality 2/10 Low 0 unhealthy d/yr today · 1 by 30 yrs out
Nearby sold comps map
Loading sold comps map…
Walkable amenities ~0.75 mi
Loading nearby amenities…
Taxation est. · year 1
- Rental income
- $22,194
- − Mortgage interest
- −$7,842
- − Property taxes
- −$2,100
- − Insurance
- −$700
- − Repairs & maintenance
- −$1,775
- − Management
- −$1,775
- − HOA
- −$6,360
- − Depreciation
- −$4,073
- Taxable loss
- −$2,432
- Est. tax savings @ 24.0%
- +$584
- After-tax cash flow
- $147/yr
For passive investors: Depreciation is non-cash, so a rental often shows a tax loss while cash-flowing — sheltering income. Rental losses are passive: they offset passive income freely, and up to $25,000/yr can offset ordinary (W-2) income if you actively participate and your MAGI is under $100k (phasing out to $0 by $150k); unused losses carry forward. On sale, claimed depreciation is recaptured at up to 25%, and gains may owe capital-gains tax (a 1031 exchange can defer both). Figures are a year-1 estimate at your 24.0% rate — not tax advice; consult a CPA.
Schools (NCES district)
- District
- Palm Beach
- NCES district ID
- 1201500
- Math proficiency
- 46% ▼ -16.00%
- Reading proficiency
- 53% ▼ -4.00%
- Median HH income
- $53,943
- Composite
- 42.72/100
- National rank
- #3160
- State rank
- #34 of 73 in FL
Livability — West Palm Beach
- Score
- 82/100
- State rank
- #75
- US rank
- #1255
Category grades
Schools grade is shown separately in the Schools card above.
Census & demographics
- County
- Palm Beach County · 1,438,312 people
- City population
- 222,012
- Metro
- Miami-Fort Lauderdale-Pompano Beach, FL
- Population (ZIP)
- 76,863
- Household income
- $92,591
- Rent vs Own
- Severe rent burden
- 1870.0
Population outlook (Palm Beach County) Hauer SSP2
- Today (2025)
- 1,637,487 people
- By 2030
- 1,743,255 · +6.5%
- By 2040
- 1,948,712 · +19.0%
- By 2050
- 2,132,979 · +30.3%
- By 2075
- 2,530,027 · +54.5%
- By 2100
- 2,706,979 · +65.3%
Race, ethnicity, and origin ACS 2023
- Neighborhood character
- Diverse neighborhood (Simpson 0.70)
- Race & ethnicity
- White 44% Hispanic / Latino 24% Black 23% Two or more races 16% Asian 5%
- Hispanic origin (detail)
- Mexican 2% Puerto Rican 5% Cuban 4% Dominican 2%
- Common ancestry
- Hispanic 6% Romanian 2% Italian 1%
- Foreign-born
- 26% · Canada, Jamaica, China
- Languages at home
- 73% English-only · Spanish 17% French/Haitian/Cajun 4% Other Indo-European 2%
Political lean MEDSL · Palm Beach
- 2024 margin
- Toss-up / Even · D 50.0% · R 49.2%
- 2008→2024 swing
- -22.1pp toward R · 2008: 22.9pp · 2024: 0.8pp
- All cycles
- 2024: D+0.8 2020: D+12.8 2016: D+15.3 2012: D+17.0 2008: D+22.9
Not yet ingested
- Civics
- —
Market trends
- HPI YoY
- ▲ 17.04%
- Current HPI
- 903.78
- Rent YoY
- ▲ 0.85%
- Metro
- Miami-Fort Lauderdale-Pompano Beach, FL
- State GDP YoY
- ▲ 3.28%
- F500 in state
- 36
Industry mix (Fortune 500 HQ in FL)
| Industry | F500 HQs | Revenue |
|---|---|---|
| Industrial Technology | 2 | $29B |
|
||
| Insurance | 2 | $17B |
|
||
| Retail | 1 | $60B |
|
||
| Technology Distribution | 1 | $58B |
|
||
| Homebuilding | 1 | $35B |
|
||
| Technology Manufacturing | 1 | $35B |
|
||
Price history
-20.0% since first listed5 events — show timeline
- 2026-05-02 Relisted — Beaches MLS
- 2026-05-02 Price Changed $139,999 Beaches MLS
- 2026-04-06 Contingent — Beaches MLS
- 2026-03-26 Price Changed $144,999 Beaches MLS
- 2026-02-02 Listed $174,999 Beaches MLS
Cash-flow waterfall
monthlySold comps — $/sqft
last 12 mo · ≤1 miLoading sold comps…