 🏗️ New Construction
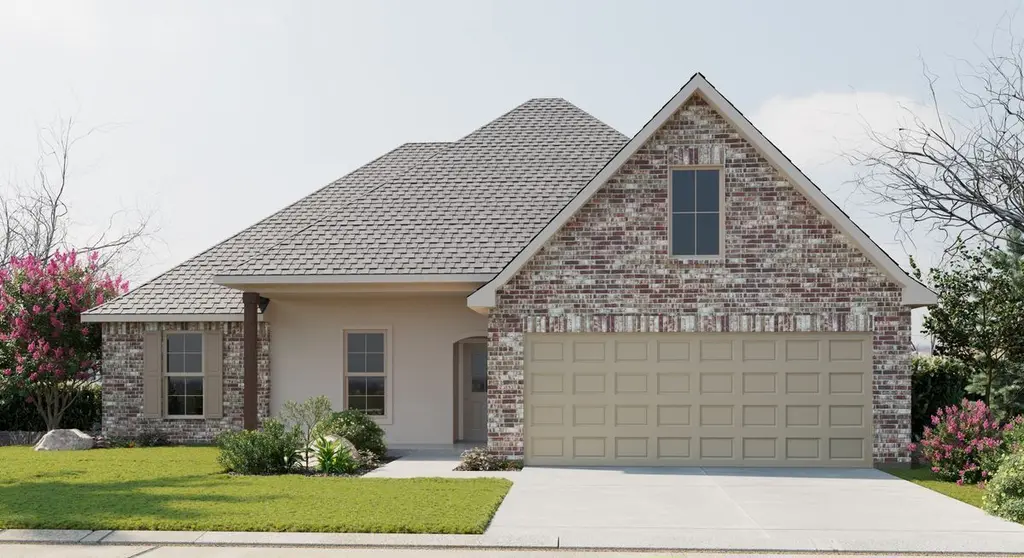
Rochelle V B - Fairhope Plan · Hammond, LA
Flood risk 1/10 · Minimal
- FEMA flood zone
- X (unshaded)
- Chance of flooding over 30 yrs
- 0.0%
- Est. flood insurance / yr
- $507 – $1,088
Fire risk 4/10 · Minor
- Est. fire insurance / yr
- $1,269 – $2,357
Heat risk 9/10 · Severe
- Hot days now (above 109°F)
- 7 days/yr
- Hot days in 30 yrs
- 21 days/yr
Wind risk 9/10 · Severe
- Chance of severe wind over 30 yrs
- 99.0%
Air-quality risk 2/10 · Minimal
- Unhealthy air days now
- 1 days/yr
- Unhealthy air days in 30 yrs
- 1 days/yr
Risk factors via First Street. Map © Google.
Why this score? — see what drove the F grade
The composite is a weighted blend of 9 inputs, each scored 0–100. Each bar is that input's sub-score; the figure is the points it added to the 100-point composite (weight × sub-score).
- Cash flow +10.2/30.0
- ARV discount +7.5/15.0
- Livability +3.5/5.0
- 1% rule +3.0/10.0
- DSCR +2.9/10.0
- Rent growth +2.7/5.0
- Condition / age +2.5/5.0
- Schools +2.0/10.0
- Appreciation +0.0/10.0
$273,990
🖨 Deal sheet 📄 Offer letter ✓ Due diligence
Listing remarks MLS
Welcome to the Rochelle V B floor plan by DSLD Homes, where spacious design meets smart, energy-efficient living. Offering 1,935 square feet of living space and a total area of 2,728 square feet, this 4-bedroom, 2-bathroom home is ideal for families seeking both functionality and comfort in a modern layout. The open floor plan seamlessly connects the kitchen, living, and dining areas-perfect for entertaining or relaxed everyday living. The home's brick, stucco, and siding exterior delivers timeless curb appeal and long-lasting durability, while recessed can lighting in the kitchen adds a touch of contemporary elegance. Inside, the chef-inspired kitchen includes a walk-in pantry, providing ample storage and convenience. The master suite is a peaceful retreat, complete with a double vanity, a separate master shower, and a spacious walk-in closet, offering both luxury and practicality. Other highlights include a two-car garage for parking and storage, along with energy-efficient construction that ensures lower utility bills and long-term value without sacrificing style or quality.
Key facts
- 2 garage spots
- Listed 569 days
Neighborhood map
What this means for you Summary
Snapshot
- This is a 4-bed/2.0-bath single-family listed at $274k.
Deal economics
- At list price, monthly cash flow is $-167 ($-2k/yr) — negative.
- To cash-flow at today's rent, offer at most $271k (1.0% below list).
- To meet the 1% rule (rent ≥ 1% of price), the offer needs to be $237k (13.4% below list).
- Recommended offer: $237k (13.4% below list) — sets the bar for 1% rule.
Location & tenants
- Location reads 69/100 on livability (#77 in LA) — a middle-class / working-renter tenant base. Strengths: cost of living A+, health & safety A+; Watch: amenities C-, commute D+, schools D.
- Tangipahoa Parish (rural): math 18% / reading 29% proficiency, ranked #63 of 98 in LA (top 64%) — low school quality limits family demand, transient renter base, plan for 1-2y turnover; 73% free/reduced lunch — lower-income household profile, screen leases tightly.
- Market conditions: Rents flat; 526 active listings in the ZIP; 2 comparable units currently listed for rent nearby; 1,085 units permitted in Tangipahoa Parish in 2024 (378 in 5+ unit buildings).
- This rent runs 40% of the median local income ($72k/yr) — at the standard rent-burdened threshold; future hikes will face affordability resistance.
Forward outlook
- Local home prices are declining (-3.0%/yr); year-one equity from $2k of loan paydown is wiped out by about $9k of value loss. Plan a longer hold.
- Tangipahoa County population projected at +22% by 2050 — long-run rental-demand tailwind backs the buy-and-hold thesis.
Negotiation context
- It's been on market 570 days — a 12% lower offer ($241k) is reasonable based on typical stale-listing flexibility.
Risks & watch-outs
- Climate carrying-cost: severe wind risk, 99% chance of damaging wind over 30y; extreme-heat days projected 7→21/yr by 2055 (HVAC capex compounding) — expect insurance premiums to compound above CPI over the hold.
Questions for the listing agent
- What do current leases actually rent for vs. the listed asking? Can we see a recent rent roll and the last 12 months of T-12 income?
- It's been on market 570 days. Have you received any prior offers? Is the seller open to a 13% concession, seller financing, or rate buy-down credit?
- Why hasn't it sold? Are there any deal-killer items the seller is aware of (foundation, flood, title, zoning, code violations)?
- Is there a deadline driving the sale (1031 exchange, divorce, estate, relocation)? That informs how much negotiation room exists.
- Schools are D-rated, which usually means shorter tenancies and higher turnover. Who's the typical renter profile here, and what's been the actual vacancy rate?
- Crime grade is F in this area — have there been break-ins, vandalism, or insurance claims at this property in the last 3 years? What carrier currently insures it and at what premium?
- The area grade is low — what's the realistic commute time and amenity access for the typical tenant pool here? Any planned neighborhood developments (good or bad) we should know about?
- What's the average days-on-market for RENTAL listings here right now (not sales)? A rising rental-DOM trend means longer vacancies and softer asking-rent achievability than the comps imply.
- What's the recent tenant-quality profile in this submarket — average credit score on applications, eviction rate, late-payment / NSF rate, and stable-employment percentage? A property-management company in the area should have these aggregated.
- How much new for-sale + rental construction is in the pipeline within 1–3 miles? Heavy new supply typically softens prices + rents 12–24 months out; constrained supply supports both.
Investment metrics
- 1% rule
- 0.80% ✗
- Cap rate
- 5.61%
- Cash-on-cash
- -2.42%
- DSCR
- 0.89
- GRM
- 10.4
CMA / ARV
- ARV (median comp)
- $295,487
- List price
- $273,990
- Delta
- -7.28%
- Verdict
- FAIR
- Comps
- 20 within 1.0 mi
Show comp detail 12 sales within ~0.75 mi
| Address | Dist | Beds/Ba | Sqft | Sold | Price | $/sf | Match |
|---|---|---|---|---|---|---|---|
| 39642 Fairhope Dr | 0.09mi | 4/2.0 | 1,935 (0%) | 3mo | $268,000 | $139 | 93 |
| 39593 White Sand Ln | 0.20mi | 3/2.0 (-1) | 1,939 (+0%) | 4mo | $299,000 | $154 | 82 |
| 39586 White Sand Ln | 0.18mi | 4/3.0 | 1,969 (+2%) | 4mo | $294,980 | $150 | 82 |
| 39509 White Sand Ln | 0.39mi | 4/2.0 | 1,935 (0%) | 3mo | $279,468 | $144 | 79 |
| 39397 Fairhope Dr | 0.37mi | 4/3.0 | 1,969 (+2%) | 0mo | $302,212 | $153 | 76 |
| 39478 White Sand Ln | 0.44mi | 4/2.0 | 1,992 (+3%) | 3mo | $299,170 | $150 | 72 |
| 25352 Blue Heron Dr | 0.42mi | 3/2.0 (-1) | 1,887 (-2%) | 0mo | $279,060 | $148 | 71 |
| 39413 Fairhope Dr | 0.37mi | 3/2.0 (-1) | 1,825 (-6%) | 1mo | $272,633 | $149 | 67 |
| 39444 Fairhope Dr | 0.37mi | 4/3.0 | 2,072 (+7%) | 2mo | $296,780 | $143 | 66 |
| 39421 Fairhope Dr | 0.37mi | 4/3.0 | 2,072 (+7%) | 3mo | $291,913 | $141 | 65 |
| 39441 White Sand Ln | 0.49mi | 3/2.0 (-1) | 1,825 (-6%) | 4mo | $275,679 | $151 | 59 |
| 39512 White Sand Ln | 0.39mi | 3/2.0 (-1) | 1,750 (-10%) | 3mo | $265,990 | $152 | 58 |
Match score weights: distance 35% · size 25% · config 20% · recency 20%. Top-matched comps best support the ARV.
Projected returns pro-forma
-3.0% appreciation · 0.66% rent growth · sell at horizon
- IRR
- -23.0%
- Equity multiple
- 0.23×
- Total profit
- $-63,955
- Equity at exit
- $44,058
- IRR
- -25.0%
- Equity multiple
- -0.10×
- Total profit
- $-90,636
- Equity at exit
- $25,548
Cash invested: $82,736 (down + closing). Projections, not guarantees.
Landlord ↔ Tenant lean methodology
- Overall (STATE)
- 90 Strongly Landlord-Friendly
- State Louisiana
- 90 Strongly Landlord-Friendly · R+12
- County
- — inherits STATE
- City
- — inherits STATE
ZIP-level market 70454
- Rents YoY
- 0.7%
- Active inventory
- 526
- Price-to-rent
- 9.6×
Monthly cashflow live
- Estimated rent
- $2,373 medium interval (Pro) →
- Mortgage (P&I)
- −$1,550
- Tax est. 1.5%
- −$369 /mo · $4,432/yr
- Insurance
- −$123
- HOA
- −$0
- Vacancy / Maint / Mgmt
- −$498
- Net cashflow
- $-167
Break-even live
UW: 25.0% down · 7.5% · 30yr · 1.5% tax · 5.0% vac · 8.0% maint · 8.0% mgmt
Financing live
Cash to close
- Down payment
- $73,872
- Closing costs
- $8,865
- Reserves months
- —
- Total cash needed
- —
Loan-product check · same deal, 3 products live
Conventional
25% down · 7.5% · 30yr
- Down + closing
- —
- Monthly P&I
- —
- Monthly cashflow
- —
- DSCR
- —
- Eligible?
- —
Personal DTI + credit; lowest rate.
DSCR
20% down · 8.5% · 30yr
- Down + closing
- —
- Monthly P&I
- —
- Monthly cashflow
- —
- DSCR
- —
- Eligible?
- —
No personal income docs; deal must DSCR.
Hard money
10% down · 12.0% · 12mo
- Down + closing
- —
- Monthly P&I
- —
- Monthly cashflow
- —
- DSCR
- —
- Eligible?
- —
Short-term bridge; refi at stabilization.
Rent comps 2 comps
| Address | Beds | Baths | Sqft | Rent | $/sqft | DOM | Units | Dist |
|---|---|---|---|---|---|---|---|---|
| 40531 Cypress Reserve Blvd Ponchatoula, LA | 4.0 | 2.5 | 2597 | $2,750 | $1.06 | 44d | 1 | 0.85mi |
| 41095 Mersanger Rd Ponchatoula, LA | 3.0 | 2.0 | 1510 | $1,950 | $1.29 | 44d | 1 | 1.20mi |
Listing history 18 events
-
2026-06-19days on market $273,990 Active 570 DOM
-
2026-06-18days on market $273,990 Active 569 DOM
-
2026-06-17days on market $273,990 Active 568 DOM
-
2026-06-16days on market $273,990 Active 567 DOM
-
2026-06-15days on market $273,990 Active 566 DOM
-
2026-06-14days on market $273,990 Active 564 DOM
-
2026-06-13days on market $273,990 Active 563 DOM
-
2026-06-10days on market $273,990 Active 561 DOM
-
2026-06-09days on market $273,990 Active 560 DOM
-
2026-06-08days on market $273,990 Active 559 DOM
-
2026-06-07days on market $273,990 Active 558 DOM
-
2026-06-05days on market $273,990 Active 555 DOM
-
2026-06-03days on market $273,990 Active 554 DOM
-
2026-06-02days on market $273,990 Active 553 DOM
-
2026-06-01days on market $273,990 Active 552 DOM
-
2026-05-31days on market $273,990 Active 551 DOM
-
2026-05-30days on market $273,990 Active 550 DOM
-
2024-11-26$273,990 Active 1094-char remark
Show marketing remark (1094 chars)
Welcome to the Rochelle V B floor plan by DSLD Homes, where spacious design meets smart, energy-efficient living. Offering 1,935 square feet of living space and a total area of 2,728 square feet, this 4-bedroom, 2-bathroom home is ideal for families seeking both functionality and comfort in a modern layout. The open floor plan seamlessly connects the kitchen, living, and dining areas-perfect for entertaining or relaxed everyday living. The home's brick, stucco, and siding exterior delivers timeless curb appeal and long-lasting durability, while recessed can lighting in the kitchen adds a touch of contemporary elegance. Inside, the chef-inspired kitchen includes a walk-in pantry, providing ample storage and convenience. The master suite is a peaceful retreat, complete with a double vanity, a separate master shower, and a spacious walk-in closet, offering both luxury and practicality. Other highlights include a two-car garage for parking and storage, along with energy-efficient construction that ensures lower utility bills and long-term value without sacrificing style or quality.
ⓘ Source: listings_history table (triggers on properties + properties_extension) + one-shot
backfill from property_details.listing_events for pre-trigger history.
Climate risk First Street
- Flood 1/10 Low FEMA zone X (unshaded) · 0% chance over 30 yrs
- Wildfire 4/10 Moderate
- Heat 9/10 Extreme 7 d/yr ≥109°F today · 21 d/yr by 30 yrs out
- Wind 9/10 Extreme 99% chance of damaging wind over 30 yrs
- Air quality 2/10 Low 1 unhealthy d/yr today · 1 by 30 yrs out
Nearby sold comps map
Loading sold comps map…
Walkable amenities ~0.75 mi
Loading nearby amenities…
Taxation est. · year 1
- Rental income
- $28,479
- − Mortgage interest
- −$16,552
- − Property taxes
- −$4,432
- − Insurance
- −$1,477
- − Repairs & maintenance
- −$2,278
- − Management
- −$2,278
- − Depreciation
- −$8,596
- Taxable loss
- −$7,135
- Est. tax savings @ 24.0%
- +$1,713
- After-tax cash flow
- $-294/yr
For passive investors: Depreciation is non-cash, so a rental often shows a tax loss while cash-flowing — sheltering income. Rental losses are passive: they offset passive income freely, and up to $25,000/yr can offset ordinary (W-2) income if you actively participate and your MAGI is under $100k (phasing out to $0 by $150k); unused losses carry forward. On sale, claimed depreciation is recaptured at up to 25%, and gains may owe capital-gains tax (a 1031 exchange can defer both). Figures are a year-1 estimate at your 24.0% rate — not tax advice; consult a CPA.
Schools (NCES district)
- District
- Tangipahoa Parish
- NCES district ID
- 2201680
- Math proficiency
- 18% ▼ -32.00%
- Reading proficiency
- 29% ▼ -31.00%
- Median HH income
- $41,283
- Composite
- 19.94/100
- National rank
- #8676
- State rank
- #63 of 98 in LA
Livability — Hammond
- Score
- 69/100
- State rank
- #77
- US rank
- #8868
Category grades
Schools grade is shown separately in the Schools card above.
Census & demographics
- County
- Tangipahoa Parish · 85,958 people
- City population
- 51,394
- Metro
- Hammond, LA
- Population (ZIP)
- 34,564
- Household income
- $71,611
- Rent vs Own
- Severe rent burden
- 479.0
Population outlook (Tangipahoa County) Hauer SSP2
- Today (2025)
- 144,204 people
- By 2030
- 151,413 · +5.0%
- By 2040
- 164,374 · +14.0%
- By 2050
- 175,427 · +21.7%
- By 2075
- 195,165 · +35.3%
- By 2100
- 201,641 · +39.8%
Race, ethnicity, and origin ACS 2023
- Neighborhood character
- Predominantly White (73%)
- Race & ethnicity
- White 73% Black 16% Two or more races 8% Hispanic / Latino 8%
- Hispanic origin (detail)
- Mexican 2%
- Common ancestry
- Lithuanian 15% Slovak 1% Portuguese 1%
- Foreign-born
- 3% · Canada
- Languages at home
- 94% English-only · Spanish 5%
Political lean MEDSL · Tangipahoa
- 2024 margin
- Solid R (+37.4) · D 30.6% · R 68.0% · Other 1.3%
- 2008→2024 swing
- -6.5pp toward R · 2008: -30.9pp · 2024: -37.4pp
- All cycles
- 2024: R+37.4 2020: R+32.8 2016: R+32.6 2012: R+27.7 2008: R+30.9
Not yet ingested
- Civics
- —
Market trends
- HPI YoY
- ▼ -83.55%
- Current HPI
- 129.6069
- Rent YoY
- ▲ 0.66%
- Metro
- Hammond, LA
- State GDP YoY
- ▲ 3.29%
- F500 in state
- 10
Industry mix (Fortune 500 HQ in LA)
| Industry | F500 HQs | Revenue |
|---|---|---|
| Telecommunications | 2 | $23B |
|
||
| Utilities | 1 | $12B |
|
||
| Wholesale / Distribution | 1 | $5B |
|
||
| Advertising | 1 | $2B |
|
||
Price history
1 event — show timeline
- 2024-11-26 Listed $273,990 Zillow
Cash-flow waterfall
monthlySold comps — $/sqft
last 12 mo · ≤1 miLoading sold comps…