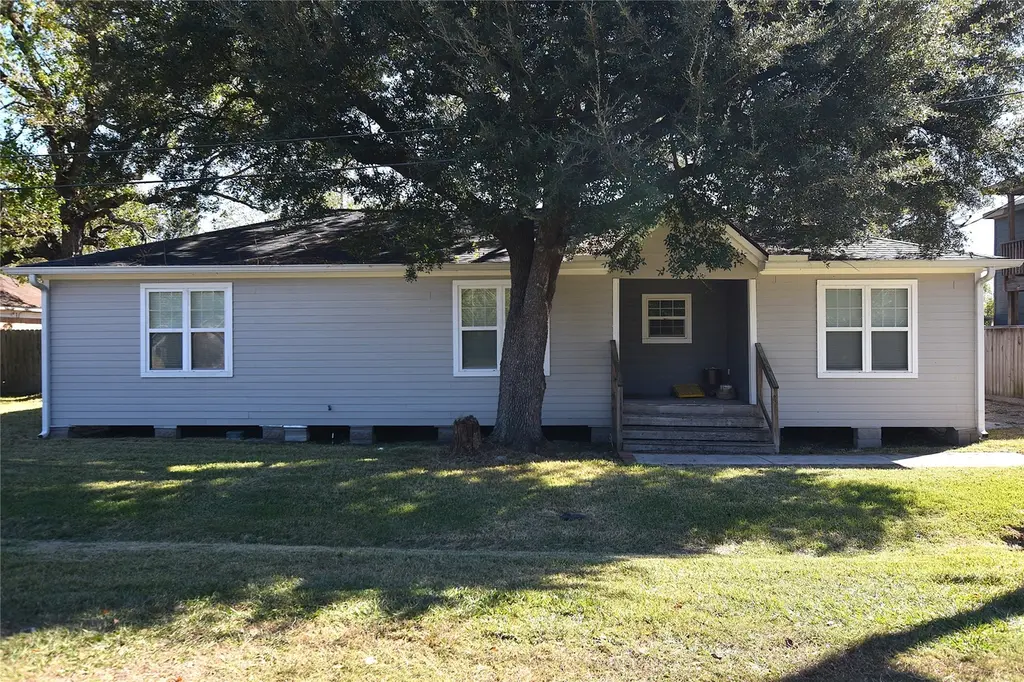
202 Wahl St · Crosby, TX
Flood risk 1/10 · Minimal
- FEMA flood zone
- X (unshaded)
- Chance of flooding over 30 yrs
- 0.0%
- Est. flood insurance / yr
- $507 – $1,088
Fire risk 4/10 · Minor
- Est. fire insurance / yr
- $1,222 – $2,270
Heat risk 9/10 · Severe
- Hot days now (above 110°F)
- 7 days/yr
- Hot days in 30 yrs
- 24 days/yr
Wind risk 9/10 · Severe
- Chance of severe wind over 30 yrs
- 99.0%
Air-quality risk 2/10 · Minimal
- Unhealthy air days now
- 2 days/yr
- Unhealthy air days in 30 yrs
- 2 days/yr
Risk factors via First Street. Map © Google.
Why this score? — see what drove the D+ grade
The composite is a weighted blend of 9 inputs, each scored 0–100. Each bar is that input's sub-score; the figure is the points it added to the 100-point composite (weight × sub-score).
- Cash flow +14.0/30.0
- ARV discount +13.2/15.0
- DSCR +4.2/10.0
- 1% rule +3.9/10.0
- Schools +3.5/10.0
- Livability +3.0/5.0
- Rent growth +2.9/5.0
- Condition / age +2.5/5.0
- Appreciation +0.0/10.0
$215,000
🖨 Deal sheet 📄 Offer letter ✓ Due diligence
Listing remarks
Welcome to this beautifully updated 2-bedroom, 2-bath home featuring a bright, open layout and modern finishes throughout. The remodeled kitchen offers white quartz countertops, shaker-style cabinetry, stainless steel appliances, and a clean design that flows smoothly into the dining and living areas. Generous natural light enhances the warm, inviting feel of the home. Both bathrooms have been refreshed with contemporary fixtures and neutral finishes. The primary suite provides comfort and privacy, and the secondary bedroom offers flexibility for guests or additional living needs. Outside, a spacious backyard with a covered deck offers a welcoming area for relaxing or entertaining. The home
Key facts
- Covered deck
- Spacious backyard
- Remodeled kitchen
Tags
Property features AI
Finance
- Other: Seller disclosures provided (Municipal Utility District Disclosure, Seller Disclosure)
- Financial info: Lease not considered
Exterior
- Parking: Detached carport; 2-car carport; Driveway
- Security: Fenced backyard
- Utilities: Public water; Public sewer
- Home design: Residential property; Single-story (implied); Block foundation; Composition roof; Concrete road access; Cleared lot
- Construction: Cement and wood siding; Built in 1946
- Exterior features: Covered patio; Deck; Patio; Porch; Private, fully fenced yard; Paved driveway
Interior
- Kitchen: Dishwasher; Gas cooktop; Gas oven; Garbage disposal
- Bedrooms: 3 total rooms (bedroom count not explicitly listed beyond total rooms)
- Flooring: Carpet; Laminate; Tile
- Bathrooms: 2 full bathrooms
- Heating & cooling: Central heating (gas); Central electric air conditioning
- Interior features: Breakfast bar; Double vanity; Kitchen and family room combo; Quartz countertops; Tub with shower; Open living/dining area
- Laundry & utility: Washer hookup; Electric dryer hookup; Gas dryer hookup
Neighborhood map
What this means for you Summary
Snapshot
- This is a 2-bed/1.5-bath single-family listed at $215k.
Deal economics
- At list price, monthly cash flow is $26 ($313/yr) — positive.
- The deal already cash-flows at list — no discount required.
- To meet the 1% rule (rent ≥ 1% of price), the offer needs to be $191k (11.0% below list).
- Recommended offer: $191k (11.0% below list) — sets the bar for 1% rule.
- Cap rate 6.4% vs local median 4.8% in Crosby — top-decile yield for the area; either an underpriced asset or a hidden risk that comps aren't pricing in. Stress-test before assuming the spread holds.
Location & tenants
- Location reads 59/100 on livability (#1,121 in TX) — a working-class tenant base; expect higher turnover. Strengths: cost of living A+, crime A, housing A; Watch: amenities F, commute F, employment F.
- Crosby ISD (rural): math 39% / reading 40% proficiency, ranked #369 of 826 in TX (top 45%) — families likely to look elsewhere, expect single-tenant / working-renter base with shorter leases.
- Zoned schools: Crosby Middle (math 36% / reading 37%, grade F, #786 of 1,662 statewide, top 48%, 1,549 students, 60% FRL); Highpoint School East (Crosby) (20 students, 80% FRL) — zoned schools average 70% FRL vs 50% district-wide (20 pts higher); higher-poverty schools than district average — tighter screening recommended.
- Market conditions: Rents rising (+1.5%/yr); 1172 active listings in the ZIP; 2 comparable units currently listed for rent nearby; solid renter incomes; 29,883 units permitted in Harris County in 2024 (8,621 in 5+ unit buildings).
Forward outlook
- Local home prices are declining (-3.0%/yr); year-one equity from $1k of loan paydown is wiped out by about $6k of value loss. Plan a longer hold.
- Harris County population projected at +47% by 2050 — long-run rental-demand tailwind backs the buy-and-hold thesis.
Negotiation context
- It's been on market 31 days — a 3% lower offer ($209k) is reasonable based on typical stale-listing flexibility.
- 3 sale attempts since 15y ago with the ask held roughly flat each time — persistent listings suggest the price (not the market) is what's stuck; bring a comps-based counter.
Risks & watch-outs
- Watch-outs: built in 1946 — expect roof / HVAC / electrical / plumbing capex.
- Climate carrying-cost: severe wind risk, 99% chance of damaging wind over 30y; extreme-heat days projected 7→24/yr by 2055 (HVAC capex compounding) — expect insurance premiums to compound above CPI over the hold.
Questions for the listing agent
- It's been on market 31 days. Have you received any prior offers? Is the seller open to a 11% concession, seller financing, or rate buy-down credit?
- Built in 1946 — when were the roof, HVAC, electrical panel, plumbing, and water heater last replaced?
- Is there a deadline driving the sale (1031 exchange, divorce, estate, relocation)? That informs how much negotiation room exists.
- Schools are D-rated, which usually means shorter tenancies and higher turnover. Who's the typical renter profile here, and what's been the actual vacancy rate?
- The area grade is low — what's the realistic commute time and amenity access for the typical tenant pool here? Any planned neighborhood developments (good or bad) we should know about?
- What's the average days-on-market for RENTAL listings here right now (not sales)? A rising rental-DOM trend means longer vacancies and softer asking-rent achievability than the comps imply.
- What's the recent tenant-quality profile in this submarket — average credit score on applications, eviction rate, late-payment / NSF rate, and stable-employment percentage? A property-management company in the area should have these aggregated.
- How much new for-sale + rental construction is in the pipeline within 1–3 miles? Heavy new supply typically softens prices + rents 12–24 months out; constrained supply supports both.
Investment metrics
- 1% rule
- 0.89% ✗
- Cap rate
- 6.44%
- Cash-on-cash
- 0.52%
- DSCR
- 1.02
- GRM
- 9.4
CMA / ARV
- ARV (on-the-fly)
- $245,960
- Comps found
- 12
Show comp detail 12 sales within ~0.75 mi
| Address | Dist | Beds/Ba | Sqft | Sold | Price | $/sf | Match |
|---|---|---|---|---|---|---|---|
| 2554 Cactus Ranch Ln | 0.24mi | 3/2.0 (+1) | 1,414 (-1%) | 7mo | $239,540 | $169 | 74 |
| 2614 Cactus Ranch Ln | 0.27mi | 3/2.0 (+1) | 1,414 (-1%) | 6mo | $212,740 | $150 | 74 |
| 707 Amberwood Creek Dr | 0.30mi | 3/2.0 (+1) | 1,484 (+4%) | 2mo | $268,990 | $181 | 71 |
| 17314 Roxboro Ridge Ln | 0.30mi | 3/2.0 (+1) | 1,484 (+4%) | 3mo | $270,990 | $183 | 71 |
| 17315 Glacier Forest Ln | 0.30mi | 3/2.0 (+1) | 1,484 (+4%) | 3mo | $268,990 | $181 | 70 |
| 17311 Thor Well Ln | 0.30mi | 3/2.0 (+1) | 1,496 (+5%) | 2mo | $239,900 | $160 | 69 |
| 18811 Spokane Falls Trl | 0.30mi | 3/2.0 (+1) | 1,477 (+3%) | 6mo | $254,340 | $172 | 69 |
| 2547 Cactus Ranch Ln | 0.27mi | 3/2.0 (+1) | 1,562 (+9%) | 5mo | $249,840 | $160 | 61 |
| 5606 Pecan St | 0.28mi | 3/1.0 (+1) | 1,554 (+9%) | 7mo | $150,000 | $97 | 60 |
| 17310 Roxboro Ridge Ln | 0.30mi | 3/2.0 (+1) | 1,269 (-11%) | 2mo | $263,990 | $208 | 59 |
| 6318 Borage St | 0.73mi | 3/2.0 (+1) | 1,457 (+2%) | 1mo | $249,999 | $172 | 55 |
| 15814 Oporto Springs Way | 0.72mi | 3/2.0 (+1) | 1,614 (+13%) | 3mo | $240,000 | $149 | 36 |
Match score weights: distance 35% · size 25% · config 20% · recency 20%. Top-matched comps best support the ARV.
Projected returns pro-forma
-3.0% appreciation · 1.48% rent growth · sell at horizon
- IRR
- -17.2%
- Equity multiple
- 0.40×
- Total profit
- $-36,035
- Equity at exit
- $32,057
- IRR
- -12.2%
- Equity multiple
- 0.33×
- Total profit
- $-40,600
- Equity at exit
- $18,589
Cash invested: $60,200 (down + closing). Projections, not guarantees.
Landlord ↔ Tenant lean methodology
- Overall (STATE)
- 87 Strongly Landlord-Friendly
- State Texas
- 87 Strongly Landlord-Friendly · R+5
- County
- — inherits STATE
- City
- — inherits STATE
ZIP-level market 77532
- Home prices YoY
- -28.6%
- Rents YoY
- 1.5%
- Active inventory
- 1172
- Price-to-rent
- 9.4×
Monthly cashflow live
- Estimated rent
- $1,914 medium interval (Pro) →
- Mortgage (P&I)
- −$1,127
- Tax est. 1.5%
- −$269 /mo · $3,225/yr
- Insurance
- −$90
- HOA
- −$0
- Vacancy / Maint / Mgmt
- −$402
- Net cashflow
- $26
Break-even live
UW: 25.0% down · 7.5% · 30yr · 1.5% tax · 5.0% vac · 8.0% maint · 8.0% mgmt
Financing live
Cash to close
- Down payment
- $53,750
- Closing costs
- $6,450
- Reserves months
- —
- Total cash needed
- —
Loan-product check · same deal, 3 products live
Conventional
25% down · 7.5% · 30yr
- Down + closing
- —
- Monthly P&I
- —
- Monthly cashflow
- —
- DSCR
- —
- Eligible?
- —
Personal DTI + credit; lowest rate.
DSCR
20% down · 8.5% · 30yr
- Down + closing
- —
- Monthly P&I
- —
- Monthly cashflow
- —
- DSCR
- —
- Eligible?
- —
No personal income docs; deal must DSCR.
Hard money
10% down · 12.0% · 12mo
- Down + closing
- —
- Monthly P&I
- —
- Monthly cashflow
- —
- DSCR
- —
- Eligible?
- —
Short-term bridge; refi at stabilization.
Rent comps 2 comps
| Address | Beds | Baths | Sqft | Rent | $/sqft | DOM | Units | Dist |
|---|---|---|---|---|---|---|---|---|
| 711 Equinox St Crosby, TX | 3.0 | 2.0 | 1802 | $1,881 | $1.04 | 44d | 1 | 1.19mi |
| 430 Fishhawk Way Crosby, TX | 3.0 | 2.0 | 1369 | $1,863 | $1.36 | 4d | 1 | 1.39mi |
Listing history 21 events
-
2026-06-18days on market $215,000 Active 31 DOM
-
2026-06-17days on market $215,000 Active 30 DOM
-
2026-06-16days on market $215,000 Active 29 DOM
-
2026-06-15days on market $215,000 Active 28 DOM
-
2026-06-13days on market $215,000 Active 26 DOM
-
2026-06-09days on market $215,000 Active 22 DOM
-
2026-06-08days on market $215,000 Active 21 DOM
-
2026-06-07days on market $215,000 Active 20 DOM
-
2026-06-04days on market $215,000 Active 17 DOM
-
2026-06-03days on market $215,000 Active 16 DOM
-
2026-06-02days on market $215,000 Active 15 DOM
-
2026-06-01days on market $215,000 Active 14 DOM
-
2026-05-31days on market $215,000 Active 13 DOM
-
2026-05-18$215,000 Active
-
2026-04-30historical
-
2025-11-13$225,000 Active
-
2015-01-06soldstatus
-
2012-10-01historical
-
2011-07-27$199,900
-
2002-11-13soldstatus
-
1993-08-25soldstatus
ⓘ Source: listings_history table (triggers on properties + properties_extension) + one-shot
backfill from property_details.listing_events for pre-trigger history.
Climate risk First Street
- Flood 1/10 Low FEMA zone X (unshaded) · 0% chance over 30 yrs
- Wildfire 4/10 Moderate
- Heat 9/10 Extreme 7 d/yr ≥110°F today · 24 d/yr by 30 yrs out
- Wind 9/10 Extreme 99% chance of damaging wind over 30 yrs
- Air quality 2/10 Low 2 unhealthy d/yr today · 2 by 30 yrs out
Nearby sold comps map
Loading sold comps map…
Walkable amenities ~0.75 mi
Loading nearby amenities…
Taxation est. · year 1
- Rental income
- $22,965
- − Mortgage interest
- −$12,043
- − Property taxes
- −$3,225
- − Insurance
- −$1,075
- − Repairs & maintenance
- −$1,837
- − Management
- −$1,837
- − Depreciation
- −$6,255
- Taxable loss
- −$3,307
- Est. tax savings @ 24.0%
- +$794
- After-tax cash flow
- $1,106/yr
For passive investors: Depreciation is non-cash, so a rental often shows a tax loss while cash-flowing — sheltering income. Rental losses are passive: they offset passive income freely, and up to $25,000/yr can offset ordinary (W-2) income if you actively participate and your MAGI is under $100k (phasing out to $0 by $150k); unused losses carry forward. On sale, claimed depreciation is recaptured at up to 25%, and gains may owe capital-gains tax (a 1031 exchange can defer both). Figures are a year-1 estimate at your 24.0% rate — not tax advice; consult a CPA.
Schools (NCES district)
- District
- Crosby ISD
- NCES district ID
- 4815750
- Math proficiency
- 39% ▼ -13.00%
- Reading proficiency
- 40% ▼ -5.00%
- Median HH income
- $61,079
- Composite
- 35.14/100
- National rank
- #5012
- State rank
- #369 of 826 in TX
Livability — Crosby
- Score
- 59/100
- State rank
- #1121
- US rank
- #19783
Category grades
Schools grade is shown separately in the Schools card above.
Census & demographics
- Census place
- Crosby, TX
- County
- Harris County · 4,702,590 people
- City population
- 33,780
- Metro
- Houston-The Woodlands-Sugar Land, TX
- Population (ZIP)
- 33,780
- Household income
- $92,201
- Rent vs Own
- Severe rent burden
- 382.0
Population outlook (Harris County) Hauer SSP2
- Today (2025)
- 5,571,493 people
- By 2030
- 6,089,821 · +9.3%
- By 2040
- 7,142,806 · +28.2%
- By 2050
- 8,185,864 · +46.9%
- By 2075
- 10,574,329 · +89.8%
- By 2100
- 12,109,958 · +117.4%
Race, ethnicity, and origin ACS 2023
- Neighborhood character
- Diverse neighborhood (Simpson 0.60)
- Race & ethnicity
- White 54% Hispanic / Latino 31% Two or more races 16% Black 9%
- Hispanic origin (detail)
- Mexican 24%
- Common ancestry
- Lithuanian 4% Romanian 3% Italian 2%
- Foreign-born
- 10% · Canada
- Languages at home
- 78% English-only · Spanish 21%
Political lean MEDSL · Harris
- 2024 margin
- Lean D (+5.5) · D 52.0% · R 46.4% · Other 1.6%
- 2008→2024 swing
- +3.9pp toward D · 2008: 1.6pp · 2024: 5.5pp
- All cycles
- 2024: D+5.5 2020: D+13.3 2016: D+12.4 2012: D+0.1 2008: D+1.6
Not yet ingested
- Civics
- —
Market trends
- HPI YoY
- ▼ -105.63%
- Current HPI
- 264.0126
- Rent YoY
- ▲ 1.48%
- Metro
- Houston-The Woodlands-Sugar Land, TX
- State GDP YoY
- ▲ 3.95%
- F500 in state
- 110
Industry mix (Fortune 500 HQ in TX)
| Industry | F500 HQs | Revenue |
|---|---|---|
| Energy | 16 | $1,198B |
|
||
| Technology | 5 | $198B |
|
||
| Engineering / Construction | 4 | $72B |
|
||
| Energy Services | 3 | $60B |
|
||
| Utilities | 3 | $41B |
|
||
| Healthcare | 2 | $330B |
|
||
Price history
+7.6% since first listed8 events — show timeline
- 2026-05-18 Listed $215,000 HARMLS
- 2026-04-30 Listing Removed — HARMLS
- 2025-11-13 Listed $225,000 HARMLS
- 2015-01-06 Sold (Public Records) — Public Records
- 2012-10-01 Listing Removed — HARMLS
- 2011-07-27 Listed $199,900 HARMLS
- 2002-11-13 Sold (Public Records) — Public Records
- 1993-08-25 Sold (Public Records) — Public Records
Property tax history
+10.5%/yrLatest (2025): $11,744 · +1.4% YoY. Source: county tax records.
Cash-flow waterfall
monthlySold comps — $/sqft
last 12 mo · ≤1 miLoading sold comps…