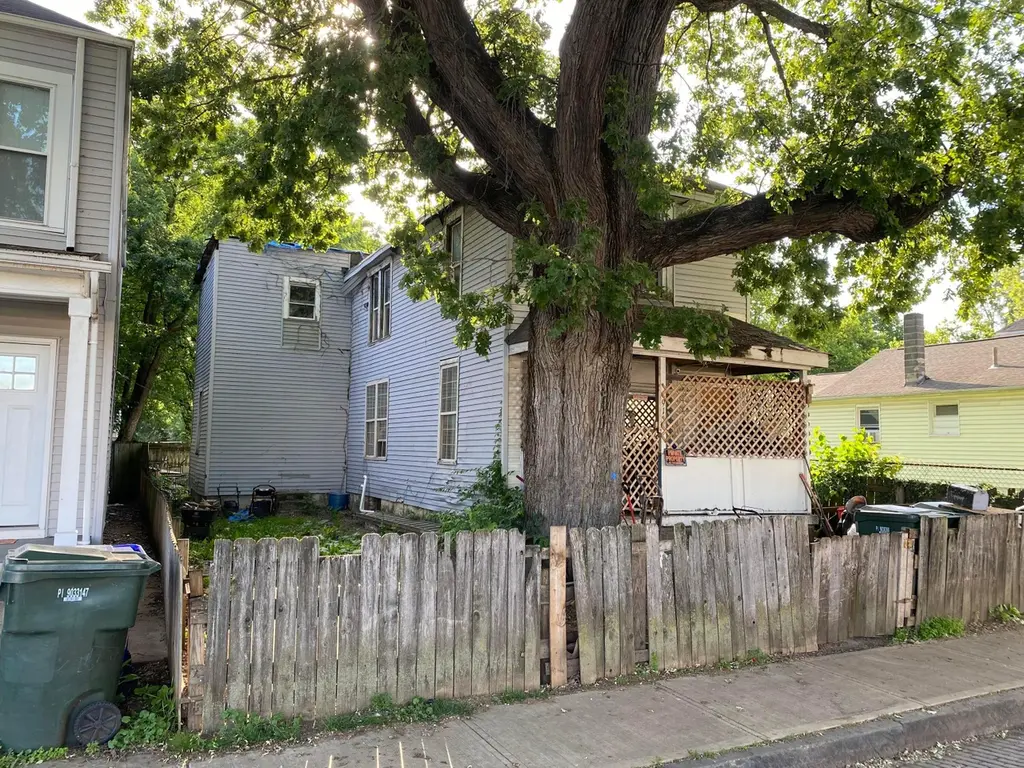
91 N Jones Ave · Columbus, OH
Flood risk 1/10 · Minimal
- FEMA flood zone
- X
- Chance of flooding over 30 yrs
- 0.0%
- Est. flood insurance / yr
- $507 – $1,088
Fire risk 1/10 · Minimal
- Est. fire insurance / yr
- $713 – $1,323
Heat risk 4/10 · Minor
- Hot days now (above 100°F)
- 7 days/yr
- Hot days in 30 yrs
- 18 days/yr
Wind risk 2/10 · Minimal
- Chance of severe wind over 30 yrs
- 1.0%
Air-quality risk 3/10 · Minor
- Unhealthy air days now
- 2 days/yr
- Unhealthy air days in 30 yrs
- 4 days/yr
Risk factors via First Street. Map © Google.
Why this score? — see what drove the B+ grade
The composite is a weighted blend of 9 inputs, each scored 0–100. Each bar is that input's sub-score; the figure is the points it added to the 100-point composite (weight × sub-score).
- Cash flow +30.0/30.0
- 1% rule +10.0/10.0
- DSCR +10.0/10.0
- Appreciation +10.0/10.0
- ARV discount +7.5/15.0
- Livability +4.0/5.0
- Rent growth +2.5/5.0
- Schools +1.7/10.0
- Condition / age +1.0/5.0
$65,000
🖨 Deal sheet 📄 Offer letter ✓ Due diligence
Listing remarks
Great Franklinton location for this property in need of full rehab. Previously two 2-bed, 1-bath apartments, now used as a single family home. Property has active code violations and a current Environmental Court case (see attached docs).
Key facts
- 3,920 sq ft lot
- Built 1900
- Listed 12 days
Property features AI
Finance
- Other: Listing subject to third-party approval
Exterior
- Parking: On-street parking
- Utilities: Public water; Public sewer
- Home design: Single-family residence; Two levels; Built in 1900; No shared/common walls
- Construction: Stone foundation
- Exterior features: Fenced yard
Interior
- Bedrooms: 1 bedroom on the main level
- Flooring: Wood floors
- Bathrooms: 1 full bathroom
- Heating & cooling: Forced air heating
- Interior features: Partial basement; Wood flooring; 1,734 finished living area
Neighborhood map
What this means for you Summary
Snapshot
- This is a 3-bed/1.0-bath single-family listed at $65k. Condition is rated poor.
Deal economics
- At list price, monthly cash flow is $876 ($11k/yr) — positive.
- The deal already cash-flows at list — no discount required.
- Meets the 1% rule at list price ($2k rent vs $65k).
- Cap rate 22.5% vs local median 3.8% in Columbus — top-decile yield for the area; either an underpriced asset or a hidden risk that comps aren't pricing in. Stress-test before assuming the spread holds.
Location & tenants
- Location reads 81/100 on livability (#97 in OH, #1,491 nationally) — a professional / high-income tenant draw. Strengths: commute A+, cost of living A+, housing A+; Watch: employment C-, crime F.
- Columbus City School District (urban): math 15% / reading 26% proficiency, ranked #626 of 656 in OH (top 95%) — low school quality limits family demand, transient renter base, plan for 1-2y turnover; 72% free/reduced lunch — lower-income household profile, screen leases tightly.
- Market conditions: 50 active listings in the ZIP; 40 comparable units currently listed for rent nearby; rentals at typical pace (median 24d on market — plan ~3-4 weeks tenant-placement turnaround); lower-income renter base — watch delinquency; 8,139 units permitted in Franklin County in 2024 (5,940 in 5+ unit buildings).
- At $1,678/mo this rent would consume 62% of the median local household income ($32k/yr) (locally 126% of renters already pay >50% of income on rent) — very limited rent-growth headroom before tenants either downsize or default.
Forward outlook
- In year one you build about $7k of equity ($449 loan paydown + $6k appreciation (10.0% local appreciation)).
- Franklin County population projected at +34% by 2050 — long-run rental-demand tailwind backs the buy-and-hold thesis.
- At projected returns (10.0% appreciation + 3.0% rent growth), your $18k cash investment doubles in ~2 years — after that, you're playing with house money.
- By year 5, paydown + projected appreciation supports a ~$32k cash-out refi (75% LTV) — recoverable capital for the next deal without selling this one.
Negotiation context
- Only 12 days on market — expect competitive offers; lowballing is unlikely to land.
- 7 sale attempts since 32y ago; this cycle's ask has dropped $10k (13%) from the opening price — seller is motivated, your offer sets the floor, not the list.
Risks & watch-outs
- Watch-outs: built in 1900 — expect roof / HVAC / electrical / plumbing capex.
Questions for the listing agent
- Have any recent inspections been done? Can we get a copy of the seller's disclosures and any deferred-maintenance estimates?
- Built in 1900 — when were the roof, HVAC, electrical panel, plumbing, and water heater last replaced?
- Is there a deadline driving the sale (1031 exchange, divorce, estate, relocation)? That informs how much negotiation room exists.
- Crime grade is F in this area — have there been break-ins, vandalism, or insurance claims at this property in the last 3 years? What carrier currently insures it and at what premium?
- What's the average days-on-market for RENTAL listings here right now (not sales)? A rising rental-DOM trend means longer vacancies and softer asking-rent achievability than the comps imply.
- What's the recent tenant-quality profile in this submarket — average credit score on applications, eviction rate, late-payment / NSF rate, and stable-employment percentage? A property-management company in the area should have these aggregated.
- How much new for-sale + rental construction is in the pipeline within 1–3 miles? Heavy new supply typically softens prices + rents 12–24 months out; constrained supply supports both.
Investment metrics
- 1% rule
- 2.58% ✓
- Cap rate
- 22.47%
- Cash-on-cash
- 57.79%
- DSCR
- 3.57
- GRM
- 3.2
CMA / ARV
- ARV (on-the-fly)
- $286,110
- Comps found
- 12
Show comp detail 12 sales within ~0.75 mi
| Address | Dist | Beds/Ba | Sqft | Sold | Price | $/sf | Match |
|---|---|---|---|---|---|---|---|
| 56 Hawkes Ave | 0.22mi | 3/2.5 | 1,753 (+1%) | 0mo | $289,000 | $165 | 82 |
| 130 Wisconsin Ave | 0.39mi | 3/2.5 | 1,712 (-1%) | 0mo | $345,000 | $202 | 74 |
| 148 W Park Ave | 0.52mi | 3/1.5 | 1,750 (+1%) | 5mo | $228,500 | $131 | 68 |
| 149 S Cypress Ave | 0.40mi | 3/2.5 | 1,840 (+6%) | 2mo | $329,900 | $179 | 64 |
| 757 Bellows Ave | 0.68mi | 3/1.5 | 1,728 (-0%) | 4mo | $236,000 | $137 | 63 |
| 27 Dakota Ave | 0.23mi | 3/1.0 | 1,489 (-14%) | 4mo | $190,000 | $128 | 62 |
| 53 Rodgers Ave | 0.12mi | 4/1.5 (+1) | 1,480 (-15%) | 1mo | $75,000 | $51 | 62 |
| 72 Avondale Ave | 0.24mi | 3/2.0 | 1,518 (-12%) | 3mo | $255,000 | $168 | 62 |
| 763 W Rich St | 0.53mi | 3/2.0 | 1,672 (-4%) | 8mo | $75,000 | $45 | 59 |
| 63 Hayden Ave | 0.62mi | 3/2.5 | 1,672 (-4%) | 1mo | $345,000 | $206 | 58 |
| 300 S Cypress Ave | 0.59mi | 2/2.0 (-1) | 1,529 (-12%) | 3mo | $255,000 | $167 | 42 |
| 119 Dana Ave | 0.64mi | 3/2.0 | 1,506 (-13%) | 6mo | $125,000 | $83 | 39 |
Match score weights: distance 35% · size 25% · config 20% · recency 20%. Top-matched comps best support the ARV.
Projected returns pro-forma
10.0% appreciation · 3.0% rent growth · sell at horizon
- IRR
- 70.3%
- Equity multiple
- 6.01×
- Total profit
- $91,250
- Equity at exit
- $58,557
- IRR
- 64.0%
- Equity multiple
- 13.36×
- Total profit
- $224,867
- Equity at exit
- $126,281
Cash invested: $18,200 (down + closing). Projections, not guarantees.
Landlord ↔ Tenant lean methodology
- Overall (STATE)
- 73 Landlord-Friendly
- State Ohio
- 73 Landlord-Friendly · R+6
- County
- — inherits STATE
- City
- — inherits STATE
ZIP-level market 43222
- Active inventory
- 50
- Price-to-rent
- 3.2×
Monthly cashflow live
- Estimated rent
- $1,678 high interval (Pro) →
- Mortgage (P&I)
- −$341
- Tax est. 1.5%
- −$81 /mo · $975/yr
- Insurance
- −$27
- HOA
- −$0
- Vacancy / Maint / Mgmt
- −$352
- Net cashflow
- $876
Break-even live
UW: 25.0% down · 7.5% · 30yr · 1.5% tax · 5.0% vac · 8.0% maint · 8.0% mgmt
Financing live
Cash to close
- Down payment
- $16,250
- Closing costs
- $1,950
- Reserves months
- —
- Total cash needed
- —
Loan-product check · same deal, 3 products live
Conventional
25% down · 7.5% · 30yr
- Down + closing
- —
- Monthly P&I
- —
- Monthly cashflow
- —
- DSCR
- —
- Eligible?
- —
Personal DTI + credit; lowest rate.
DSCR
20% down · 8.5% · 30yr
- Down + closing
- —
- Monthly P&I
- —
- Monthly cashflow
- —
- DSCR
- —
- Eligible?
- —
No personal income docs; deal must DSCR.
Hard money
10% down · 12.0% · 12mo
- Down + closing
- —
- Monthly P&I
- —
- Monthly cashflow
- —
- DSCR
- —
- Eligible?
- —
Short-term bridge; refi at stabilization.
Rent comps 40 comps
| Address | Beds | Baths | Sqft | Rent | $/sqft | DOM | Units | Dist |
|---|---|---|---|---|---|---|---|---|
| 76 Rodgers Ave Columbus, OH | 3.0 | 1.5 | 1422 | $1,695 | $1.19 | 23d | 1 | 0.09mi |
| 60 Martin Ave Columbus, OH | 3.0 | 2.0 | 1807 | $1,650 | $0.91 | 23d | 1 | 0.22mi |
| 125 Avondale Ave Columbus, OH | 3.0 | 1.5 | 1344 | $1,695 | $1.26 | 43d | 1 | 0.32mi |
| 85 N Yale Ave Columbus, OH | 3.0 | 1.0 | 1215 | $1,100 | $0.91 | 7d | 1 | 0.35mi |
| 85 N Yale Ave Columbus, OH | 3.0 | 1.0 | 1215 | $1,100 | $0.91 | 19d | 1 | 0.35mi |
| 135-137 Dakota Ave Unit 135 Columbus, OH | 3.0 | 1.5 | 2200 | $1,800 | $0.82 | 43d | 1 | 0.36mi |
| 158 Dakota Ave Columbus, OH | 4.0 | 2.0 | 1800 | $2,045 | $1.14 | 7d | 1 | 0.37mi |
| 162 Wisconsin Ave Columbus, OH | 4.0 | 2.5 | 1930 | $1,900 | $0.98 | 43d | 1 | 0.39mi |
| 153 S Cypress Ave Columbus, OH | 3.0 | 1.0 | 1472 | $1,650 | $1.12 | 7d | 1 | 0.40mi |
| 185 S Cypress Ave Columbus, OH | 2.0 | 1.0 | 1104 | $1,695 | $1.54 | 43d | 1 | 0.43mi |
| 121 Chicago Ave Columbus, OH | 2.0 | 2.0 | 1234 | $1,550 | $1.26 | 43d | 1 | 0.47mi |
| 129 Chicago Ave Columbus, OH | 2.0 | 2.5 | 1260 | $1,895 | $1.50 | 23d | 1 | 0.48mi |
| 821 W Rich St Unit 821 Columbus, OH | 2.0 | 1.0 | 1078 | $1,175 | $1.09 | 23d | 1 | 0.49mi |
| 827 W Rich St Unit 827 Columbus, OH | 2.0 | 1.0 | 1078 | $1,175 | $1.09 | 23d | 1 | 0.49mi |
| 622 W State St Columbus, OH | 2.0 | 2.0 | 1200 | $2,190 | $1.82 | 17d | 1 | 0.52mi |
| 51 N Princeton Ave Columbus, OH | 3.0 | 1.0 | 1188 | $1,175 | $0.99 | 23d | 1 | 0.54mi |
| 189 W Park Ave Unit 189 Columbus, OH | 3.0 | 2.0 | 1276 | $1,395 | $1.09 | 7d | 1 | 0.59mi |
| 741 Sullivant Ave Columbus, OH | 2.0 | 1.5 | 1250 | $1,290 | $1.03 | 23d | 1 | 0.63mi |
| 501 W Broad St Columbus, OH | 3.0 | 1.0–2.5 | 1166 | $3,649 | $3.13 | 1d | 52 | 0.64mi |
| 501 W Broad St Columbus, OH | 3.0 | 1.0–2.5 | 1166 | $3,599 | $3.09 | 43d | 15 | 0.64mi |
| 378 Hawkes Ave Columbus, OH | 3.0 | 2.0 | 1200 | $1,649 | $1.37 | 23d | 1 | 0.66mi |
| 257 S Skidmore St Columbus, OH | 3.0 | 2.0 | 1224 | $1,895 | $1.55 | 43d | 1 | 0.68mi |
| 163 N Central Ave Columbus, OH | 2.0 | 2.5 | 1100 | $1,650 | $1.50 | 43d | 1 | 0.69mi |
| 120 S Central Ave Columbus, OH | 1.0–3.0 | 1.0–2.0 | 944 | $1,295 | $1.37 | 14d | 12 | 0.71mi |
| 274 S Skidmore St Columbus, OH | 2.0 | 1.0 | 1402 | $1,695 | $1.21 | 43d | 1 | 0.71mi |
| 433 W Broad St Columbus, OH | 2.0 | 1.0–2.0 | 975 | $3,371 | $3.46 | 1d | 35 | 0.74mi |
| 285 S Gift St Columbus, OH | 3.0 | 2.0 | 1641 | $1,700 | $1.04 | 23d | 1 | 0.74mi |
| 285 S Gift St Columbus, OH | 3.0 | 2.0 | 1641 | $1,700 | $1.04 | 15d | 1 | 0.74mi |
| 509 W Rich St Columbus, OH | 2.0 | 1.0–2.0 | 870 | $2,370 | $2.72 | 7d | 76 | 0.77mi |
| 137 N Guilford Ave Columbus, OH | 4.0 | 2.0 | 1456 | $1,850 | $1.27 | 43d | 1 | 0.78mi |
| 58 Stevens Ave Columbus, OH | 3.0 | 1.0 | 1176 | $1,250 | $1.06 | 43d | 1 | 0.82mi |
| 32 Schultz Ave Columbus, OH | 3.0 | 1.0 | 1218 | $1,250 | $1.03 | 21d | 1 | 0.88mi |
| 228 Schultz Ave Unit 1407024P Columbus, OH | 4.0 | 1.5 | 1991 | $6,208 | $3.12 | 14d | 1 | 0.91mi |
| 401 W Rich St Columbus, OH | 1.0–2.0 | 1.0–2.0 | 957 | $2,383 | $2.49 | 1d | 18 | 0.91mi |
| 644 Chlois Ln Columbus, OH | 1.0–3.0 | 1.0–2.0 | 985 | $3,085 | $3.13 | 1d | 15 | 0.93mi |
| 394 S Guilford Ave Columbus, OH | 3.0 | 1.5 | 1404 | $1,450 | $1.03 | 7d | 1 | 0.99mi |
| 250 W Spring St #713 Columbus, OH | 2.0 | 2.5 | 1638 | $5,250 | $3.21 | 43d | 1 | 1.00mi |
| 250 W Spring St #1214 Columbus, OH | 2.0 | 2.5 | 2124 | $7,000 | $3.30 | 17d | 1 | 1.00mi |
| 250 Daniel Burnham Sq #305 Columbus, OH | 2.0 | 2.0 | 1338 | $3,395 | $2.54 | 23d | 1 | 1.05mi |
| 1314 City View Dr Columbus, OH | 1.0–3.0 | 1.0–2.0 | 961 | $3,539 | $3.68 | 1d | 51 | 1.07mi |
Listing history 10 events
-
2026-06-18days on market $65,000 Active 12 DOM
-
2026-06-17days on market $65,000 Active 11 DOM
-
2026-06-16days on market $65,000 Active 10 DOM
-
2026-06-15days on market $65,000 Active 9 DOM
-
2026-06-13days on market $65,000 Active 7 DOM
-
2026-06-13pricedays on market $65,000 Active 6 DOM
-
2026-06-09days on market $75,000 Active 3 DOM
-
2026-06-08days on market $75,000 Active 2 DOM
-
2026-06-07remarks 238-char remark
-
2026-06-07$75,000 Active 1 DOM
ⓘ Source: listings_history table (triggers on properties + properties_extension) + one-shot
backfill from property_details.listing_events for pre-trigger history.
Climate risk First Street
- Flood 1/10 Low FEMA zone X · 0% chance over 30 yrs
- Wildfire 1/10 Low
- Heat 4/10 Moderate 7 d/yr ≥100°F today · 18 d/yr by 30 yrs out
- Wind 2/10 Low 100% chance of damaging wind over 30 yrs
- Air quality 3/10 Moderate 2 unhealthy d/yr today · 4 by 30 yrs out
Nearby sold comps map
Loading sold comps map…
Walkable amenities ~0.75 mi
Loading nearby amenities…
Taxation est. · year 1
- Rental income
- $20,137
- − Mortgage interest
- −$3,641
- − Property taxes
- −$975
- − Insurance
- −$325
- − Repairs & maintenance
- −$1,611
- − Management
- −$1,611
- − Depreciation
- −$1,891
- Taxable income
- $10,083
- Est. tax owed @ 24.0%
- −$2,420
- After-tax cash flow
- $8,098/yr
For passive investors: Depreciation is non-cash, so a rental often shows a tax loss while cash-flowing — sheltering income. Rental losses are passive: they offset passive income freely, and up to $25,000/yr can offset ordinary (W-2) income if you actively participate and your MAGI is under $100k (phasing out to $0 by $150k); unused losses carry forward. On sale, claimed depreciation is recaptured at up to 25%, and gains may owe capital-gains tax (a 1031 exchange can defer both). Figures are a year-1 estimate at your 24.0% rate — not tax advice; consult a CPA.
Condition & rehab AI · 7 photos
This property requires extensive repairs and a complete renovation to become habitable and marketable.
Repairs flagged
- Major roof — Significant damage and visible leaks
- Major exterior siding — Weathered and peeling
- Major windows — Missing or broken windows
Value-add opportunities
- Both New roof — Critical to prevent further water damage and improve safety
- Both New exterior siding — Enhances curb appeal and structural integrity
- Both New windows — Improves energy efficiency and safety
Renovation cost estimate screening
| Repair item | Severity | Est. cost |
|---|---|---|
| roof · Significant damage and visible leaks | Major | $15,000–50,000 |
| exterior siding · Weathered and peeling | Major | $15,000–50,000 |
| windows · Missing or broken windows | Major | $15,000–50,000 |
| Total estimated repair cost · 3 items | $45,000–150,000 |
Value-add ROI direction
- Both New roof — Critical to prevent further water damage and improve safety ↑
- Both New exterior siding — Enhances curb appeal and structural integrity ↑
- Both New windows — Improves energy efficiency and safety ↑
ⓘ Cost ranges are severity-bucket heuristics (US national rule-of-thumb). Get contractor quotes + a written scope before underwriting a rehab budget.
Schools (NCES district)
- District
- Columbus City School District
- NCES district ID
- 3904380
- Math proficiency
- 15% ▼ -17.00%
- Reading proficiency
- 26% ▼ -12.00%
- Median HH income
- $38,483
- Composite
- 17.19/100
- National rank
- #9105
- State rank
- #626 of 656 in OH
Livability — Columbus
- Score
- 81/100
- State rank
- #97
- US rank
- #1491
Category grades
Schools grade is shown separately in the Schools card above.
Census & demographics
- Census place
- Columbus, OH
- County
- Franklin County · 1,351,780 people
- City population
- 612,189
- Metro
- Columbus, OH
- Population (ZIP)
- 4,819
- Household income
- $32,321
- Rent vs Own
- Severe rent burden
- 126.0
Population outlook (Franklin County) Hauer SSP2
- Today (2025)
- 1,456,139 people
- By 2030
- 1,556,890 · +6.9%
- By 2040
- 1,757,349 · +20.7%
- By 2050
- 1,950,539 · +34.0%
- By 2075
- 2,376,171 · +63.2%
- By 2100
- 2,636,796 · +81.1%
Race, ethnicity, and origin ACS 2023
- Neighborhood character
- Highly diverse neighborhood (Simpson 0.71)
- Race & ethnicity
- White 43% Hispanic / Latino 28% Two or more races 21% Black 18% Asian 2%
- Hispanic origin (detail)
- Mexican 1% Puerto Rican 16% Dominican 5%
- Common ancestry
- Lithuanian 1% Slovak 1% Ukrainian 1%
- Foreign-born
- 8% · Canada, South Korea
- Languages at home
- 86% English-only · Spanish 11% Korean 1% Russian/Polish/Slavic 0%
Political lean MEDSL · Franklin
- 2024 margin
- Strong D (+28.4) · D 63.7% · R 35.3% · Other 1.0%
- 2008→2024 swing
- +7.7pp toward D · 2008: 20.7pp · 2024: 28.4pp
- All cycles
- 2024: D+28.4 2020: D+31.4 2016: D+25.9 2012: D+21.7 2008: D+20.7
Not yet ingested
- Civics
- —
Market trends
- HPI YoY
- ▲ 231.44%
- Current HPI
- 654.0855
- Rent YoY
- —
- Metro
- Columbus, OH
- State GDP YoY
- ▲ 1.98%
- F500 in state
- 48
Industry mix (Fortune 500 HQ in OH)
| Industry | F500 HQs | Revenue |
|---|---|---|
| Insurance | 3 | $145B |
|
||
| Industrial Machinery | 3 | $49B |
|
||
| Financial Services | 3 | $24B |
|
||
| Consumer Goods | 2 | $93B |
|
||
| Aerospace / Defense | 2 | $47B |
|
||
| Utilities | 2 | $33B |
|
||
Price history
+296.8% since first listed13 events — show timeline
- 2026-06-06 Listed $75,000 CBRMLS
- 2009-01-01 Listing Removed — CBRMLS
- 2008-06-03 Listed $13,500 CBRMLS
- 2001-06-28 Listing Removed — CBRMLS
- 2001-01-23 Listed $33,000 CBRMLS
- 2000-12-30 Listing Removed — CBRMLS
- 2000-09-07 Listed $33,000 CBRMLS
- 2000-06-27 Listing Removed — CBRMLS
- 2000-02-07 Listed $39,900 CBRMLS
- 1999-06-13 Listing Removed — CBRMLS
- 1998-11-21 Listed $39,900 CBRMLS
- 1995-06-28 Listing Removed — CBRMLS
- 1994-12-30 Listed $18,900 CBRMLS
Cash-flow waterfall
monthlySold comps — $/sqft
last 12 mo · ≤1 miLoading sold comps…