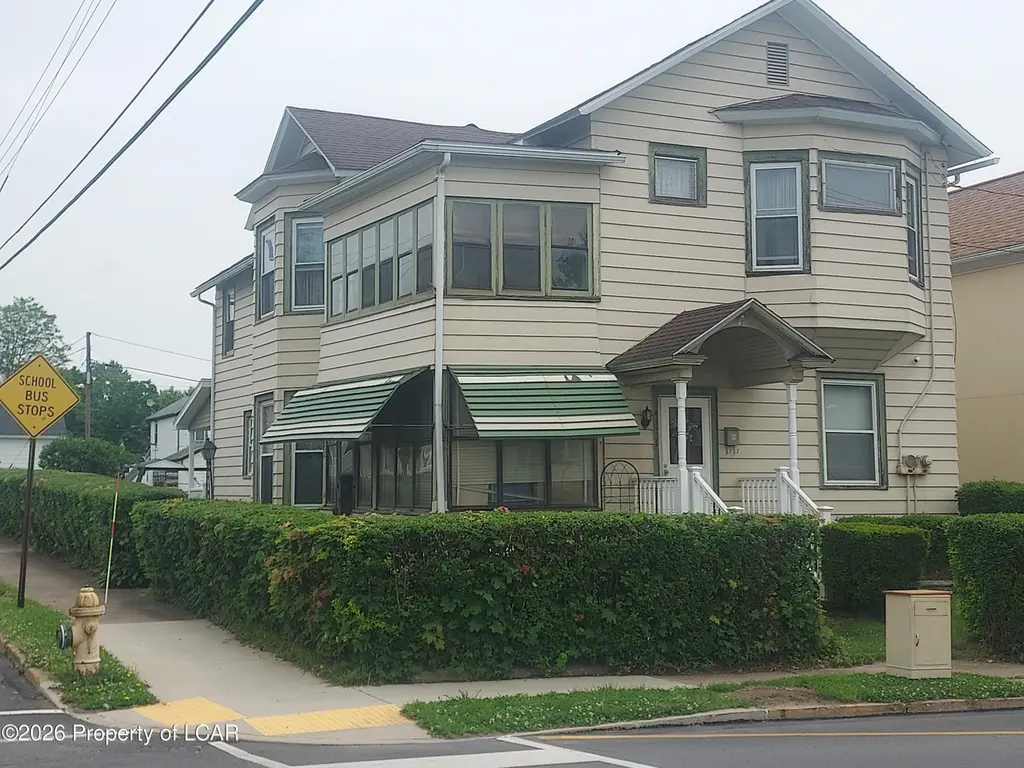
417 Bennett St · Luzerne, PA
Flood risk 6/10 · Moderate
- FEMA flood zone
- X (unshaded)
- Chance of flooding over 30 yrs
- 0.27%
- Est. flood insurance / yr
- $507 – $1,088
Fire risk 3/10 · Minor
- Est. fire insurance / yr
- $511 – $949
Heat risk 4/10 · Minor
- Hot days now (above 97°F)
- 7 days/yr
- Hot days in 30 yrs
- 16 days/yr
Wind risk 3/10 · Minor
- Chance of severe wind over 30 yrs
- 5.0%
Air-quality risk 3/10 · Minor
- Unhealthy air days now
- 2 days/yr
- Unhealthy air days in 30 yrs
- 4 days/yr
Risk factors via First Street. Map © Google.
Why this score? — see what drove the B+ grade
The composite is a weighted blend of 9 inputs, each scored 0–100. Each bar is that input's sub-score; the figure is the points it added to the 100-point composite (weight × sub-score).
- Cash flow +25.0/30.0
- ARV discount +15.0/15.0
- Appreciation +10.0/10.0
- DSCR +8.2/10.0
- 1% rule +6.1/10.0
- Livability +3.8/5.0
- Rent growth +2.5/5.0
- Schools +2.5/10.0
- Condition / age +2.5/5.0
$159,900
🖨 Deal sheet 📄 Offer letter ✓ Due diligence
Listing remarks
Spacious 2-story home offering character, flexibility, and value! Formerly a duplex, now converted to a single, this property features 3 bedrooms and 1.5 baths with plenty of living space throughout. Enjoy the convenience of 2 enclosed porches, an open porch with composite decking and railings & a large wood deck-perfect for relaxing or entertaining. Most windows have been replaced. Low taxes!
Key facts
- Large wood deck
- 2 enclosed porches
- 7,405 sq ft lot
Tags
Property features AI
Exterior
- Parking: Detached 3-car garage
- Utilities: Public water; Public sewer
- Home design: Single-family residence; Two levels
- Construction: Aluminum siding
- Exterior features: Deck; Porch
Interior
- Kitchen: Eat-in layout; Gas water heater
- Flooring: Hardwood floors
- Bathrooms: 1 full bathroom; 1 half bathroom
- Heating & cooling: Natural gas heating; Forced air
- Interior features: Eat-in kitchen; Full, unfinished basement
Neighborhood map
What this means for you Summary
Snapshot
- This is a 3-bed/1.5-bath single-family listed at $160k.
Deal economics
- At list price, monthly cash flow is $348 ($4k/yr) — positive.
- The deal already cash-flows at list — no discount required.
- Meets the 1% rule at list price ($2k rent vs $160k).
- Cap rate 8.9% vs local median 6.1% in Luzerne — top-decile yield for the area; either an underpriced asset or a hidden risk that comps aren't pricing in. Stress-test before assuming the spread holds.
Location & tenants
- Location reads 76/100 on livability (#391 in PA, #3,538 nationally) — a middle-class / working-renter tenant base. Strengths: crime A+, cost of living A+, housing A+; Watch: amenities C-, schools D+, commute F.
- Wyoming Valley West SD (suburban): math 18% / reading 42% proficiency, ranked #445 of 539 in PA (top 83%) — families likely to look elsewhere, expect single-tenant / working-renter base with shorter leases.
- Market conditions: 17 active listings in the ZIP; 8 comparable units currently listed for rent nearby; rentals at typical pace (median 21d on market — plan ~3-4 weeks tenant-placement turnaround); 349 units permitted in Luzerne County in 2024 (16 in 5+ unit buildings).
Forward outlook
- In year one you build about $17k of equity ($1k loan paydown + $16k appreciation (10.0% local appreciation)).
- Luzerne County population projected at +4% by 2050 — modest demand growth; plan on rents tracking national, not racing it.
- At projected returns (10.0% appreciation + 3.0% rent growth), your $45k cash investment doubles in ~3 years — after that, you're playing with house money.
- By year 3, paydown + projected appreciation supports a ~$43k cash-out refi (75% LTV) — recoverable capital for the next deal without selling this one.
Negotiation context
- Only 6 days on market — expect competitive offers; lowballing is unlikely to land.
Risks & watch-outs
- Watch-outs: built in 1900 — expect roof / HVAC / electrical / plumbing capex.
- Climate carrying-cost: major flood risk — expect insurance premiums to compound above CPI over the hold.
Questions for the listing agent
- Built in 1900 — when were the roof, HVAC, electrical panel, plumbing, and water heater last replaced?
- Is there a deadline driving the sale (1031 exchange, divorce, estate, relocation)? That informs how much negotiation room exists.
- Schools are D-rated, which usually means shorter tenancies and higher turnover. Who's the typical renter profile here, and what's been the actual vacancy rate?
- What's the average days-on-market for RENTAL listings here right now (not sales)? A rising rental-DOM trend means longer vacancies and softer asking-rent achievability than the comps imply.
- What's the recent tenant-quality profile in this submarket — average credit score on applications, eviction rate, late-payment / NSF rate, and stable-employment percentage? A property-management company in the area should have these aggregated.
- How much new for-sale + rental construction is in the pipeline within 1–3 miles? Heavy new supply typically softens prices + rents 12–24 months out; constrained supply supports both.
Investment metrics
- 1% rule
- 1.11% ✓
- Cap rate
- 8.91%
- Cash-on-cash
- 9.34%
- DSCR
- 1.42
- GRM
- 7.5
CMA / ARV
- ARV (on-the-fly)
- $264,822
- Comps found
- 7
Show comp detail 7 sales within ~0.75 mi
| Address | Dist | Beds/Ba | Sqft | Sold | Price | $/sf | Match |
|---|---|---|---|---|---|---|---|
| 22 Pettebone St | 0.54mi | 3/1.5 | 2,300 (-1%) | 1mo | $305,000 | $133 | 72 |
| 32 Hughes St | 0.31mi | 3/1.0 | 2,162 (-7%) | 9mo | $213,000 | $99 | 64 |
| 756 Bennett St | 0.53mi | 4/2.0 (+1) | 2,126 (-8%) | 16mo | $110,000 | $52 | 40 |
| 51 Pettebone St | 0.53mi | 4/1.5 (+1) | 2,001 (-14%) | 8mo | $228,000 | $114 | 40 |
| 464 Grove St | 0.61mi | 2/2.5 (-1) | 2,120 (-9%) | 15mo | $335,000 | $158 | 35 |
| 846 Bennett St | 0.65mi | 4/1.5 (+1) | 2,034 (-12%) | 18mo | $207,500 | $102 | 29 |
| 37 E Bennett St | 0.72mi | 4/1.5 (+1) | 2,032 (-12%) | 23mo | $255,000 | $125 | 21 |
Match score weights: distance 35% · size 25% · config 20% · recency 20%. Top-matched comps best support the ARV.
Projected returns pro-forma
10.0% appreciation · 3.0% rent growth · sell at horizon
- IRR
- 31.1%
- Equity multiple
- 3.44×
- Total profit
- $109,278
- Equity at exit
- $144,051
- IRR
- 26.9%
- Equity multiple
- 7.80×
- Total profit
- $304,348
- Equity at exit
- $310,651
Cash invested: $44,772 (down + closing). Projections, not guarantees.
Landlord ↔ Tenant lean methodology
- Overall (STATE)
- 62 Landlord-Friendly
- State Pennsylvania
- 62 Landlord-Friendly · EVEN
- County
- — inherits STATE
- City
- — inherits STATE
ZIP-level market 18709
- Home prices YoY
- 12.7%
- Active inventory
- 17
- Price-to-rent
- 7.5×
Monthly cashflow live
- Estimated rent
- $1,780 high interval (Pro) →
- Mortgage (P&I)
- −$839
- Tax from tax record
- −$152 /mo · $1,828/yr
- Insurance
- −$67
- HOA
- −$0
- Vacancy / Maint / Mgmt
- −$374
- Net cashflow
- $348
Break-even live
UW: 25.0% down · 7.5% · 30yr · 1.5% tax · 5.0% vac · 8.0% maint · 8.0% mgmt
Financing live
Cash to close
- Down payment
- $39,975
- Closing costs
- $4,797
- Reserves months
- —
- Total cash needed
- —
Loan-product check · same deal, 3 products live
Conventional
25% down · 7.5% · 30yr
- Down + closing
- —
- Monthly P&I
- —
- Monthly cashflow
- —
- DSCR
- —
- Eligible?
- —
Personal DTI + credit; lowest rate.
DSCR
20% down · 8.5% · 30yr
- Down + closing
- —
- Monthly P&I
- —
- Monthly cashflow
- —
- DSCR
- —
- Eligible?
- —
No personal income docs; deal must DSCR.
Hard money
10% down · 12.0% · 12mo
- Down + closing
- —
- Monthly P&I
- —
- Monthly cashflow
- —
- DSCR
- —
- Eligible?
- —
Short-term bridge; refi at stabilization.
Rent comps 8 comps
| Address | Beds | Baths | Sqft | Rent | $/sqft | DOM | Units | Dist |
|---|---|---|---|---|---|---|---|---|
| 147 W Dorrance St Kingston, PA | 3.0 | 1.5 | 2000 | $1,900 | $0.95 | 21d | 1 | 0.55mi |
| 6 Gershom Pl Kingston, PA | 2.0 | 2.5 | 2000 | $2,350 | $1.18 | 43d | 1 | 0.79mi |
| 321 Shoemaker St Kingston, PA | 3.0 | 1.5 | 1598 | $1,750 | $1.10 | 21d | 1 | 0.96mi |
| 255 Zerby Ave Kingston, PA | 3.0 | 1.0 | 2380 | $1,350 | $0.57 | 21d | 1 | 0.98mi |
| 54 Butler St Kingston, PA | 4.0 | 2.5 | 2174 | $2,000 | $0.92 | 43d | 1 | 1.07mi |
| 365 N Maple Ave Kingston, PA | 3.0 | 1.0 | 1600 | $1,400 | $0.88 | 21d | 1 | 1.08mi |
| 56 E Grove St Kingston, PA | 3.0 | 2.0 | 2296 | $1,250 | $0.54 | 21d | 1 | 1.24mi |
| 58 Jackson St Kingston, PA | 4.0 | 2.0 | 1600 | $2,000 | $1.25 | 43d | 1 | 1.39mi |
Listing history 6 events
-
2026-06-05statusdays on market $159,900 Pending 6 DOM
-
2026-06-02days on market $159,900 Active 5 DOM
-
2026-06-01days on market $159,900 Active 4 DOM
-
2026-05-31days on market $159,900 Active 3 DOM
-
2026-05-30days on market $159,900 Active 2 DOM
-
2026-05-27$159,900 Active
ⓘ Source: listings_history table (triggers on properties + properties_extension) + one-shot
backfill from property_details.listing_events for pre-trigger history.
Tax reassessment forecast PA · Partial reset (capped growth)
- Current annual tax
- $1,828 · $152/mo
- Projected year-2 tax
- $2,177 · $181/mo
- Expected delta
- +$349/yr (+$29/mo · 19.1%)
ⓘ Screening estimate from a state-policy table — verify with the county assessor before closing.
Climate risk First Street
- Flood 6/10 Major FEMA zone X (unshaded) · 27% chance over 30 yrs
- Wildfire 3/10 Moderate
- Heat 4/10 Moderate 7 d/yr ≥97°F today · 16 d/yr by 30 yrs out
- Wind 3/10 Moderate 5% chance of damaging wind over 30 yrs
- Air quality 3/10 Moderate 2 unhealthy d/yr today · 4 by 30 yrs out
Nearby sold comps map
Loading sold comps map…
Walkable amenities ~0.75 mi
Loading nearby amenities…
Taxation est. · year 1
- Rental income
- $21,357
- − Mortgage interest
- −$8,957
- − Property taxes
- −$1,828
- − Insurance
- −$800
- − Repairs & maintenance
- −$1,709
- − Management
- −$1,709
- − Depreciation
- −$4,652
- Taxable income
- $1,703
- Est. tax owed @ 24.0%
- −$409
- After-tax cash flow
- $3,773/yr
For passive investors: Depreciation is non-cash, so a rental often shows a tax loss while cash-flowing — sheltering income. Rental losses are passive: they offset passive income freely, and up to $25,000/yr can offset ordinary (W-2) income if you actively participate and your MAGI is under $100k (phasing out to $0 by $150k); unused losses carry forward. On sale, claimed depreciation is recaptured at up to 25%, and gains may owe capital-gains tax (a 1031 exchange can defer both). Figures are a year-1 estimate at your 24.0% rate — not tax advice; consult a CPA.
Schools (NCES district)
- District
- Wyoming Valley West SD
- NCES district ID
- 4225950
- Math proficiency
- 18% ▼ -11.00%
- Reading proficiency
- 42% ▼ -12.00%
- Median HH income
- $42,437
- Composite
- 25.38/100
- National rank
- #7470
- State rank
- #445 of 539 in PA
Livability — Luzerne
- Score
- 76/100
- State rank
- #391
- US rank
- #3538
Category grades
Schools grade is shown separately in the Schools card above.
Census & demographics
- Census place
- Luzerne, PA
- City population
- 2,959
- Population (ZIP)
- 2,959
Population outlook (Luzerne County) Hauer SSP2
- Today (2025)
- 319,505 people
- By 2030
- 319,943 · +0.1%
- By 2040
- 322,643 · +1.0%
- By 2050
- 330,817 · +3.5%
- By 2075
- 379,145 · +18.7%
- By 2100
- 431,908 · +35.2%
Race, ethnicity, and origin ACS 2023
- Neighborhood character
- Predominantly White (89%)
- Race & ethnicity
- White 89% Two or more races 6% Black 4% Hispanic / Latino 1%
- Common ancestry
- Romanian 18% Scotch-Irish 8% Iranian 4%
- Foreign-born
- 1%
- Languages at home
- 99% English-only · Other Indo-European 1%
Political lean MEDSL · Luzerne
- 2024 margin
- R (+19.2) · D 40.0% · R 59.2%
- 2008→2024 swing
- -27.6pp toward R · 2008: 8.4pp · 2024: -19.2pp
- All cycles
- 2024: R+19.2 2020: R+14.4 2016: R+19.6 2012: D+4.8 2008: D+8.4
Not yet ingested
- Civics
- —
Market trends
- HPI YoY
- ▲ 28.54%
- Current HPI
- 254.1718
- Rent YoY
- —
- Metro
- —
- State GDP YoY
- ▲ 1.68%
- F500 in state
- 34
Industry mix (Fortune 500 HQ in PA)
| Industry | F500 HQs | Revenue |
|---|---|---|
| Healthcare | 2 | $309B |
|
||
| Insurance | 2 | $27B |
|
||
| Telecommunications / Media | 1 | $124B |
|
||
| Industrial Distribution | 1 | $22B |
|
||
| Financial Services | 1 | $20B |
|
||
| Chemicals / Materials | 1 | $18B |
|
||
Price history
1 event — show timeline
- 2026-05-27 Listed $159,900 LCAR
Property tax history
+2.5%/yrLatest (2026): $1,828 · +0.7% YoY. Source: county tax records.
Cash-flow waterfall
monthlySold comps — $/sqft
last 12 mo · ≤1 miLoading sold comps…