 🏗️ New Construction
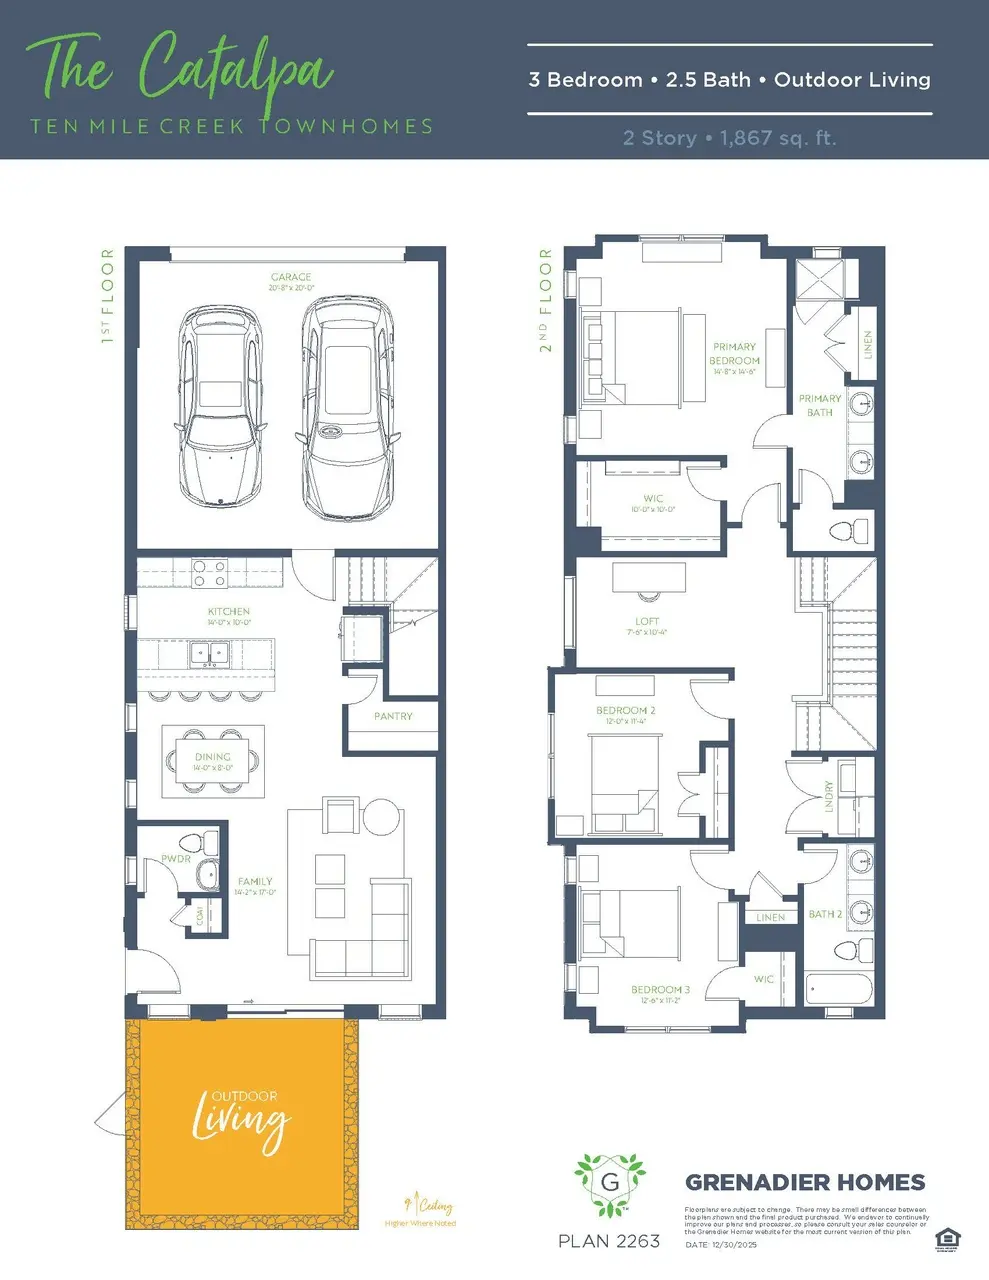
Catalpa Plan · Celina, TX
Flood risk No data
- FEMA flood zone
- —
- Chance of flooding over 30 yrs
- —
- Est. flood insurance / yr
- —
Fire risk No data
- Est. fire insurance / yr
- —
Heat risk No data
- Hot days now (above threshold)
- —
- Hot days in 30 yrs
- —
Wind risk No data
- Chance of severe wind over 30 yrs
- —
Air-quality risk No data
- Unhealthy air days now
- —
- Unhealthy air days in 30 yrs
- —
Risk factors via First Street. Map © Google.
Why this score? — see what drove the D- grade
The composite is a weighted blend of 9 inputs, each scored 0–100. Each bar is that input's sub-score; the figure is the points it added to the 100-point composite (weight × sub-score).
- Cash flow +10.8/30.0
- ARV discount +7.5/15.0
- Schools +5.0/10.0
- Livability +3.4/5.0
- 1% rule +3.2/10.0
- DSCR +3.1/10.0
- Rent growth +1.3/5.0
- Condition / age +1.0/5.0
- Appreciation +0.0/10.0
$339,900
🖨 Deal sheet (PDF) 📄 Offer letter ✓ Due diligence
Listing remarks MLS
An end unit with large gated patio, abundant windows and an upstairs loft.
Key facts
- Large gated patio
- Upstairs loft
- 2 parking spots
Tags
Neighborhood map
What this means for you Summary
Snapshot
- This is a 3-bed/2.5-bath townhouse listed at $340k. Condition is rated poor.
Deal economics
- At list price, monthly cash flow is $-167 ($-2k/yr) — negative.
- To cash-flow at today's rent, offer at most $338k (0.4% below list).
- To meet the 1% rule (rent ≥ 1% of price), the offer needs to be $296k (12.9% below list).
- Recommended offer: $296k (12.9% below list) — sets the bar for 1% rule.
- Cap rate 5.7% vs local median 2.8% in Celina — top-decile yield for the area; either an underpriced asset or a hidden risk that comps aren't pricing in. Stress-test before assuming the spread holds.
Location & tenants
- Location reads 68/100 on livability (#450 in TX) — a middle-class / working-renter tenant base. Strengths: employment A+, housing A+, crime A; Watch: cost of living C-, amenities F, commute F.
- Celina ISD (rural): math 50% / reading 61% proficiency, ranked #71 of 826 in TX (top 9%) — acceptable for families but not a draw, mixed tenant base, ~2y average lease.
- Zoned schools: Marcy B Lykins El (math 38% / reading 50%, grade F, #1,243 of 4,322 statewide, top 29%, 708 students, 22% FRL); Jerry & Linda Moore Middle (math 56% / reading 60%, grade B, #197 of 1,662 statewide, top 12%, 903 students, 20% FRL); Celina H S (math 44% / reading 72%, grade C, #320 of 1,632 statewide, top 20%, 1,074 students, 18% FRL).
- Market conditions: Rents falling (-4.6%/yr); 2927 active listings in the ZIP; 12 comparable units currently listed for rent nearby; rentals at typical pace (median 27d on market — plan ~3-4 weeks tenant-placement turnaround); 42% of comp listings sitting > 30 days — soft ceiling on asking rent; high-income renter base; 19,194 units permitted in Collin County in 2024 (3,988 in 5+ unit buildings).
Forward outlook
- Local home prices are declining (-3.0%/yr); year-one equity from $3k of loan paydown is wiped out by about $11k of value loss. Plan a longer hold.
- Collin County population projected at +60% by 2050 — long-run rental-demand tailwind backs the buy-and-hold thesis.
Negotiation context
- It's been on market 391 days — a 12% lower offer ($299k) is reasonable based on typical stale-listing flexibility.
- 2 sale attempts; this cycle's ask has dropped $60k (15%) from the opening price — seller is motivated, your offer sets the floor, not the list.
Questions for the listing agent
- What do current leases actually rent for vs. the listed asking? Can we see a recent rent roll and the last 12 months of T-12 income?
- It's been on market 391 days. Have you received any prior offers? Is the seller open to a 13% concession, seller financing, or rate buy-down credit?
- Have any recent inspections been done? Can we get a copy of the seller's disclosures and any deferred-maintenance estimates?
- Why hasn't it sold? Are there any deal-killer items the seller is aware of (foundation, flood, title, zoning, code violations)?
- Is there a deadline driving the sale (1031 exchange, divorce, estate, relocation)? That informs how much negotiation room exists.
- Schools are A-rated — typically a magnet for longer-tenancy family renters. What's the average tenant stay here, and is there a school-zone premium baked into asking?
- The area grade is low — what's the realistic commute time and amenity access for the typical tenant pool here? Any planned neighborhood developments (good or bad) we should know about?
- What's the average days-on-market for RENTAL listings here right now (not sales)? A rising rental-DOM trend means longer vacancies and softer asking-rent achievability than the comps imply.
- What's the recent tenant-quality profile in this submarket — average credit score on applications, eviction rate, late-payment / NSF rate, and stable-employment percentage? A property-management company in the area should have these aggregated.
- How much new for-sale + rental construction is in the pipeline within 1–3 miles? Heavy new supply typically softens prices + rents 12–24 months out; constrained supply supports both.
Investment metrics
- 1% rule
- 0.82% ✗
- Cap rate
- 5.74%
- Cash-on-cash
- -1.97%
- DSCR
- 0.91
- GRM
- 10.2
CMA / ARV
- ARV (median comp)
- $362,490
- List price
- $339,900
- Delta
- -6.23%
- Verdict
- FAIR
- Comps
- 6 within 1.0 mi
Show comp detail 6 sales within ~0.75 mi
| Address | Dist | Beds/Ba | Sqft | Sold | Price | $/sf | Match |
|---|---|---|---|---|---|---|---|
| 2016 Aldrich Mews | 0.02mi | 3/2.5 | 1,865 (-0%) | 0mo | $369,990 | $198 | 98 |
| 2005 Aldrich Mews | 0.03mi | 3/2.5 | 1,852 (-1%) | 1mo | $335,900 | $181 | 97 |
| 2009 Aldrich Mews | 0.02mi | 3/2.5 | 1,888 (+1%) | 2mo | $354,990 | $188 | 95 |
| 2025 Aldrich Mews | 0.00mi | 3/2.5 | 1,888 (+1%) | 5mo | $340,000 | $180 | 94 |
| 2000 Aldrich Mews | 0.04mi | 3/2.5 | 1,867 (0%) | 8mo | $389,000 | $208 | 92 |
| 2021 Aldrich Mews | 0.01mi | 3/2.5 | 1,852 (-1%) | 12mo | $399,000 | $215 | 88 |
Match score weights: distance 35% · size 25% · config 20% · recency 20%. Top-matched comps best support the ARV.
Projected returns pro-forma
-3.0% appreciation · 0.0% rent growth · sell at horizon
- IRR
- -23.0%
- Equity multiple
- 0.23×
- Total profit
- $-77,976
- Equity at exit
- $54,048
- IRR
- -28.0%
- Equity multiple
- -0.13×
- Total profit
- $-114,902
- Equity at exit
- $31,342
Cash invested: $101,497 (down + closing). Projections, not guarantees.
Landlord ↔ Tenant lean methodology
- Overall (STATE)
- 87 Strongly Landlord-Friendly
- State Texas
- 87 Strongly Landlord-Friendly · R+5
- County
- — inherits STATE
- City
- — inherits STATE
ZIP-level market 75009
- Home prices YoY
- -23.1%
- Rents YoY
- -4.6%
- Active inventory
- 2927
- Price-to-rent
- 9.6×
Monthly cashflow live
- Estimated rent
- $2,960 high interval (Pro) →
- Mortgage (P&I)
- −$1,901
- Tax est. 1.5%
- −$453 /mo · $5,437/yr
- Insurance
- −$151
- HOA
- −$0
- Vacancy / Maint / Mgmt
- −$622
- Net cashflow
- $-167
Break-even live
Sensitivity live
| Price | -10% $84 | -5% $-41 | +0% $-167 | +5% $-292 | +10% $-417 |
|---|---|---|---|---|---|
| Rent | -10% $-400 | -5% $-283 | +0% $-167 | +5% $-50 | +10% $67 |
| Rate | -1.0pp $16 | -0.5pp $-74 | base $-167 | +0.5pp $-260 | +1.0pp $-356 |
UW: 25.0% down · 7.5% · 30yr · 1.5% tax · 5.0% vac · 8.0% maint · 8.0% mgmt
Financing live
Cash to close
- Down payment
- $90,622
- Closing costs
- $10,875
- Reserves months
- —
- Total cash needed
- —
Loan-product check · same deal, 3 products live
Conventional
25% down · 7.5% · 30yr
- Down + closing
- —
- Monthly P&I
- —
- Monthly cashflow
- —
- DSCR
- —
- Eligible?
- —
Personal DTI + credit; lowest rate.
DSCR
20% down · 8.5% · 30yr
- Down + closing
- —
- Monthly P&I
- —
- Monthly cashflow
- —
- DSCR
- —
- Eligible?
- —
No personal income docs; deal must DSCR.
Hard money
10% down · 12.0% · 12mo
- Down + closing
- —
- Monthly P&I
- —
- Monthly cashflow
- —
- DSCR
- —
- Eligible?
- —
Short-term bridge; refi at stabilization.
Rent comps 12 comps
| Address | Beds | Baths | Sqft | Rent | $/sqft | DOM | Units | Dist |
|---|---|---|---|---|---|---|---|---|
| 2009 Brookhurst St Celina, TX | 4.0 | 3.0 | 2386 | $2,895 | $1.21 | 21d | 1 | 0.73mi |
| 1513 Mill Creek Way Celina, TX | 1.0–4.0 | 1.0–3.0 | 1385 | $2,682 | $1.94 | 0d | 12 | 0.75mi |
| 1637 Palo Duro Way Celina, TX | 4.0 | 3.0 | 2545 | $5,800 | $2.28 | 0d | 1 | 0.81mi |
| 2706 Boca Dr Prosper, TX | 4.0 | 3.0 | 2102 | $3,445 | $1.64 | 45d | 1 | 0.85mi |
| 1356 Hill Country Pl Celina, TX | 3.0 | 2.5 | 1888 | $2,500 | $1.32 | 45d | 1 | 0.95mi |
| 1325 Choate Pkwy Celina, TX | 1.0–3.0 | 1.0–2.0 | 1000 | $1,893 | $1.89 | 0d | 61 | 0.97mi |
| 2522 Runhappy Ct Celina, TX | 4.0 | 3.0 | 2395 | $3,500 | $1.46 | 45d | 1 | 1.02mi |
| 2432 Preakness Pl Celina, TX | 4.0 | 3.0 | 2309 | $3,500 | $1.52 | 45d | 1 | 1.09mi |
| 2600 Kinship Pkwy Celina, TX | 1.0–3.0 | 1.0–2.0 | 1067 | $1,962 | $1.84 | 0d | 47 | 1.20mi |
| 3008 Evergreen Trl Celina, TX | 4.0 | 3.0 | 2503 | $2,695 | $1.08 | 15d | 1 | 1.30mi |
| 912 Slate Ln Celina, TX | 4.0 | 2.0 | 1879 | $2,690 | $1.43 | 45d | 1 | 1.39mi |
| 3138 Casa Blanca St Celina, TX | 4.0 | 2.5 | 2368 | $3,000 | $1.27 | 26d | 1 | 1.49mi |
Listing history 19 events
-
2026-06-21days on market $339,900 Active 391 DOM
-
2026-06-18days on market $339,900 Active 388 DOM
-
2026-06-17days on market $339,900 Active 387 DOM
-
2026-06-16days on market $339,900 Active 386 DOM
-
2026-06-15days on market $339,900 Active 385 DOM
-
2026-06-13days on market $339,900 Active 383 DOM
-
2026-06-09days on market $339,900 Active 379 DOM
-
2026-06-08days on market $339,900 Active 378 DOM
-
2026-06-07days on market $339,900 Active 377 DOM
-
2026-06-04days on market $339,900 Active 374 DOM
-
2026-06-03days on market $339,900 Active 373 DOM
-
2026-06-02days on market $339,900 Active 372 DOM
-
2026-06-01days on market $339,900 Active 371 DOM
-
2026-05-31days on market $339,900 Active 370 DOM
-
2026-05-01price $339,900 74-char remark
Show marketing remark (74 chars)
An end unit with large gated patio, abundant windows and an upstairs loft.
-
2025-11-02status Active 74-char remark
Show marketing remark (74 chars)
An end unit with large gated patio, abundant windows and an upstairs loft.
-
2025-11-02price $389,990 74-char remark
Show marketing remark (74 chars)
An end unit with large gated patio, abundant windows and an upstairs loft.
-
2025-10-31historical 74-char remark
Show marketing remark (74 chars)
An end unit with large gated patio, abundant windows and an upstairs loft.
-
2025-05-24$399,990 Active 74-char remark
Show marketing remark (74 chars)
An end unit with large gated patio, abundant windows and an upstairs loft.
ⓘ Source: listings_history table (triggers on properties + properties_extension) + one-shot
backfill from property_details.listing_events for pre-trigger history.
Nearby sold comps map
Loading sold comps map…
Walkable amenities ~0.75 mi
Loading nearby amenities…
Taxation est. · year 1
- Rental income
- $35,522
- − Mortgage interest
- −$20,305
- − Property taxes
- −$5,437
- − Insurance
- −$1,812
- − Repairs & maintenance
- −$2,842
- − Management
- −$2,842
- − Depreciation
- −$10,545
- Taxable loss
- −$8,261
- Est. tax savings @ 24.0%
- +$1,983
- After-tax cash flow
- $-16/yr
For passive investors: Depreciation is non-cash, so a rental often shows a tax loss while cash-flowing — sheltering income. Rental losses are passive: they offset passive income freely, and up to $25,000/yr can offset ordinary (W-2) income if you actively participate and your MAGI is under $100k (phasing out to $0 by $150k); unused losses carry forward. On sale, claimed depreciation is recaptured at up to 25%, and gains may owe capital-gains tax (a 1031 exchange can defer both). Figures are a year-1 estimate at your 24.0% rate — not tax advice; consult a CPA.
Condition & rehab AI · 2 photos
This Catalpa townhouse requires extensive renovations across all systems and areas, with major repairs and maintenance needed. Significant updates to the kitchen, bathrooms, exterior, and HVAC system would substantially increase its resale and rental value.
Repairs flagged
- Major Kitchen — No photos of the kitchen
- Major Bathrooms — No photos of the bathrooms
- Major Roof — No photos of the roof
- Major Exterior — No photos of the exterior
- Major Flooring — No photos of the flooring
- Major Interior walls/paint — No photos of the interior walls/paint
- Major Windows — No photos of the windows
- Major Foundation/structure — No photos of the foundation/structure
- Major HVAC/mechanicals — No photos of the HVAC/mechanicals
- Major Landscaping/curb appeal — No photos of the landscaping/curb appeal
Value-add opportunities
- Both Kitchen renovation — A modern kitchen can significantly increase both resale and rental value
- Both Bathroom renovation — Upgraded bathrooms are a major selling point for both buyers and renters
- Both Exterior painting and landscaping — A fresh coat of paint and well-maintained landscaping can enhance curb appeal and property value
- Both HVAC system replacement — A new HVAC system ensures comfort and energy efficiency, attracting more buyers and renters
Renovation cost estimate screening
| Repair item | Severity | Est. cost |
|---|---|---|
| Kitchen · No photos of the kitchen | Major | $15,000–50,000 |
| Bathrooms · No photos of the bathrooms | Major | $15,000–50,000 |
| Roof · No photos of the roof | Major | $15,000–50,000 |
| Exterior · No photos of the exterior | Major | $15,000–50,000 |
| Flooring · No photos of the flooring | Major | $15,000–50,000 |
| Interior walls/paint · No photos of the interior walls/paint | Major | $15,000–50,000 |
| Windows · No photos of the windows | Major | $15,000–50,000 |
| Foundation/structure · No photos of the foundation/structure | Major | $15,000–50,000 |
| HVAC/mechanicals · No photos of the HVAC/mechanicals | Major | $15,000–50,000 |
| Landscaping/curb appeal · No photos of the landscaping/curb appeal | Major | $15,000–50,000 |
| Total estimated repair cost · 10 items | $150,000–500,000 |
Value-add ROI direction
- Both Kitchen renovation — A modern kitchen can significantly increase both resale and rental value ↑
- Both Bathroom renovation — Upgraded bathrooms are a major selling point for both buyers and renters ↑
- Both Exterior painting and landscaping — A fresh coat of paint and well-maintained landscaping can enhance curb appeal and property value ↑
- Both HVAC system replacement — A new HVAC system ensures comfort and energy efficiency, attracting more buyers and renters ↑
ⓘ Cost ranges are severity-bucket heuristics (US national rule-of-thumb). Get contractor quotes + a written scope before underwriting a rehab budget.
Schools (NCES district)
- District
- Celina ISD
- NCES district ID
- 4813290
- Math proficiency
- 50% ▼ -15.00%
- Reading proficiency
- 61% ▼ -5.00%
- Median HH income
- $83,282
- Composite
- 50.49/100
- National rank
- #1853
- State rank
- #71 of 826 in TX
Livability — Celina
- Score
- 68/100
- State rank
- #450
- US rank
- #9135
Category grades
Schools grade is shown separately in the Schools card above.
Census & demographics
- County
- Collin County · 1,159,394 people
- City population
- 34,260
- Metro
- Dallas-Fort Worth-Arlington, TX
- Population (ZIP)
- 34,260
- Household income
- $168,250
- Rent vs Own
- Severe rent burden
- 152.0
Population outlook (Collin County) Hauer SSP2
- Today (2025)
- 1,210,074 people
- By 2030
- 1,358,201 · +12.2%
- By 2040
- 1,654,061 · +36.7%
- By 2050
- 1,937,359 · +60.1%
- By 2075
- 2,567,039 · +112.1%
- By 2100
- 2,952,048 · +144.0%
Race, ethnicity, and origin ACS 2023
- Neighborhood character
- Diverse neighborhood (Simpson 0.56)
- Race & ethnicity
- White 64% Two or more races 11% Hispanic / Latino 11% Asian 11% Black 8%
- Hispanic origin (detail)
- Mexican 9%
- Common ancestry
- Slovak 5% Lithuanian 4% Romanian 1%
- Foreign-born
- 14% · China, Canada, Vietnam
- Languages at home
- 83% English-only · Spanish 6% Chinese 3% Other Asian/Pacific 3%
Political lean MEDSL · Collin
- 2024 margin
- R (+11.1) · D 43.1% · R 54.3% · Other 2.6%
- 2008→2024 swing
- +14.4pp toward D · 2008: -25.6pp · 2024: -11.1pp
- All cycles
- 2024: R+11.1 2020: R+4.3 2016: R+17.0 2012: R+31.6 2008: R+25.6
Not yet ingested
- Civics
- —
Market trends
- HPI YoY
- ▼ -83.07%
- Current HPI
- 276.6307
- Rent YoY
- ▼ -4.62%
- Metro
- Dallas-Fort Worth-Arlington, TX
- State GDP YoY
- ▲ 3.95%
- F500 in state
- 110
Industry mix (Fortune 500 HQ in TX)
| Industry | F500 HQs | Revenue |
|---|---|---|
| Energy | 16 | $1,198B |
|
||
| Technology | 5 | $198B |
|
||
| Engineering / Construction | 4 | $72B |
|
||
| Energy Services | 3 | $60B |
|
||
| Utilities | 3 | $41B |
|
||
| Healthcare | 2 | $330B |
|
||
Price history
-15.0% since first listed5 events — show timeline
- 2026-05-01 Price Changed $339,900 Zillow
- 2025-11-02 Relisted — Zillow
- 2025-11-02 Price Changed $389,990 Zillow
- 2025-10-31 Delisted — Zillow
- 2025-05-24 Listed $399,990 Zillow
Cash-flow waterfall
monthlySold comps — $/sqft
last 12 mo · ≤1 miLoading sold comps…