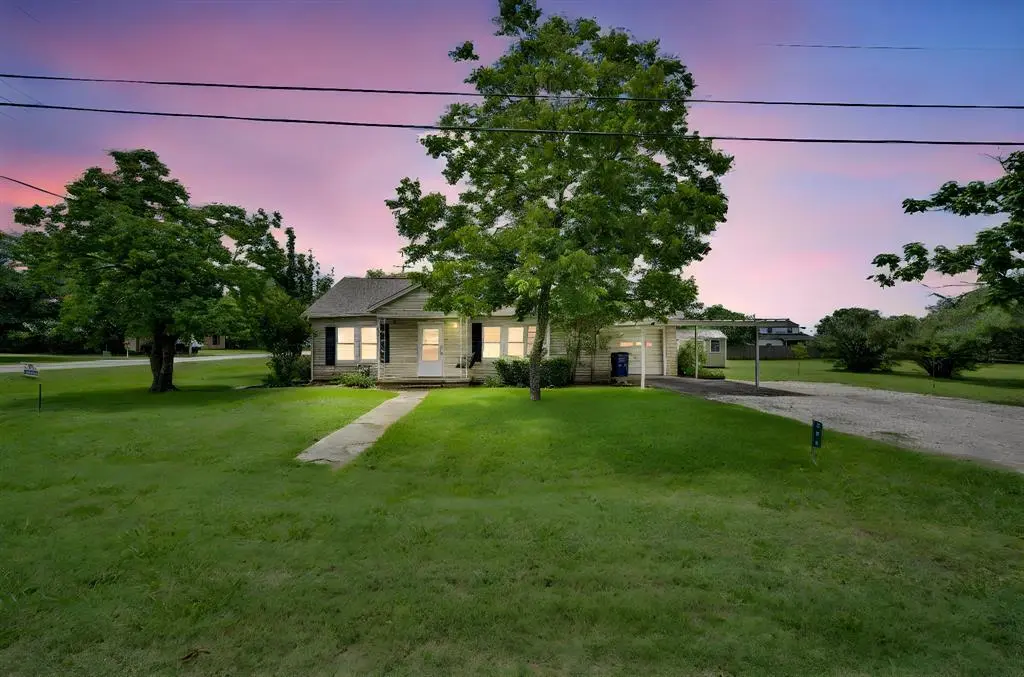
508 E Henderson St · Itasca, TX
Flood risk 1/10 · Minimal
- FEMA flood zone
- X (unshaded)
- Chance of flooding over 30 yrs
- 0.0%
- Est. flood insurance / yr
- $507 – $1,088
Fire risk 4/10 · Minor
- Est. fire insurance / yr
- $1,222 – $2,270
Heat risk 7/10 · Major
- Hot days now (above 109°F)
- 7 days/yr
- Hot days in 30 yrs
- 23 days/yr
Wind risk 6/10 · Moderate
- Chance of severe wind over 30 yrs
- 27.0%
Air-quality risk 2/10 · Minimal
- Unhealthy air days now
- 1 days/yr
- Unhealthy air days in 30 yrs
- 2 days/yr
Risk factors via First Street. Map © Google.
Why this score? — see what drove the B- grade
The composite is a weighted blend of 9 inputs, each scored 0–100. Each bar is that input's sub-score; the figure is the points it added to the 100-point composite (weight × sub-score).
- Cash flow +20.1/30.0
- ARV discount +15.0/15.0
- Appreciation +10.0/10.0
- DSCR +6.4/10.0
- 1% rule +5.1/10.0
- Livability +3.2/5.0
- Rent growth +2.5/5.0
- Schools +2.5/10.0
- Condition / age +2.5/5.0
$170,000
🖨 Deal sheet 📄 Offer letter ✓ Due diligence
Listing remarks
Bring your vision and creative touch to this spacious property, perfectly priced to allow room for repairs while building instant equity! Located just a few blocks from the ISD campus, this home has provided the current family many years worth of warm memories, just as it is, and it's ready for its next chapter. The highlight of this property is the incredible, dividable 150'x150' half-acre lot—providing a massive backyard canvas for outdoor living, expansion, potential income, or potential future development. Inside, the home features a highly functional layout. The welcoming living room offers quick, seamless access to both the kitchen and secondary bedrooms. The kitchen, featuring
Key facts
- 0.52 acre lot
- Garage
- Built 1949
Tags
Property features AI
Finance
- Other: Easements for drainage, electric, natural gas, utilities, and water lines; Will subdivide
- Financial info: Listing terms: Cash or Conventional
- HOA & community: No homeowners association
Exterior
- Parking: Covered parking (1 covered space); Converted garage with additional parking; Carport (1 space); Asphalt parking; 2-car single door configuration
- Utilities: City water; City sewer; Individual gas meter; Individual water meter; Overhead utilities; Asphalt access
- Home design: Single-family residence; One story; Accessible approach with ramp; Not attached to another property
- Construction: Composition roof; Fiber cement and stone/rock exterior with stone veneer; Pillar/post/pier foundation; Preowned construction
- Exterior features: Covered awning(s); Storage; Covered patio/porch; Shed(s); Large backyard with grass; Landscaped; Corner lot; Cleared
Interior
- Kitchen: Dishwasher; Disposal; Electric range
- Bedrooms: Primary bedroom on main level with ensuite bath and sitting area (approx. 29 x 12); Two additional bedrooms on main level (approx. 11 x 12 and 14 x 11)
- Flooring: Carpet; Linoleum; Luxury vinyl plank
- Bathrooms: Two bathrooms (including primary bathroom approx. 11 x 7; secondary bath approx. 7 x 8)
- Heating & cooling: Central heating; Electric heating; Natural gas heating; Central air; Ceiling fan(s); Wall/window unit(s)
- Interior features: Eat-in kitchen; Walk-in closet(s); One living area; Six total rooms
- Laundry & utility: Full-size washer/dryer area on site; Washer hookup; Electric dryer hookup; Electric water heater
Neighborhood map
What this means for you Summary
Snapshot
- This is a 3-bed/2.0-bath single-family listed at $170k.
Deal economics
- At list price, monthly cash flow is $213 ($3k/yr) — positive.
- The deal already cash-flows at list — no discount required.
- Meets the 1% rule at list price ($2k rent vs $170k).
- Cap rate 7.8% vs local median 5.7% in Itasca — top-decile yield for the area; either an underpriced asset or a hidden risk that comps aren't pricing in. Stress-test before assuming the spread holds.
Location & tenants
- Location reads 63/100 on livability (#832 in TX) — a middle-class / working-renter tenant base. Strengths: cost of living A+, housing A+, crime A-; Watch: employment D, amenities F, commute F.
- Itasca ISD (rural): math 23% / reading 35% proficiency, ranked #636 of 826 in TX (top 77%) — low school quality limits family demand, transient renter base, plan for 1-2y turnover; 63% free/reduced lunch — lower-income household profile, screen leases tightly.
- Zoned schools: Itasca El (math 17% / reading 32%, grade F, #3,052 of 4,322 statewide, top 74%, 295 students, 74% FRL).
- Market conditions: 83 active listings in the ZIP; 4 comparable units currently listed for rent nearby; rentals lingering (median 44d on market — plan ~5-8 weeks vacancy on turnover, expect pricing pressure); 75% of comp listings sitting > 30 days — soft ceiling on asking rent; 65 units permitted in Hill County in 2024 (0 in 5+ unit buildings).
Forward outlook
- In year one you build about $18k of equity ($1k loan paydown + $17k appreciation (10.0% local appreciation)).
- Hill County population projected at -12% by 2050 — secular population decline; favor cash flow + early exit over multi-decade hold.
- At projected returns (10.0% appreciation + 3.0% rent growth), your $48k cash investment doubles in ~3 years — after that, you're playing with house money.
- By year 3, paydown + projected appreciation supports a ~$46k cash-out refi (75% LTV) — recoverable capital for the next deal without selling this one.
Negotiation context
- Only 10 days on market — expect competitive offers; lowballing is unlikely to land.
Risks & watch-outs
- Watch-outs: built in 1949 — expect roof / HVAC / electrical / plumbing capex.
- Climate carrying-cost: major wind risk, 27% chance of damaging wind over 30y; extreme-heat days projected 7→23/yr by 2055 (HVAC capex compounding) — expect insurance premiums to compound above CPI over the hold.
Questions for the listing agent
- Built in 1949 — when were the roof, HVAC, electrical panel, plumbing, and water heater last replaced?
- Is there a deadline driving the sale (1031 exchange, divorce, estate, relocation)? That informs how much negotiation room exists.
- Schools are D-rated, which usually means shorter tenancies and higher turnover. Who's the typical renter profile here, and what's been the actual vacancy rate?
- What's the average days-on-market for RENTAL listings here right now (not sales)? A rising rental-DOM trend means longer vacancies and softer asking-rent achievability than the comps imply.
- What's the recent tenant-quality profile in this submarket — average credit score on applications, eviction rate, late-payment / NSF rate, and stable-employment percentage? A property-management company in the area should have these aggregated.
- How much new for-sale + rental construction is in the pipeline within 1–3 miles? Heavy new supply typically softens prices + rents 12–24 months out; constrained supply supports both.
Investment metrics
- 1% rule
- 1.01% ✓
- Cap rate
- 7.80%
- Cash-on-cash
- 5.37%
- DSCR
- 1.24
- GRM
- 8.3
CMA / ARV
- ARV (on-the-fly)
- $224,250
- Comps found
- 12
Show comp detail 12 sales within ~0.75 mi
| Address | Dist | Beds/Ba | Sqft | Sold | Price | $/sf | Match |
|---|---|---|---|---|---|---|---|
| 604 E South St | 0.08mi | 3/2.0 | 1,534 (+3%) | 3mo | $249,999 | $163 | 90 |
| 105 E North St | 0.41mi | 3/2.0 | 1,500 (+0%) | 2mo | $158,000 | $105 | 79 |
| 205 E South St | 0.27mi | 3/2.0 | 1,462 (-2%) | 7mo | $219,900 | $150 | 78 |
| 705 E South St | 0.17mi | 3/2.0 | 1,430 (-4%) | 10mo | $214,900 | $150 | 77 |
| 202 E Henderson St | 0.25mi | 3/2.0 | 1,485 (-1%) | 13mo | $198,000 | $133 | 77 |
| 512 Don Ln | 0.37mi | 3/2.0 | 1,501 (+0%) | 8mo | $249,900 | $166 | 75 |
| 104 Beard Dr | 0.29mi | 3/2.5 | 1,562 (+4%) | 3mo | $130,000 | $83 | 75 |
| 103 S Hooks St | 0.24mi | 3/2.0 | 1,416 (-5%) | 12mo | $282,000 | $199 | 70 |
| 605 S Files St | 0.29mi | 3/2.0 | 1,670 (+12%) | 4mo | $224,900 | $135 | 64 |
| 106 Don Ln | 0.33mi | 3/2.0 | 1,400 (-6%) | 13mo | $225,000 | $161 | 63 |
| 104 Don Ln | 0.33mi | 3/2.0 | 1,400 (-6%) | 14mo | $225,000 | $161 | 62 |
| 526 Don Ln | 0.35mi | 4/2.0 (+1) | 1,401 (-6%) | 10mo | $182,990 | $131 | 60 |
Match score weights: distance 35% · size 25% · config 20% · recency 20%. Top-matched comps best support the ARV.
Projected returns pro-forma
10.0% appreciation · 3.0% rent growth · sell at horizon
- IRR
- 28.2%
- Equity multiple
- 3.23×
- Total profit
- $106,152
- Equity at exit
- $153,149
- IRR
- 24.5%
- Equity multiple
- 7.34×
- Total profit
- $301,945
- Equity at exit
- $330,273
Cash invested: $47,600 (down + closing). Projections, not guarantees.
Landlord ↔ Tenant lean methodology
- Overall (STATE)
- 87 Strongly Landlord-Friendly
- State Texas
- 87 Strongly Landlord-Friendly · R+5
- County
- — inherits STATE
- City
- — inherits STATE
ZIP-level market 76055
- Home prices YoY
- 4.1%
- Active inventory
- 83
- Price-to-rent
- 8.3×
Monthly cashflow live
- Estimated rent
- $1,714 medium interval (Pro) →
- Mortgage (P&I)
- −$891
- Tax from tax record
- −$178 /mo · $2,141/yr
- Insurance
- −$71
- HOA
- −$0
- Vacancy / Maint / Mgmt
- −$360
- Net cashflow
- $213
Break-even live
UW: 25.0% down · 7.5% · 30yr · 1.5% tax · 5.0% vac · 8.0% maint · 8.0% mgmt
Financing live
Cash to close
- Down payment
- $42,500
- Closing costs
- $5,100
- Reserves months
- —
- Total cash needed
- —
Loan-product check · same deal, 3 products live
Conventional
25% down · 7.5% · 30yr
- Down + closing
- —
- Monthly P&I
- —
- Monthly cashflow
- —
- DSCR
- —
- Eligible?
- —
Personal DTI + credit; lowest rate.
DSCR
20% down · 8.5% · 30yr
- Down + closing
- —
- Monthly P&I
- —
- Monthly cashflow
- —
- DSCR
- —
- Eligible?
- —
No personal income docs; deal must DSCR.
Hard money
10% down · 12.0% · 12mo
- Down + closing
- —
- Monthly P&I
- —
- Monthly cashflow
- —
- DSCR
- —
- Eligible?
- —
Short-term bridge; refi at stabilization.
Rent comps 4 comps
| Address | Beds | Baths | Sqft | Rent | $/sqft | DOM | Units | Dist |
|---|---|---|---|---|---|---|---|---|
| 202 E Henderson St Itasca, TX | 3.0 | 2.0 | 1485 | $1,750 | $1.18 | 12d | 1 | 0.26mi |
| 108 E Adams St Itasca, TX | 3.0 | 2.0 | 1188 | $1,650 | $1.39 | 44d | 1 | 0.30mi |
| 111 Minnie Dr Itasca, TX | 3.0 | 2.0 | 1250 | $1,775 | $1.42 | 44d | 1 | 0.33mi |
| 106 W Adams St Itasca, TX | 3.0 | 2.0 | 1174 | $1,650 | $1.41 | 44d | 1 | 0.39mi |
Listing history 8 events
-
2026-06-18days on market $170,000 Active 10 DOM
-
2026-06-17days on market $170,000 Active 9 DOM
-
2026-06-16days on market $170,000 Active 8 DOM
-
2026-06-15days on market $170,000 Active 7 DOM
-
2026-06-13days on market $170,000 Active 5 DOM
-
2026-06-12days on market $170,000 Active 4 DOM
-
2026-06-09remarks 693-char remark
-
2026-06-09$170,000 Active 1 DOM
ⓘ Source: listings_history table (triggers on properties + properties_extension) + one-shot
backfill from property_details.listing_events for pre-trigger history.
Tax reassessment forecast TX · Resets to sale price
- Current annual tax
- $2,141 · $178/mo
- Projected year-2 tax
- $3,111 · $259/mo
- Expected delta
- +$970/yr (+$81/mo · 45.3%)
ⓘ Screening estimate from a state-policy table — verify with the county assessor before closing.
Climate risk First Street
- Flood 1/10 Low FEMA zone X (unshaded) · 0% chance over 30 yrs
- Wildfire 4/10 Moderate
- Heat 7/10 Severe 7 d/yr ≥109°F today · 23 d/yr by 30 yrs out
- Wind 6/10 Major 27% chance of damaging wind over 30 yrs
- Air quality 2/10 Low 1 unhealthy d/yr today · 2 by 30 yrs out
Nearby sold comps map
Loading sold comps map…
Walkable amenities ~0.75 mi
Loading nearby amenities…
Taxation est. · year 1
- Rental income
- $20,562
- − Mortgage interest
- −$9,523
- − Property taxes
- −$2,141
- − Insurance
- −$850
- − Repairs & maintenance
- −$1,645
- − Management
- −$1,645
- − Depreciation
- −$4,945
- Taxable loss
- −$187
- Est. tax savings @ 24.0%
- +$45
- After-tax cash flow
- $2,600/yr
For passive investors: Depreciation is non-cash, so a rental often shows a tax loss while cash-flowing — sheltering income. Rental losses are passive: they offset passive income freely, and up to $25,000/yr can offset ordinary (W-2) income if you actively participate and your MAGI is under $100k (phasing out to $0 by $150k); unused losses carry forward. On sale, claimed depreciation is recaptured at up to 25%, and gains may owe capital-gains tax (a 1031 exchange can defer both). Figures are a year-1 estimate at your 24.0% rate — not tax advice; consult a CPA.
Schools (NCES district)
- District
- Itasca ISD
- NCES district ID
- 4824480
- Math proficiency
- 23% ▼ -8.00%
- Reading proficiency
- 35% ▼ -1.00%
- Median HH income
- $49,224
- Composite
- 25.26/100
- National rank
- #7499
- State rank
- #636 of 826 in TX
Livability — Itasca
- Score
- 63/100
- State rank
- #832
- US rank
- #14977
Category grades
Schools grade is shown separately in the Schools card above.
Census & demographics
- Census place
- Itasca, TX
- City population
- 3,719
- Population (ZIP)
- 3,719
Population outlook (Hill County) Hauer SSP2
- Today (2025)
- 34,013 people
- By 2030
- 33,289 · -2.1%
- By 2040
- 31,688 · -6.8%
- By 2050
- 30,100 · -11.5%
- By 2075
- 26,818 · -21.2%
- By 2100
- 22,918 · -32.6%
Race, ethnicity, and origin ACS 2023
- Neighborhood character
- Majority White (60%)
- Race & ethnicity
- White 60% Hispanic / Latino 30% Two or more races 9% Black 6%
- Hispanic origin (detail)
- Mexican 29%
- Common ancestry
- Lithuanian 2% Slovak 1% Italian 1%
- Foreign-born
- 5% · Canada
- Languages at home
- 87% English-only · Spanish 11% German/W. Germanic 1% French/Haitian/Cajun 1%
Political lean MEDSL · Hill
- 2024 margin
- Solid R (+64.4) · D 17.5% · R 81.8%
- 2008→2024 swing
- -23.0pp toward R · 2008: -41.4pp · 2024: -64.4pp
- All cycles
- 2024: R+64.4 2020: R+60.7 2016: R+58.4 2012: R+53.0 2008: R+41.4
Not yet ingested
- Civics
- —
Market trends
- HPI YoY
- ▲ 10.37%
- Current HPI
- 264.5221
- Rent YoY
- —
- Metro
- —
- State GDP YoY
- ▲ 3.95%
- F500 in state
- 110
Industry mix (Fortune 500 HQ in TX)
| Industry | F500 HQs | Revenue |
|---|---|---|
| Energy | 16 | $1,198B |
|
||
| Technology | 5 | $198B |
|
||
| Engineering / Construction | 4 | $72B |
|
||
| Energy Services | 3 | $60B |
|
||
| Utilities | 3 | $41B |
|
||
| Healthcare | 2 | $330B |
|
||
Price history
4 events — show timeline
- 2026-06-08 Listed $170,000 NTREIS
- 2008-05-30 Sold (Public Records) — Public Records
- 2008-05-30 Sold (Public Records) — Public Records
- 1996-09-18 Sold (Public Records) — Public Records
Property tax history
+3.2%/yrLatest (2025): $2,141 · +7.3% YoY. Source: county tax records.
Cash-flow waterfall
monthlySold comps — $/sqft
last 12 mo · ≤1 miLoading sold comps…