 Duplex
172/174 Cedar St · Friendship, TN
Flood risk 1/10 · Minimal
- FEMA flood zone
- X (unshaded)
- Chance of flooding over 30 yrs
- 0.0%
- Est. flood insurance / yr
- $507 – $1,088
Fire risk 3/10 · Minor
- Est. fire insurance / yr
- $949 – $1,763
Heat risk 5/10 · Moderate
- Hot days now (above 108°F)
- 7 days/yr
- Hot days in 30 yrs
- 19 days/yr
Wind risk 4/10 · Minor
- Chance of severe wind over 30 yrs
- 11.0%
Air-quality risk 1/10 · Minimal
- Unhealthy air days now
- 0 days/yr
- Unhealthy air days in 30 yrs
- 0 days/yr
Risk factors via First Street. Map © Google.
Why this score? — see what drove the C- grade
The composite is a weighted blend of 9 inputs, each scored 0–100. Each bar is that input's sub-score; the figure is the points it added to the 100-point composite (weight × sub-score).
- Cash flow +15.0/30.0
- Appreciation +10.0/10.0
- ARV discount +7.5/15.0
- DSCR +4.6/10.0
- 1% rule +4.1/10.0
- Condition / age +4.0/5.0
- Livability +2.7/5.0
- Schools +2.6/10.0
- Rent growth +2.5/5.0
$175,000
🖨 Deal sheet 📄 Offer letter ✓ Due diligence
Multi-family units
County records classify this as Multi-Family (2-4 Unit). Listing-text estimate: 2 units. confirmed
Listing remarks
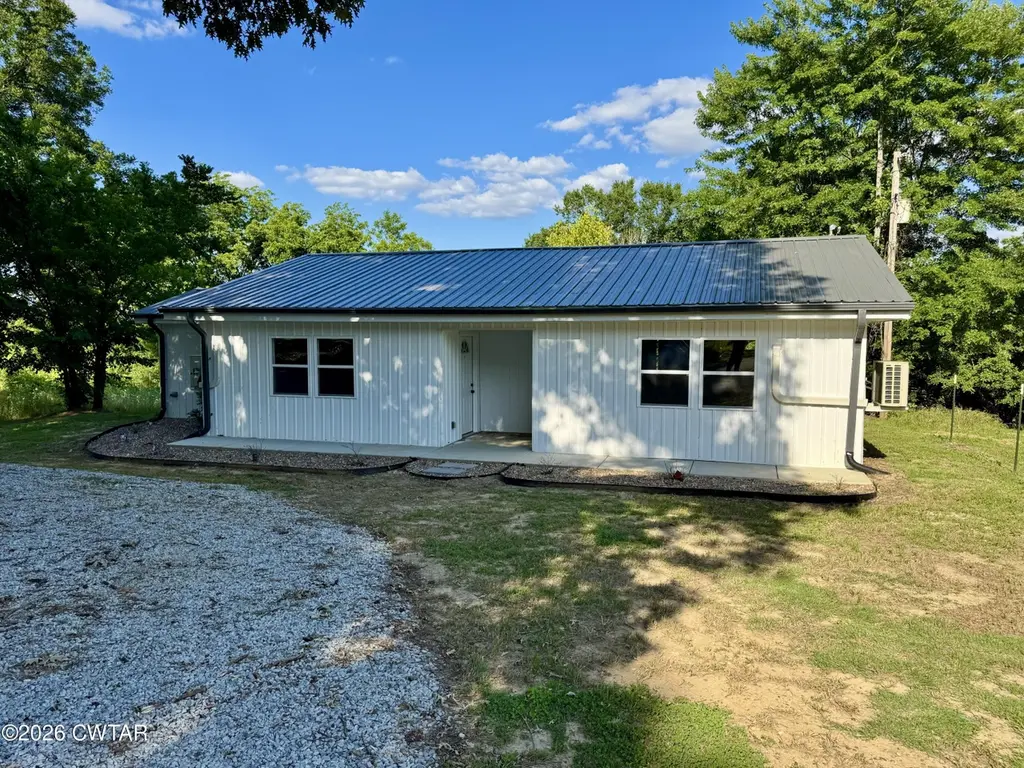
Fully remodeled duplex on 1.1 acres in Friendship, TN featuring a 2BR/1BA unit and a 1BR/1BA unit. Updates include all new flooring, fresh paint, new siding, 3 new mini-split units, new cabinets, new stove/range, new microwave with vent hood, 2 new water heaters, and MORE! Turnkey investment opportunity with excellent rental potential and convenient access to local amenities and Highway 412. Give Seth Rodgers a call or email at 731-618-7925 / [email protected] to see this Duplex TODAY!
Key facts
- Remodeled duplex
- 1.1 acres
- Fresh paint
Tags
Property features AI
Finance
- Financial info: Zoned commercial
Exterior
- Parking: Three parking spaces; Circular gravel driveway
- Utilities: Public water; Public sewer; 200+ amp electric service; Electricity connected; Water connected; Sewer connected; Cable available; Phone available
- Home design: Duplex residential income property; One-story
- Construction: Vinyl siding; Metal roof; Slab foundation; Built as a one-level structure
- Exterior features: Patio; Level to rolling slope lot; Concrete road frontage on a city street; Publicly maintained road
Interior
- Kitchen: Electric oven; Range
- Bathrooms: One bathroom in one unit; One bathroom in the other unit
- Heating & cooling: Central heating; Central air conditioning
- Interior features: Electric oven; Range
- Laundry & utility: Washer hookup; Electric dryer hookup
Neighborhood map
What this means for you Summary
Snapshot
- This is a 1×2.0bd/1.0ba + 1×1.0bd/1.0ba units multifamily listed at $175k. Condition is rated good.
Deal economics
- At list price, monthly cash flow is $55 ($655/yr) — positive. Per door: $27/mo.
- The deal already cash-flows at list — no discount required.
- To meet the 1% rule (rent ≥ 1% of price), the offer needs to be $160k (8.6% below list).
- Recommended offer: $160k (8.6% below list) — sets the bar for 1% rule.
Location & tenants
- Location reads 53/100 on livability (#387 in TN) — a working-class tenant base; expect higher turnover. Strengths: cost of living A+, housing A+; Watch: health & safety C-, schools F, crime F.
- Crockett County (rural): math 31% / reading 32% proficiency, ranked #48 of 139 in TN (top 34%) — families likely to look elsewhere, expect single-tenant / working-renter base with shorter leases.
- Market conditions: 20 active listings in the ZIP; 26 units permitted in Crockett County in 2024 (0 in 5+ unit buildings).
Forward outlook
- In year one you build about $19k of equity ($1k loan paydown + $18k appreciation (10.0% local appreciation)).
- At projected returns (10.0% appreciation + 3.0% rent growth), your $49k cash investment doubles in ~3 years — after that, you're playing with house money.
- By year 2, paydown + projected appreciation supports a ~$30k cash-out refi (75% LTV) — recoverable capital for the next deal without selling this one.
Negotiation context
- Only 12 days on market — expect competitive offers; lowballing is unlikely to land.
Risks & watch-outs
- Climate carrying-cost: extreme-heat days projected 7→19/yr by 2055 (HVAC capex compounding) — expect insurance premiums to compound above CPI over the hold.
Questions for the listing agent
- Can we see the unit-by-unit rent roll, current vacancy, and any below-market leases? What's the average tenancy length?
- What capital expenditures (roof, boiler, parking lot, exteriors) have been made in the last 5 years, and what's planned in the next 2?
- Built in 1979 — when were the roof, HVAC, electrical panel, plumbing, and water heater last replaced?
- Is there a deadline driving the sale (1031 exchange, divorce, estate, relocation)? That informs how much negotiation room exists.
- Schools are F-rated, which usually means shorter tenancies and higher turnover. Who's the typical renter profile here, and what's been the actual vacancy rate?
- Crime grade is F in this area — have there been break-ins, vandalism, or insurance claims at this property in the last 3 years? What carrier currently insures it and at what premium?
- What's the average days-on-market for RENTAL listings here right now (not sales)? A rising rental-DOM trend means longer vacancies and softer asking-rent achievability than the comps imply.
- What's the recent tenant-quality profile in this submarket — average credit score on applications, eviction rate, late-payment / NSF rate, and stable-employment percentage? A property-management company in the area should have these aggregated.
- How much new apartment / multifamily construction is in the pipeline within 1–3 miles? Heavy new supply (>2% of stock underway) typically softens rents 12–24 months out; light construction supports rent growth.
Investment metrics
- 1% rule
- 0.91% ✗
- Cap rate
- 6.67%
- Cash-on-cash
- 1.34%
- DSCR
- 1.06
- GRM
- 9.1
CMA / ARV
- ARV (on-the-fly)
- $91,632
- Comps found
- 1
Show comp detail 1 sale within ~0.75 mi
| Address | Dist | Beds/Ba | Sqft | Sold | Price | $/sf | Match |
|---|---|---|---|---|---|---|---|
| 7543 Tn-189 | 0.24mi | 3/2.0 (-1) | 1,455 (+10%) | 3mo | $100,000 | $69 | 66 |
Match score weights: distance 35% · size 25% · config 20% · recency 20%. Top-matched comps best support the ARV.
Projected returns pro-forma
10.0% appreciation · 3.0% rent growth · sell at horizon
- IRR
- 25.2%
- Equity multiple
- 3.02×
- Total profit
- $98,812
- Equity at exit
- $157,654
- IRR
- 22.3%
- Equity multiple
- 6.88×
- Total profit
- $288,298
- Equity at exit
- $339,987
Cash invested: $49,000 (down + closing). Projections, not guarantees.
Landlord ↔ Tenant lean methodology
- Overall (STATE)
- 87 Strongly Landlord-Friendly
- State Tennessee
- 87 Strongly Landlord-Friendly · R+13
- County
- — inherits STATE
- City
- — inherits STATE
ZIP-level market 38034
- Home prices YoY
- 5.3%
- Active inventory
- 20
- Price-to-rent
- 17.9×
Monthly cashflow live
- Estimated rent
- $1,600 medium interval (Pro) →
- Mortgage (P&I)
- −$918
- Tax est. 1.5%
- −$219 /mo · $2,625/yr
- Insurance
- −$73
- HOA
- −$0
- Vacancy / Maint / Mgmt
- −$336
- Net cashflow
- $55
Break-even live
2-unit breakdown (identical units grouped — click to expand)
| Units | Beds | Baths | Est. rent |
|---|---|---|---|
| 1× unit | 2.0 | 1 | $813 |
| 1× unit | 1.0 | 1 | $787 |
| Total (2 units) | $1,600 | ||
UW: 25.0% down · 7.5% · 30yr · 1.5% tax · 5.0% vac · 8.0% maint · 8.0% mgmt
Financing live
Cash to close
- Down payment
- $43,750
- Closing costs
- $5,250
- Reserves months
- —
- Total cash needed
- —
Loan-product check · same deal, 3 products live
Conventional
25% down · 7.5% · 30yr
- Down + closing
- —
- Monthly P&I
- —
- Monthly cashflow
- —
- DSCR
- —
- Eligible?
- —
Personal DTI + credit; lowest rate.
DSCR
20% down · 8.5% · 30yr
- Down + closing
- —
- Monthly P&I
- —
- Monthly cashflow
- —
- DSCR
- —
- Eligible?
- —
No personal income docs; deal must DSCR.
Hard money
10% down · 12.0% · 12mo
- Down + closing
- —
- Monthly P&I
- —
- Monthly cashflow
- —
- DSCR
- —
- Eligible?
- —
Short-term bridge; refi at stabilization.
Listing history 10 events
-
2026-06-18days on market $175,000 Active 12 DOM
-
2026-06-17days on market $175,000 Active 11 DOM
-
2026-06-16days on market $175,000 Active 10 DOM
-
2026-06-15days on market $175,000 Active 9 DOM
-
2026-06-13days on market $175,000 Active 7 DOM
-
2026-06-12days on market $175,000 Active 6 DOM
-
2026-06-09days on market $175,000 Active 3 DOM
-
2026-06-08days on market $175,000 Active 2 DOM
-
2026-06-07remarks 496-char remark
-
2026-06-07$175,000 Active 1 DOM
ⓘ Source: listings_history table (triggers on properties + properties_extension) + one-shot
backfill from property_details.listing_events for pre-trigger history.
Climate risk First Street
- Flood 1/10 Low FEMA zone X (unshaded) · 0% chance over 30 yrs
- Wildfire 3/10 Moderate
- Heat 5/10 Major 7 d/yr ≥108°F today · 19 d/yr by 30 yrs out
- Wind 4/10 Moderate 11% chance of damaging wind over 30 yrs
- Air quality 1/10 Low 0 unhealthy d/yr today · 0 by 30 yrs out
Nearby sold comps map
Loading sold comps map…
Walkable amenities ~0.75 mi
Loading nearby amenities…
Taxation est. · year 1
- Rental income
- $19,200
- − Mortgage interest
- −$9,803
- − Property taxes
- −$2,625
- − Insurance
- −$875
- − Repairs & maintenance
- −$1,536
- − Management
- −$1,536
- − Depreciation
- −$5,091
- Taxable loss
- −$2,266
- Est. tax savings @ 24.0%
- +$544
- After-tax cash flow
- $1,199/yr
For passive investors: Depreciation is non-cash, so a rental often shows a tax loss while cash-flowing — sheltering income. Rental losses are passive: they offset passive income freely, and up to $25,000/yr can offset ordinary (W-2) income if you actively participate and your MAGI is under $100k (phasing out to $0 by $150k); unused losses carry forward. On sale, claimed depreciation is recaptured at up to 25%, and gains may owe capital-gains tax (a 1031 exchange can defer both). Figures are a year-1 estimate at your 24.0% rate — not tax advice; consult a CPA.
Condition & rehab AI · 13 photos
This fully remodeled duplex is in good condition with fresh paint and new mini-split units. It offers excellent rental potential and is turnkey ready.
Value-add opportunities
- Both Painting the exterior siding — Fresh paint enhances curb appeal and can increase both resale and rental value.
- Both Landscaping improvements — Enhanced landscaping can improve curb appeal and attract more renters.
Renovation cost estimate screening
Value-add ROI direction
- Both Painting the exterior siding — Fresh paint enhances curb appeal and can increase both resale and rental value. ↑
- Both Landscaping improvements — Enhanced landscaping can improve curb appeal and attract more renters. ↑
ⓘ Cost ranges are severity-bucket heuristics (US national rule-of-thumb). Get contractor quotes + a written scope before underwriting a rehab budget.
Schools (NCES district)
- District
- Crockett County
- NCES district ID
- 4700850
- Math proficiency
- 31% ▼ -10.00%
- Reading proficiency
- 32% ▲ 3.00%
- Median HH income
- $36,758
- Composite
- 26.19/100
- National rank
- #7266
- State rank
- #48 of 139 in TN
Livability — Friendship
- Score
- 53/100
- State rank
- #387
- US rank
- #24343
Category grades
Schools grade is shown separately in the Schools card above.
Census & demographics
- Census place
- Friendship, TN
- Population (ZIP)
- 3,366
Population outlook (Crockett County) Hauer SSP2
- Today (2025)
- 14,795 people
- By 2030
- 14,812 · +0.1%
- By 2040
- 14,811 · +0.1%
- By 2050
- 14,809 · +0.1%
- By 2075
- 15,405 · +4.1%
- By 2100
- 16,200 · +9.5%
Race, ethnicity, and origin ACS 2023
- Neighborhood character
- Predominantly White (76%)
- Race & ethnicity
- White 76% Two or more races 9% Black 8% Hispanic / Latino 6%
- Hispanic origin (detail)
- Mexican 5%
- Common ancestry
- Lithuanian 5% Italian 3% Iranian 3%
- Foreign-born
- 4% · Canada
- Languages at home
- 94% English-only · Spanish 5%
Political lean MEDSL · Crockett
- 2024 margin
- Solid R (+58.7) · D 20.2% · R 78.9%
- 2008→2024 swing
- -25.2pp toward R · 2008: -33.6pp · 2024: -58.7pp
- All cycles
- 2024: R+58.7 2020: R+53.8 2016: R+49.7 2012: R+38.4 2008: R+33.6
Not yet ingested
- Civics
- —
Market trends
- HPI YoY
- ▲ 13.00%
- Current HPI
- 257.4293
- Rent YoY
- —
- Metro
- —
- State GDP YoY
- ▲ 2.78%
- F500 in state
- 22
Industry mix (Fortune 500 HQ in TN)
| Industry | F500 HQs | Revenue |
|---|---|---|
| Healthcare | 3 | $91B |
|
||
| Retail | 3 | $72B |
|
||
| Transportation / Logistics | 1 | $88B |
|
||
| Paper / Packaging | 1 | $19B |
|
||
| Insurance | 1 | $13B |
|
||
| Energy | 1 | $12B |
|
||
Price history
1 event — show timeline
- 2026-05-30 Listed $175,000 CWTAR
Cash-flow waterfall
monthlySold comps — $/sqft
last 12 mo · ≤1 miLoading sold comps…