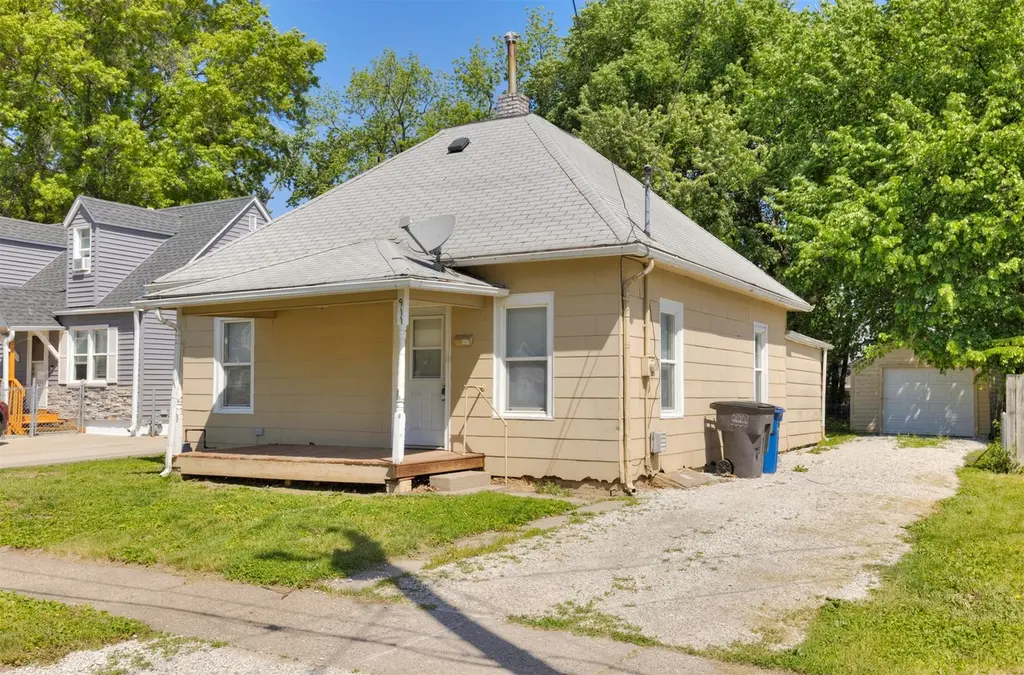
911 Leland Ave · Des Moines, IA
Flood risk 1/10 · Minimal
- FEMA flood zone
- X (unshaded)
- Chance of flooding over 30 yrs
- 0.0%
- Est. flood insurance / yr
- $473 – $860
Fire risk 4/10 · Minor
- Est. fire insurance / yr
- $902 – $1,676
Heat risk 3/10 · Minor
- Hot days now (above 103°F)
- 7 days/yr
- Hot days in 30 yrs
- 15 days/yr
Wind risk 2/10 · Minimal
- Chance of severe wind over 30 yrs
- —
Air-quality risk 2/10 · Minimal
- Unhealthy air days now
- 0 days/yr
- Unhealthy air days in 30 yrs
- 1 days/yr
Risk factors via First Street. Map © Google.
Why this score? — see what drove the C grade
The composite is a weighted blend of 9 inputs, each scored 0–100. Each bar is that input's sub-score; the figure is the points it added to the 100-point composite (weight × sub-score).
- Cash flow +17.0/30.0
- ARV discount +15.0/15.0
- DSCR +5.3/10.0
- 1% rule +4.7/10.0
- Livability +4.0/5.0
- Schools +3.8/10.0
- Rent growth +3.4/5.0
- Condition / age +2.5/5.0
- Appreciation +0.0/10.0
$110,000
🖨 Deal sheet 📄 Offer letter ✓ Due diligence
Listing remarks
Here is a great house for a first time homebuyer or someone who wants to downsize. It also has a current rental certificate if you're a first time investor, or want to add to your current portfolio. 2 BR, 1 bath, big kitchen, living area with room for dining. Great neighborhood - 2 doors from Bordenaro's Pizza! Close to the zoo, downtown, and shopping.
Key facts
- Close to zoo
- Big kitchen
- Living area
Tags
Property features AI
Exterior
- Parking: Detached one-car garage
- Utilities: Public water; Public sewer
- Home design: Single-family property
- Construction: Brick/mortar foundation; Asphalt shingle roof
- Exterior features: Concrete road access; Residential zoning
Interior
- Kitchen: Refrigerator; Stove
- Bedrooms: 2 main-level bedrooms
- Bathrooms: 1 full bathroom
- Heating & cooling: Gas / Natural gas heating; Central air conditioning
- Interior features: Unfinished basement
Neighborhood map
What this means for you Summary
Snapshot
- This is a 2-bed/1.0-bath single-family listed at $110k.
Deal economics
- At list price, monthly cash flow is $74 ($890/yr) — positive.
- The deal already cash-flows at list — no discount required.
- To meet the 1% rule (rent ≥ 1% of price), the offer needs to be $106k (3.4% below list).
- Recommended offer: $106k (3.4% below list) — sets the bar for 1% rule.
- Cap rate 7.1% vs local median 3.1% in Des Moines — top-decile yield for the area; either an underpriced asset or a hidden risk that comps aren't pricing in. Stress-test before assuming the spread holds.
Location & tenants
- Location reads 81/100 on livability (#63 in IA, #1,432 nationally) — a professional / high-income tenant draw. Strengths: commute A+, cost of living A+, housing A+; Watch: employment C-, schools D+, crime F.
- Des Moines Independent Community School District (urban): math 43% / reading 46% proficiency, ranked #289 of 289 in IA (top 100%) — families likely to look elsewhere, expect single-tenant / working-renter base with shorter leases; 63% free/reduced lunch — lower-income household profile, screen leases tightly.
- Market conditions: Rents rising (+3.5%/yr); 227 active listings in the ZIP; 30 comparable units currently listed for rent nearby; rentals at typical pace (median 24d on market — plan ~3-4 weeks tenant-placement turnaround); 2,953 units permitted in Polk County in 2024 (540 in 5+ unit buildings).
Forward outlook
- Local home prices are declining (-3.0%/yr); year-one equity from $761 of loan paydown is wiped out by about $3k of value loss. Plan a longer hold.
- Polk County population projected at +37% by 2050 — long-run rental-demand tailwind backs the buy-and-hold thesis.
Negotiation context
- It's been on market 34 days — a 3% lower offer ($107k) is reasonable based on typical stale-listing flexibility.
Risks & watch-outs
- Watch-outs: built in 1920 — expect roof / HVAC / electrical / plumbing capex.
Questions for the listing agent
- It's been on market 34 days. Have you received any prior offers? Is the seller open to a 3% concession, seller financing, or rate buy-down credit?
- Built in 1920 — when were the roof, HVAC, electrical panel, plumbing, and water heater last replaced?
- Is there a deadline driving the sale (1031 exchange, divorce, estate, relocation)? That informs how much negotiation room exists.
- Schools are D-rated, which usually means shorter tenancies and higher turnover. Who's the typical renter profile here, and what's been the actual vacancy rate?
- Crime grade is F in this area — have there been break-ins, vandalism, or insurance claims at this property in the last 3 years? What carrier currently insures it and at what premium?
- What's the average days-on-market for RENTAL listings here right now (not sales)? A rising rental-DOM trend means longer vacancies and softer asking-rent achievability than the comps imply.
- What's the recent tenant-quality profile in this submarket — average credit score on applications, eviction rate, late-payment / NSF rate, and stable-employment percentage? A property-management company in the area should have these aggregated.
- How much new for-sale + rental construction is in the pipeline within 1–3 miles? Heavy new supply typically softens prices + rents 12–24 months out; constrained supply supports both.
Investment metrics
- 1% rule
- 0.97% ✗
- Cap rate
- 7.10%
- Cash-on-cash
- 2.89%
- DSCR
- 1.13
- GRM
- 8.6
CMA / ARV
- ARV (median comp)
- $175,279
- List price
- $110,000
- Delta
- -37.24%
- Verdict
- UNDERPRICED
- Comps
- 20 within 1.0 mi
Show comp detail 12 sales within ~0.75 mi
| Address | Dist | Beds/Ba | Sqft | Sold | Price | $/sf | Match |
|---|---|---|---|---|---|---|---|
| 700 Payton Ave | 0.20mi | 3/1.0 (+1) | 848 (-0%) | 2mo | $215,000 | $254 | 83 |
| 913 Frederick Ave | 0.22mi | 2/2.0 | 910 (+7%) | 2mo | $150,000 | $165 | 73 |
| 1017 Geil Ave | 0.26mi | 3/1.0 (+1) | 927 (+9%) | 0mo | $140,000 | $151 | 68 |
| 5814 SW 3rd St | 0.45mi | 3/2.0 (+1) | 868 (+2%) | 4mo | $185,000 | $213 | 64 |
| 5812 SW 5th St | 0.37mi | 2/1.0 | 758 (-11%) | 4mo | $150,000 | $198 | 62 |
| 1208 Burnham Ave | 0.45mi | 2/1.0 | 768 (-10%) | 3mo | $169,500 | $221 | 60 |
| 6801 SW 15th St | 0.63mi | 2/1.0 | 896 (+5%) | 4mo | $89,900 | $100 | 59 |
| 6811 SW 13th St | 0.52mi | 2/1.0 | 748 (-12%) | 0mo | $203,000 | $271 | 56 |
| 6102 S Union St | 0.55mi | 2/1.0 | 948 (+12%) | 2mo | $197,500 | $208 | 54 |
| 6825 SW 15th St | 0.65mi | 2/1.0 | 768 (-10%) | 1mo | $113,248 | $147 | 53 |
| 6824 SW 15th St | 0.68mi | 2/1.0 | 768 (-10%) | 2mo | $140,000 | $182 | 51 |
| 6912 SW 15th St | 0.70mi | 2/1.0 | 768 (-10%) | 2mo | $156,500 | $204 | 50 |
Match score weights: distance 35% · size 25% · config 20% · recency 20%. Top-matched comps best support the ARV.
Projected returns pro-forma
-3.0% appreciation · 3.48% rent growth · sell at horizon
- IRR
- -11.2%
- Equity multiple
- 0.59×
- Total profit
- $-12,567
- Equity at exit
- $16,401
- IRR
- -1.2%
- Equity multiple
- 0.91×
- Total profit
- $-2,646
- Equity at exit
- $9,511
Cash invested: $30,800 (down + closing). Projections, not guarantees.
Landlord ↔ Tenant lean methodology
- Overall (STATE)
- 83 Strongly Landlord-Friendly
- State Iowa
- 83 Strongly Landlord-Friendly · R+6
- County
- — inherits STATE
- City
- — inherits STATE
ZIP-level market 50315
- Rents YoY
- 3.5%
- Active inventory
- 227
- Price-to-rent
- 8.6×
Monthly cashflow live
- Estimated rent
- $1,063 high interval (Pro) →
- Mortgage (P&I)
- −$577
- Tax from tax record
- −$143 /mo · $1,716/yr
- Insurance
- −$46
- HOA
- −$0
- Vacancy / Maint / Mgmt
- −$223
- Net cashflow
- $74
Break-even live
UW: 25.0% down · 7.5% · 30yr · 1.5% tax · 5.0% vac · 8.0% maint · 8.0% mgmt
Financing live
Cash to close
- Down payment
- $27,500
- Closing costs
- $3,300
- Reserves months
- —
- Total cash needed
- —
Loan-product check · same deal, 3 products live
Conventional
25% down · 7.5% · 30yr
- Down + closing
- —
- Monthly P&I
- —
- Monthly cashflow
- —
- DSCR
- —
- Eligible?
- —
Personal DTI + credit; lowest rate.
DSCR
20% down · 8.5% · 30yr
- Down + closing
- —
- Monthly P&I
- —
- Monthly cashflow
- —
- DSCR
- —
- Eligible?
- —
No personal income docs; deal must DSCR.
Hard money
10% down · 12.0% · 12mo
- Down + closing
- —
- Monthly P&I
- —
- Monthly cashflow
- —
- DSCR
- —
- Eligible?
- —
Short-term bridge; refi at stabilization.
Rent comps 30 comps
| Address | Beds | Baths | Sqft | Rent | $/sqft | DOM | Units | Dist |
|---|---|---|---|---|---|---|---|---|
| 6800 SW 9th St Des Moines, IA | 1.0 | 1.0 | 818 | $902 | $1.10 | 14d | 3 | 0.38mi |
| 5508 SW 8th St Des Moines, IA | 1.0 | 1.0 | 624 | $895 | $1.43 | 44d | 1 | 0.43mi |
| 6920 SW 9th St Apt 12 Des Moines, IA | 2.0 | 1.0 | 750 | $750 | $1.00 | 43d | 1 | 0.46mi |
| 6920 SW 9th St Apt 11 Des Moines, IA | 2.0 | 1.0 | 750 | $775 | $1.03 | 43d | 1 | 0.46mi |
| 939 Kenyon Ave Des Moines, IA | 3.0 | 1.5 | 950 | $1,350 | $1.42 | 43d | 1 | 0.54mi |
| 1013 1/2 Kenyon Ave Des Moines, IA | 2.0 | 1.0 | 768 | $875 | $1.14 | 43d | 1 | 0.54mi |
| 6514 Chaffee Rd Des Moines, IA | 1.0–2.0 | 1.0 | 683 | $960 | $1.40 | 14d | 19 | 0.57mi |
| 23 E Lally St Des Moines, IA | 2.0 | 1.0 | 844 | $1,245 | $1.48 | 21d | 1 | 0.63mi |
| 6924 Chaffee Rd Des Moines, IA | 1.0–2.0 | 1.0 | 796 | $1,038 | $1.30 | 14d | 14 | 0.66mi |
| 204 E Leland Ave Des Moines, IA | 3.0 | 1.0 | 1040 | $1,595 | $1.53 | 14d | 1 | 0.71mi |
| 5015 SW 9th St Des Moines, IA | 1.0–2.0 | 1.0 | 682 | $910 | $1.33 | 14d | 5 | 0.73mi |
| 5000 SW 8th St Des Moines, IA | 3.0 | 1.0 | 956 | $1,340 | $1.40 | 23d | 1 | 0.78mi |
| 5016 SW 13th St Des Moines, IA | 2.0 | 1.0 | 676 | $1,395 | $2.06 | 43d | 1 | 0.79mi |
| 12 E Kenyon Ave Des Moines, IA | 3.0 | 1.5 | 1000 | $1,395 | $1.40 | 23d | 1 | 0.80mi |
| 7440 Southview Dr Des Moines, IA | 3.0 | 1.0 | 960 | $1,525 | $1.59 | 14d | 1 | 0.81mi |
| 5201 S Union St Unit 302 Des Moines, IA | 2.0 | 1.0 | 800 | $845 | $1.06 | 21d | 1 | 0.86mi |
| 5201 S Union St Apt 208 Des Moines, IA | 2.0 | 1.0 | 800 | $845 | $1.06 | 43d | 1 | 0.86mi |
| 201 McKinley Ave Des Moines, IA | 3.0 | 1.0 | 840 | $1,350 | $1.61 | 43d | 1 | 1.03mi |
| 4805 South Union St Des Moines, IA | 2.0 | 1.0 | 720 | $1,245 | $1.73 | 23d | 1 | 1.05mi |
| 211 E McKinley Ave Des Moines, IA | 2.0–3.0 | 1.5–2.0 | 875 | $847 | $0.97 | 14d | 4 | 1.12mi |
| 6209 SE 5th St Unit 6205-35 Des Moines, IA | 2.0 | 1.0 | 900 | $905 | $1.01 | 19d | 1 | 1.12mi |
| 6209 SE 5th St Unit 6221-104 Des Moines, IA | 1.0 | 1.0 | 600 | $875 | $1.46 | 21d | 1 | 1.12mi |
| 521 Hart Ave Des Moines, IA | 2.0 | 1.0 | 950 | $1,150 | $1.21 | 14d | 1 | 1.14mi |
| 501 E Porter Ave Des Moines, IA | 2.0 | 1.0 | 812 | $975 | $1.20 | 43d | 1 | 1.15mi |
| 1211 Lewis Ave Des Moines, IA | 1.0 | 1.0 | 724 | $1,095 | $1.51 | 43d | 1 | 1.15mi |
| 900 Elder Ln Unit 9 Des Moines, IA | 1.0 | 1.0 | 575 | $675 | $1.17 | 14d | 1 | 1.18mi |
| 311 E McKinley Ave Des Moines, IA | 2.0 | 2.0 | 884 | $785 | $0.89 | 43d | 1 | 1.20mi |
| 1012 Carrie Ave Des Moines, IA | 2.0 | 1.0 | 1100 | $1,700 | $1.55 | 21d | 1 | 1.24mi |
| 7201 SE 5th St Des Moines, IA | 1.0–2.0 | 1.0 | 749 | $780 | $1.04 | 14d | 3 | 1.27mi |
| 2200 Stanton Ave Des Moines, IA | 2.0 | 1.0 | 1000 | $950 | $0.95 | 23d | 1 | 1.50mi |
Listing history 18 events
-
2026-06-18days on market $110,000 Active 34 DOM
-
2026-06-17days on market $110,000 Active 33 DOM
-
2026-06-16days on market $110,000 Active 32 DOM
-
2026-06-15days on market $110,000 Active 31 DOM
-
2026-06-14days on market $110,000 Active 29 DOM
-
2026-06-13days on market $110,000 Active 28 DOM
-
2026-06-10days on market $110,000 Active 26 DOM
-
2026-06-09days on market $110,000 Active 25 DOM
-
2026-06-08days on market $110,000 Active 24 DOM
-
2026-06-07days on market $110,000 Active 23 DOM
-
2026-06-05days on market $110,000 Active 20 DOM
-
2026-06-03days on market $110,000 Active 19 DOM
-
2026-06-02days on market $110,000 Active 18 DOM
-
2026-06-01days on market $110,000 Active 17 DOM
-
2026-05-31days on market $110,000 Active 16 DOM
-
2026-05-31days on market $110,000 Active 15 DOM
-
2026-05-15$110,000 Active 355-char remark
-
2014-03-27soldstatus $200,000
ⓘ Source: listings_history table (triggers on properties + properties_extension) + one-shot
backfill from property_details.listing_events for pre-trigger history.
Tax reassessment forecast IA · Partial reset (capped growth)
- Current annual tax
- $1,716 · $143/mo
- Projected year-2 tax
- $1,722 · $143/mo
- Expected delta
- +$6/yr ($0/mo · 0.3%)
ⓘ Screening estimate from a state-policy table — verify with the county assessor before closing.
Climate risk First Street
- Flood 1/10 Low FEMA zone X (unshaded) · 0% chance over 30 yrs
- Wildfire 4/10 Moderate
- Heat 3/10 Moderate 7 d/yr ≥103°F today · 15 d/yr by 30 yrs out
- Wind 2/10 Low
- Air quality 2/10 Low 0 unhealthy d/yr today · 1 by 30 yrs out
Nearby sold comps map
Loading sold comps map…
Walkable amenities ~0.75 mi
Loading nearby amenities…
Taxation est. · year 1
- Rental income
- $12,757
- − Mortgage interest
- −$6,162
- − Property taxes
- −$1,716
- − Insurance
- −$550
- − Repairs & maintenance
- −$1,021
- − Management
- −$1,021
- − Depreciation
- −$3,200
- Taxable loss
- −$912
- Est. tax savings @ 24.0%
- +$219
- After-tax cash flow
- $1,109/yr
For passive investors: Depreciation is non-cash, so a rental often shows a tax loss while cash-flowing — sheltering income. Rental losses are passive: they offset passive income freely, and up to $25,000/yr can offset ordinary (W-2) income if you actively participate and your MAGI is under $100k (phasing out to $0 by $150k); unused losses carry forward. On sale, claimed depreciation is recaptured at up to 25%, and gains may owe capital-gains tax (a 1031 exchange can defer both). Figures are a year-1 estimate at your 24.0% rate — not tax advice; consult a CPA.
Schools (NCES district)
- District
- Des Moines Independent Community School District
- NCES district ID
- 1908970
- Math proficiency
- 43% ▼ -6.00%
- Reading proficiency
- 46% ▼ -1.00%
- Median HH income
- $45,905
- Composite
- 37.83/100
- National rank
- #4331
- State rank
- #289 of 289 in IA
Livability — Des Moines
- Score
- 81/100
- State rank
- #63
- US rank
- #1432
Category grades
Schools grade is shown separately in the Schools card above.
Census & demographics
- Census place
- Des Moines, IA
- County
- Polk County · 453,298 people
- City population
- 203,612
- Metro
- Des Moines-West Des Moines, IA
- Population (ZIP)
- 34,816
- Household income
- $60,590
- Rent vs Own
- Severe rent burden
- 1072.0
Population outlook (Polk County) Hauer SSP2
- Today (2025)
- 548,042 people
- By 2030
- 588,557 · +7.4%
- By 2040
- 670,629 · +22.4%
- By 2050
- 752,830 · +37.4%
- By 2075
- 955,069 · +74.3%
- By 2100
- 1,115,436 · +103.5%
Race, ethnicity, and origin ACS 2023
- Neighborhood character
- Predominantly White (66%)
- Race & ethnicity
- White 66% Hispanic / Latino 19% Two or more races 11% Black 9% Asian 2%
- Hispanic origin (detail)
- Mexican 14%
- Common ancestry
- Iranian 2% Portuguese 2% Italian 2%
- Foreign-born
- 10% · Canada, Philippines
- Languages at home
- 83% English-only · Spanish 13% Other Asian/Pacific 1%
Political lean MEDSL · Polk
- 2024 margin
- D (+10.9) · D 54.8% · R 43.9% · Other 1.3%
- 2008→2024 swing
- -3.7pp toward R · 2008: 14.6pp · 2024: 10.9pp
- All cycles
- 2024: D+10.9 2020: D+15.2 2016: D+11.5 2012: D+14.2 2008: D+14.6
Not yet ingested
- Civics
- —
Market trends
- HPI YoY
- ▼ -259.03%
- Current HPI
- 269.7231
- Rent YoY
- ▲ 3.48%
- Metro
- Des Moines-West Des Moines, IA
- State GDP YoY
- ▲ 2.48%
- F500 in state
- 4
Industry mix (Fortune 500 HQ in IA)
| Industry | F500 HQs | Revenue |
|---|---|---|
| Financial Services | 1 | $16B |
|
||
| Retail / Convenience | 1 | $15B |
|
||
Price history
-45.0% since first listed2 events — show timeline
- 2026-05-15 Listed $110,000 DMMLS
- 2014-03-27 Sold (Public Records) $200,000 Public Records
Property tax history
+3.3%/yrLatest (2025): $1,716 · +2.0% YoY. Source: county tax records.
Cash-flow waterfall
monthlySold comps — $/sqft
last 12 mo · ≤1 miLoading sold comps…