 🌊 Lakefront
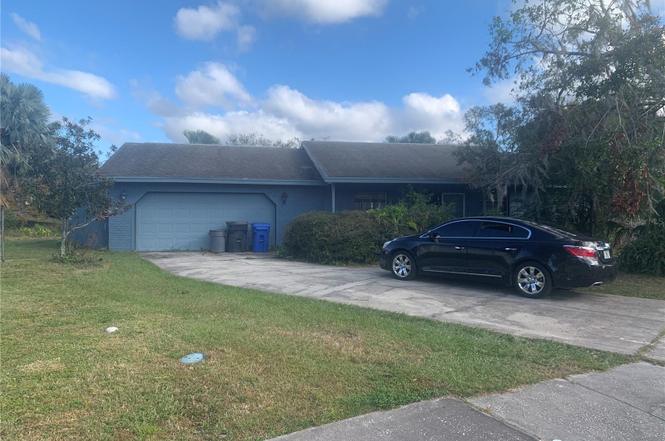
3602 Southview Ct · Bloomingdale, FL
Flood risk 4/10 · Minor
- FEMA flood zone
- X (unshaded)
- Chance of flooding over 30 yrs
- 0.13%
- Est. flood insurance / yr
- $507 – $1,088
Fire risk 1/10 · Minimal
- Est. fire insurance / yr
- $947 – $1,759
Heat risk 10/10 · Severe
- Hot days now (above 109°F)
- 7 days/yr
- Hot days in 30 yrs
- 26 days/yr
Wind risk 9/10 · Severe
- Chance of severe wind over 30 yrs
- 99.0%
Air-quality risk 4/10 · Minor
- Unhealthy air days now
- 4 days/yr
- Unhealthy air days in 30 yrs
- 5 days/yr
Risk factors via First Street. Map © Google.
Why this score? — see what drove the B- grade
The composite is a weighted blend of 9 inputs, each scored 0–100. Each bar is that input's sub-score; the figure is the points it added to the 100-point composite (weight × sub-score).
- Cash flow +28.5/30.0
- 1% rule +10.0/10.0
- DSCR +10.0/10.0
- ARV discount +7.5/15.0
- Schools +4.2/10.0
- Livability +3.6/5.0
- Condition / age +2.5/5.0
- Rent growth +2.2/5.0
- Appreciation +0.0/10.0
$149,900
🖨 Deal sheet 📄 Offer letter ✓ Due diligence
Listing remarks MLS
3/2 POOL HOME W/ VIEW OF POND IN BACKYARD. ROOF REPLACED NOV 2003, ALL APPLIANCES STAY (SMOOTH TOP RANGE & REFRIGERATOR 2 YEARS OLD), LIV/DIN COMBOWITH SEPARATE FAMILY ROOM. CEILING FANS THRUOUT, HUGE 33X16 GUNITE HEATED POOL W/ SCREEN ENCLOSURE. IRREGULAR CUL DE SAC LOT. NO DEED RESTRICTIONS. NOTE: SELLER IS REPLACING STORM DAMAGED SCREENS IN REAR, POOL DECK TO BE PRESSURE-CLEANED. SELLER REQUIRES APPROVAL LETTER WITH ANY CONTRACTS. CONVE NIENT TO INTERSTATE & SELMON XPRESSWAY. * * UNDER CONTRACT - SELLER TAKING BACKUPS * * CALL LA OFFICE FOR APPOINTMENT TO SHOW!!!
Key facts
- 0.24 acre lot
- 2 garage spots
- Pool
Neighborhood map
What this means for you Summary
Snapshot
- This is a 3-bed/2.0-bath single-family listed at $150k.
Deal economics
- At list price, monthly cash flow is $488 ($6k/yr) — positive.
- The deal already cash-flows at list — no discount required.
- Meets the 1% rule at list price ($2k rent vs $150k).
Location & tenants
- Location reads 71/100 on livability (#383 in FL) — a middle-class / working-renter tenant base. Strengths: employment A+, housing A+, crime A; Watch: schools D+, amenities F, health & safety F.
- Hillsborough (suburban): math 47% / reading 50% proficiency, ranked #41 of 73 in FL (top 56%) — families likely to look elsewhere, expect single-tenant / working-renter base with shorter leases.
- Market conditions: Rents soft (-1.2%/yr); 313 active listings in the ZIP; 28 comparable units currently listed for rent nearby; rentals at typical pace (median 20d on market — plan ~3-4 weeks tenant-placement turnaround); solid renter incomes; 9,053 units permitted in Hillsborough County in 2024 (4,555 in 5+ unit buildings).
- This rent runs 34% of the median local income ($81k/yr) — at the standard rent-burdened threshold; future hikes will face affordability resistance.
Forward outlook
- Local home prices are declining (-3.0%/yr); year-one equity from $1k of loan paydown is wiped out by about $4k of value loss. Plan a longer hold.
- Hillsborough County population projected at +37% by 2050 — long-run rental-demand tailwind backs the buy-and-hold thesis.
Negotiation context
- Only 1 days on market — expect competitive offers; lowballing is unlikely to land.
- 3 sale attempts since 22y ago with the ask held roughly flat each time — persistent listings suggest the price (not the market) is what's stuck; bring a comps-based counter.
Risks & watch-outs
- Watch-outs: property tax is 3.8% of price.
- Climate carrying-cost: severe wind risk, 99% chance of damaging wind over 30y; extreme-heat days projected 7→26/yr by 2055 (HVAC capex compounding) — expect insurance premiums to compound above CPI over the hold.
Questions for the listing agent
- Built in 1974 — when were the roof, HVAC, electrical panel, plumbing, and water heater last replaced?
- Property tax is high relative to price — has the assessment been appealed recently, and will the sale trigger a re-assessment?
- Is there a deadline driving the sale (1031 exchange, divorce, estate, relocation)? That informs how much negotiation room exists.
- Schools are D-rated, which usually means shorter tenancies and higher turnover. Who's the typical renter profile here, and what's been the actual vacancy rate?
- This sits on a lake — are riparian / water-frontage rights deeded with the parcel? Any dock permits, shoreline easements, or HOA water-use restrictions?
- What's the documented flood / surge / shoreline-erosion history here (FEMA AND non-FEMA — e.g., storm surge, creek backup, septic-field saturation)?
- Any water-quality or seasonal algae-bloom issues that affect tenant satisfaction or short-term-rental demand?
- What's the average days-on-market for RENTAL listings here right now (not sales)? A rising rental-DOM trend means longer vacancies and softer asking-rent achievability than the comps imply.
- What's the recent tenant-quality profile in this submarket — average credit score on applications, eviction rate, late-payment / NSF rate, and stable-employment percentage? A property-management company in the area should have these aggregated.
- How much new for-sale + rental construction is in the pipeline within 1–3 miles? Heavy new supply typically softens prices + rents 12–24 months out; constrained supply supports both.
Investment metrics
- 1% rule
- 1.53% ✓
- Cap rate
- 10.20%
- Cash-on-cash
- 13.96%
- DSCR
- 1.62
- GRM
- 5.5
CMA / ARV
No comps found within radius.
Projected returns pro-forma
-3.0% appreciation · 0.0% rent growth · sell at horizon
- IRR
- 0.2%
- Equity multiple
- 1.01×
- Total profit
- $293
- Equity at exit
- $22,351
- IRR
- 5.8%
- Equity multiple
- 1.36×
- Total profit
- $15,185
- Equity at exit
- $12,961
Cash invested: $41,972 (down + closing). Projections, not guarantees.
Landlord ↔ Tenant lean methodology
- Overall (STATE)
- 87 Strongly Landlord-Friendly
- State Florida
- 87 Strongly Landlord-Friendly · R+3
- County
- — inherits STATE
- City
- — inherits STATE
ZIP-level market 33511
- Rents YoY
- -1.2%
- Active inventory
- 313
- Price-to-rent
- 5.5×
Monthly cashflow live
- Estimated rent
- $2,292 high interval (Pro) →
- Mortgage (P&I)
- −$786
- Tax from tax record
- −$474 /mo · $5,688/yr
- Insurance
- −$62
- HOA
- −$0
- Vacancy / Maint / Mgmt
- −$481
- Net cashflow
- $488
Break-even live
UW: 25.0% down · 7.5% · 30yr · 1.5% tax · 5.0% vac · 8.0% maint · 8.0% mgmt
Financing live
Cash to close
- Down payment
- $37,475
- Closing costs
- $4,497
- Reserves months
- —
- Total cash needed
- —
Loan-product check · same deal, 3 products live
Conventional
25% down · 7.5% · 30yr
- Down + closing
- —
- Monthly P&I
- —
- Monthly cashflow
- —
- DSCR
- —
- Eligible?
- —
Personal DTI + credit; lowest rate.
DSCR
20% down · 8.5% · 30yr
- Down + closing
- —
- Monthly P&I
- —
- Monthly cashflow
- —
- DSCR
- —
- Eligible?
- —
No personal income docs; deal must DSCR.
Hard money
10% down · 12.0% · 12mo
- Down + closing
- —
- Monthly P&I
- —
- Monthly cashflow
- —
- DSCR
- —
- Eligible?
- —
Short-term bridge; refi at stabilization.
Rent comps 28 comps
| Address | Beds | Baths | Sqft | Rent | $/sqft | DOM | Units | Dist |
|---|---|---|---|---|---|---|---|---|
| 3812 Pinedale St Brandon, FL | 4.0 | 2.0 | 1586 | $2,295 | $1.45 | 18d | 1 | 0.12mi |
| 808 Pebblewood Dr Brandon, FL | 3.0 | 2.0 | 1145 | $2,075 | $1.81 | 12d | 1 | 0.19mi |
| 3818 Southview Dr Brandon, FL | 3.0 | 2.0 | 1373 | $2,245 | $1.64 | 24d | 1 | 0.21mi |
| 602 Pine Forest Dr Brandon, FL | 3.0 | 2.0 | 1450 | $2,595 | $1.79 | 24d | 1 | 0.23mi |
| 816 Centerwood Ct Brandon, FL | 3.0 | 2.0 | 1391 | $2,009 | $1.44 | 24d | 1 | 0.27mi |
| 622 Breezeway Ct Brandon, FL | 4.0 | 2.5 | 1854 | $2,300 | $1.24 | 3d | 1 | 0.38mi |
| 1024 Hallwood Loop Brandon, FL | 3.0 | 2.0 | 1466 | $2,295 | $1.57 | 24d | 1 | 0.41mi |
| 1407 Trail Boss Ln Brandon, FL | 4.0 | 2.0 | 1857 | $2,395 | $1.29 | 18d | 1 | 0.55mi |
| 1002 Creekbridge Rd Brandon, FL | 2.0–3.0 | 2.0 | 1062 | $1,736 | $1.63 | 2d | 6 | 0.69mi |
| 856 Creekway Ct Brandon, FL | 3.0 | 2.0 | 1556 | $2,045 | $1.31 | 22d | 1 | 0.69mi |
| 3124 Bloomingdale Villas Ct Brandon, FL | 3.0 | 2.0 | 1200 | $1,800 | $1.50 | 24d | 1 | 0.72mi |
| 609 Princeton St Brandon, FL | 4.0 | 2.0 | 1681 | $2,150 | $1.28 | 24d | 1 | 0.90mi |
| 544 Emberwood Dr Brandon, FL | 4.0 | 2.0 | 2112 | $3,000 | $1.42 | 24d | 1 | 1.01mi |
| 826 Milano Cir Brandon, FL | 1.0–3.0 | 1.0–2.0 | 1034 | $2,029 | $1.96 | 2d | 17 | 1.09mi |
| 5790 Stockport St Riverview, FL | 1.0–2.0 | 1.0–2.0 | 936 | $2,180 | $2.33 | 3d | 37 | 1.25mi |
| 3039 Annadale Cir Brandon, FL | 4.0 | 2.0 | 1549 | $2,320 | $1.50 | 3d | 1 | 1.30mi |
| 6523 Watson Rd Riverview, FL | 3.0 | 2.0 | 1937 | $2,950 | $1.52 | 20d | 1 | 1.32mi |
| 1407 Wakefield Dr Brandon, FL | 3.0 | 2.0 | 1728 | $2,200 | $1.27 | 22d | 1 | 1.33mi |
| 5422 Watson Rd Riverview, FL | 4.0 | 2.0 | 2080 | $2,495 | $1.20 | 12d | 1 | 1.36mi |
| 924 Ridge Haven Dr Brandon, FL | 4.0 | 2.0 | 1956 | $2,700 | $1.38 | 24d | 1 | 1.36mi |
| 924 Ridge Haven Dr Brandon, FL | 4.0 | 2.0 | 1956 | $2,700 | $1.38 | 5d | 1 | 1.36mi |
| 557 Rapid Falls Dr Brandon, FL | 3.0 | 2.0 | 1348 | $2,300 | $1.71 | 18d | 1 | 1.37mi |
| 11112 Swansea St Riverview, FL | 2.0 | 2.0 | 1731 | $2,500 | $1.44 | 17d | 1 | 1.39mi |
| 1305 Lakehurst Way Brandon, FL | 4.0 | 2.0 | 2221 | $2,550 | $1.15 | 3d | 1 | 1.42mi |
| 724 Fortuna Dr Brandon, FL | 4.0 | 2.0 | 1784 | $2,450 | $1.37 | 24d | 1 | 1.43mi |
| 5403 Lindburg St Riverview, FL | 4.0 | 2.0 | 1830 | $2,300 | $1.26 | 24d | 1 | 1.44mi |
| 2810 Manor Hill Dr Brandon, FL | 4.0 | 2.0 | 1649 | $2,279 | $1.38 | 2d | 1 | 1.45mi |
| 734 Sandy Creek Dr Brandon, FL | 4.0 | 2.0 | 1916 | $2,395 | $1.25 | 24d | 1 | 1.50mi |
Listing history 11 events
-
2025-02-05status Pending
-
2025-02-04$149,900 Active
-
2024-10-29status Pending
-
2024-10-26historical
-
2024-09-25$299,999 Active
-
2004-11-29soldstatus $161,000
-
2004-11-19soldstatus $161,000 591-char remark
Show marketing remark (591 chars)
3/2 POOL HOME W/ VIEW OF POND IN BACKYARD. ROOF REPLACED NOV 2003, ALL APPLIANCES STAY (SMOOTH TOP RANGE & REFRIGERATOR 2 YEARS OLD), LIV/DIN COMBOWITH SEPARATE FAMILY ROOM. CEILING FANS THRUOUT, HUGE 33X16 GUNITE HEATED POOL W/ SCREEN ENCLOSURE. IRREGULAR CUL DE SAC LOT. NO DEED RESTRICTIONS. NOTE: SELLER IS REPLACING STORM DAMAGED SCREENS IN REAR, POOL DECK TO BE PRESSURE-CLEANED. SELLER REQUIRES APPROVAL LETTER WITH ANY CONTRACTS. CONVE NIENT TO INTERSTATE & SELMON XPRESSWAY. * * UNDER CONTRACT - SELLER TAKING BACKUPS * * CALL LA OFFICE FOR APPOINTMENT TO SHOW!!!
-
2004-10-04$161,000 591-char remark
Show marketing remark (591 chars)
3/2 POOL HOME W/ VIEW OF POND IN BACKYARD. ROOF REPLACED NOV 2003, ALL APPLIANCES STAY (SMOOTH TOP RANGE & REFRIGERATOR 2 YEARS OLD), LIV/DIN COMBOWITH SEPARATE FAMILY ROOM. CEILING FANS THRUOUT, HUGE 33X16 GUNITE HEATED POOL W/ SCREEN ENCLOSURE. IRREGULAR CUL DE SAC LOT. NO DEED RESTRICTIONS. NOTE: SELLER IS REPLACING STORM DAMAGED SCREENS IN REAR, POOL DECK TO BE PRESSURE-CLEANED. SELLER REQUIRES APPROVAL LETTER WITH ANY CONTRACTS. CONVE NIENT TO INTERSTATE & SELMON XPRESSWAY. * * UNDER CONTRACT - SELLER TAKING BACKUPS * * CALL LA OFFICE FOR APPOINTMENT TO SHOW!!!
-
1999-07-15soldstatus $99,900
-
1984-07-01soldstatus $95,000
-
1981-01-01soldstatus $75,500
ⓘ Source: listings_history table (triggers on properties + properties_extension) + one-shot
backfill from property_details.listing_events for pre-trigger history.
Tax reassessment forecast FL · Resets to sale price
- Current annual tax
- $5,688 · $474/mo
- Projected year-2 tax
- $5,688 · $474/mo
- Expected delta
- $0/yr ($0/mo · 0.0%)
ⓘ Screening estimate from a state-policy table — verify with the county assessor before closing.
Climate risk First Street
- Flood 4/10 Moderate FEMA zone X (unshaded) · 13% chance over 30 yrs
- Wildfire 1/10 Low
- Heat 10/10 Extreme 7 d/yr ≥109°F today · 26 d/yr by 30 yrs out
- Wind 9/10 Extreme 99% chance of damaging wind over 30 yrs
- Air quality 4/10 Moderate 4 unhealthy d/yr today · 5 by 30 yrs out
Nearby sold comps map
Loading sold comps map…
Walkable amenities ~0.75 mi
Loading nearby amenities…
Taxation est. · year 1
- Rental income
- $27,504
- − Mortgage interest
- −$8,397
- − Property taxes
- −$5,688
- − Insurance
- −$750
- − Repairs & maintenance
- −$2,200
- − Management
- −$2,200
- − Depreciation
- −$4,361
- Taxable income
- $3,908
- Est. tax owed @ 24.0%
- −$938
- After-tax cash flow
- $4,920/yr
For passive investors: Depreciation is non-cash, so a rental often shows a tax loss while cash-flowing — sheltering income. Rental losses are passive: they offset passive income freely, and up to $25,000/yr can offset ordinary (W-2) income if you actively participate and your MAGI is under $100k (phasing out to $0 by $150k); unused losses carry forward. On sale, claimed depreciation is recaptured at up to 25%, and gains may owe capital-gains tax (a 1031 exchange can defer both). Figures are a year-1 estimate at your 24.0% rate — not tax advice; consult a CPA.
Schools (NCES district)
- District
- Hillsborough
- NCES district ID
- 1200870
- Math proficiency
- 47% ▼ -8.00%
- Reading proficiency
- 50% ▼ -4.00%
- Median HH income
- $50,622
- Composite
- 41.6/100
- National rank
- #3435
- State rank
- #41 of 73 in FL
Livability — Bloomingdale
- Score
- 71/100
- State rank
- #383
- US rank
- #6757
Category grades
Schools grade is shown separately in the Schools card above.
Census & demographics
- Census place
- Bloomingdale, FL
- County
- Hillsborough County · 1,540,968 people
- Metro
- Tampa-St. Petersburg-Clearwater, FL
- Population (ZIP)
- 62,138
- Household income
- $81,301
- Rent vs Own
- Severe rent burden
- 3073.0
Population outlook (Hillsborough County) Hauer SSP2
- Today (2025)
- 1,607,022 people
- By 2030
- 1,733,968 · +7.9%
- By 2040
- 1,979,565 · +23.2%
- By 2050
- 2,203,427 · +37.1%
- By 2075
- 2,667,893 · +66.0%
- By 2100
- 2,891,558 · +79.9%
Race, ethnicity, and origin ACS 2023
- Neighborhood character
- Diverse neighborhood (Simpson 0.68)
- Race & ethnicity
- White 45% Hispanic / Latino 30% Two or more races 18% Black 15% Asian 4%
- Hispanic origin (detail)
- Mexican 3% Puerto Rican 10% Cuban 6% Dominican 2%
- Common ancestry
- Romanian 2% Lithuanian 2% Slovak 2%
- Foreign-born
- 18% · Canada, Jamaica
- Languages at home
- 72% English-only · Spanish 22% Other Indo-European 2% Other Asian/Pacific 1%
Political lean MEDSL · Hillsborough
- 2024 margin
- Toss-up / Even · D 47.8% · R 50.9% · Other 1.3%
- 2008→2024 swing
- -10.2pp toward R · 2008: 7.1pp · 2024: -3.1pp
- All cycles
- 2024: R+3.1 2020: D+6.9 2016: D+6.8 2012: D+6.7 2008: D+7.1
Not yet ingested
- Civics
- —
Market trends
- HPI YoY
- ▼ -279.49%
- Current HPI
- 333.4744
- Rent YoY
- ▼ -1.17%
- Metro
- Tampa-St. Petersburg-Clearwater, FL
- State GDP YoY
- ▲ 3.28%
- F500 in state
- 36
Industry mix (Fortune 500 HQ in FL)
| Industry | F500 HQs | Revenue |
|---|---|---|
| Industrial Technology | 2 | $29B |
|
||
| Insurance | 2 | $17B |
|
||
| Retail | 1 | $60B |
|
||
| Technology Distribution | 1 | $58B |
|
||
| Homebuilding | 1 | $35B |
|
||
| Technology Manufacturing | 1 | $35B |
|
||
Price history
+98.5% since first listed11 events — show timeline
- 2025-02-05 Pending — Stellar MLS as Distributed by MLS Grid
- 2025-02-04 Listed $149,900 Stellar MLS as Distributed by MLS Grid
- 2024-10-29 Pending — Stellar MLS as Distributed by MLS Grid
- 2024-10-26 Listing Removed — Stellar MLS as Distributed by MLS Grid
- 2024-09-25 Listed $299,999 Stellar MLS as Distributed by MLS Grid
- 2004-11-29 Sold (Public Records) $161,000 Public Records
- 2004-11-19 Sold (MLS) $161,000 Stellar MLS as Distributed by MLS Grid
- 2004-10-04 Listed $161,000 Stellar MLS as Distributed by MLS Grid
- 1999-07-15 Sold (Public Records) $99,900 Public Records
- 1984-07-01 Sold (Public Records) $95,000 Public Records
- 1981-01-01 Sold (Public Records) $75,500 Public Records
Property tax history
+11.2%/yrLatest (2025): $5,688 · +11.2% YoY. Source: county tax records.
Cash-flow waterfall
monthlySold comps — $/sqft
last 12 mo · ≤1 miLoading sold comps…