 Duplex
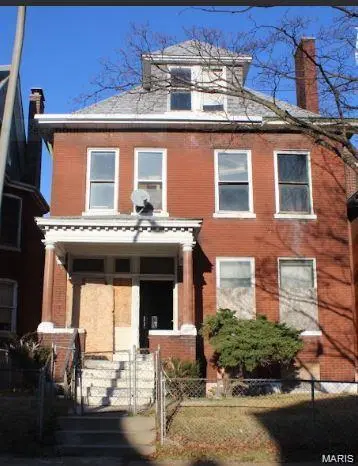
3225 Greer Ave · St. Louis, MO
Flood risk 1/10 · Minimal
- FEMA flood zone
- X (unshaded)
- Chance of flooding over 30 yrs
- 0.0%
- Est. flood insurance / yr
- $473 – $860
Fire risk 1/10 · Minimal
- Est. fire insurance / yr
- $1,054 – $1,958
Heat risk 5/10 · Moderate
- Hot days now (above 108°F)
- 7 days/yr
- Hot days in 30 yrs
- 21 days/yr
Wind risk 2/10 · Minimal
- Chance of severe wind over 30 yrs
- 1.0%
Air-quality risk 4/10 · Minor
- Unhealthy air days now
- 5 days/yr
- Unhealthy air days in 30 yrs
- 6 days/yr
Risk factors via First Street. Map © Google.
Why this score? — see what drove the C- grade
The composite is a weighted blend of 9 inputs, each scored 0–100. Each bar is that input's sub-score; the figure is the points it added to the 100-point composite (weight × sub-score).
- Cash flow +15.0/30.0
- ARV discount +15.0/15.0
- 1% rule +5.0/10.0
- DSCR +5.0/10.0
- Appreciation +4.1/10.0
- Rent growth +2.5/5.0
- Livability +2.5/5.0
- Condition / age +2.5/5.0
- Schools +1.2/10.0
$55,000
🖨 Deal sheet 📄 Offer letter ✓ Due diligence
Multi-family units
County records classify this as Multi-Family (2-4 Unit). Listing-text estimate: 2 units. confirmed
Listing remarks MLS
Possibilities abound in this gutted Two-family home. Are you an investor looking for your next property to buy and Flip? Perhaps you would like to restore the duplex and buy and hold it for tenants. Maybe you would like to design and customize your family’s next home. Whatever your real estate investment dreams are, this home will surely satisfy. This duplex has been gutted and framed into a single-family home while retaining most of the original architecture, design, and character. There are multiple fireplaces, brick walls, stained glass windows, hard wood floors and soaring ceilings just waiting for new life and your personal touch. Make an appointment and stop by with a flashlight and your design ideas and make this treasure yours!! Just a short 3 min drive to the new NGA Campus. Ideal location for the Sports enthusiast - Close to Ballpark Village, Cardinal Games, Hockey, Soccer and more.....
Key facts
- High ceilings
- Solid brick exterior
- 5,070 sq ft lot
Tags
Property features AI
Finance
- Other: Property listed as residential income (2–4 units)
- Financial info: Annual tax listed (2025): $228
Exterior
- Home design: Residential income property (2–4 units); Total living area about 3,178 square feet
- Construction: Brick exterior
- Exterior features: Brick construction; Lot approximately 0.116 acres; Located in the Jeff-Vander-Lou neighborhood
Interior
- Bedrooms: No bedrooms on main or upper levels indicated
- Bathrooms: No bathrooms on main or upper levels indicated
- Heating & cooling: Forced air heating; No central cooling
- Interior features: One fireplace located in the family room; Forced air heating
Neighborhood map
What this means for you Summary
Snapshot
- This is a 2 × 2-bed/1-bath units multifamily listed at $55k.
Deal economics
- At list price, monthly cash flow is $2k ($18k/yr) — positive. Per door: $754/mo.
- The deal already cash-flows at list — no discount required.
- Meets the 1% rule at list price ($2k rent vs $55k).
- Recommended offer: $54k (1.5% below list) — sets the bar for market timing.
- Cap rate 39.2% vs local median 5.0% in St. Louis — top-decile yield for the area; either an underpriced asset or a hidden risk that comps aren't pricing in. Stress-test before assuming the spread holds.
Location & tenants
- Location reads: area grade C — affects rentability + tenant quality, not the cash-flow math above.
- St. Louis City (urban): math 10% / reading 18% proficiency, ranked #312 of 324 in MO (top 96%) — low school quality limits family demand, transient renter base, plan for 1-2y turnover; 80% free/reduced lunch — lower-income household profile, screen leases tightly.
- Zoned schools: Columbia Elem. Comm. Ed. Ctr. (math 2% / reading 12%, grade F, #1,058 of 1,115 statewide, top 96%, 221 students, 99% FRL); Vashon High (math 2% / reading 2%, grade F, #520 of 521 statewide, top 100%, 568 students, 100% FRL) — zoned schools average 99% FRL vs 80% district-wide (19 pts higher); higher-poverty schools than district average — tighter screening recommended.
- Market conditions: 58 active listings in the ZIP; 2 comparable units currently listed for rent nearby; 294 units permitted in St. Louis city in 2024 (227 in 5+ unit buildings).
Forward outlook
- Local home prices are declining (-1.8%/yr); year-one equity from $380 of loan paydown is wiped out by about $964 of value loss. Plan a longer hold.
- St. Louis County population projected to shrink 6% by 2050 — rents likely to lag national; underwrite the cash flow, not the appreciation.
- At projected returns (-1.8% appreciation + 3.0% rent growth), your $15k cash investment doubles in ~1 year — after that, you're playing with house money.
Negotiation context
- It's been on market 17 days — a 2% lower offer ($54k) is reasonable based on typical stale-listing flexibility.
- 2 sale attempts since 2y ago with the ask held roughly flat each time — persistent listings suggest the price (not the market) is what's stuck; bring a comps-based counter.
Risks & watch-outs
- Watch-outs: built in 1907 — expect roof / HVAC / electrical / plumbing capex.
- Climate carrying-cost: extreme-heat days projected 7→21/yr by 2055 (HVAC capex compounding) — expect insurance premiums to compound above CPI over the hold.
Questions for the listing agent
- Can we see the unit-by-unit rent roll, current vacancy, and any below-market leases? What's the average tenancy length?
- What capital expenditures (roof, boiler, parking lot, exteriors) have been made in the last 5 years, and what's planned in the next 2?
- Built in 1907 — when were the roof, HVAC, electrical panel, plumbing, and water heater last replaced?
- Is there a deadline driving the sale (1031 exchange, divorce, estate, relocation)? That informs how much negotiation room exists.
- What's the average days-on-market for RENTAL listings here right now (not sales)? A rising rental-DOM trend means longer vacancies and softer asking-rent achievability than the comps imply.
- What's the recent tenant-quality profile in this submarket — average credit score on applications, eviction rate, late-payment / NSF rate, and stable-employment percentage? A property-management company in the area should have these aggregated.
- How much new apartment / multifamily construction is in the pipeline within 1–3 miles? Heavy new supply (>2% of stock underway) typically softens rents 12–24 months out; light construction supports rent growth.
Investment metrics
- 1% rule
- 4.23% ✓
- Cap rate
- 39.18%
- Cash-on-cash
- 117.47%
- DSCR
- 6.23
- GRM
- 2.0
CMA / ARV
- ARV (on-the-fly)
- $104,874
- Comps found
- 8
Show comp detail 8 sales within ~0.75 mi
| Address | Dist | Beds/Ba | Sqft | Sold | Price | $/sf | Match |
|---|---|---|---|---|---|---|---|
| 3858 Greer Ave | 0.41mi | —/— | 3,156 (-1%) | 0mo | $160,000 | $51 | 79 |
| 3203 Dodier St | 0.07mi | 12/3.0 | 3,112 (-2%) | 13mo | $125,000 | $40 | 78 |
| 3840 Saint Louis Ave | 0.42mi | 5/3.0 | 2,880 (-9%) | 11mo | $55,000 | $19 | 52 |
| 3843 Saint Ferdinand Ave | 0.59mi | 6/2.0 | 2,788 (-12%) | 1mo | $325,000 | $117 | 51 |
| 3800 Greer Ave #2 | 0.31mi | 5/2.0 | 2,726 (-14%) | 14mo | $79,900 | $29 | 50 |
| 4115 N Florissant Ave | 0.74mi | —/— | 2,904 (-9%) | 3mo | $25,000 | $9 | 48 |
| 3939 Greer Ave | 0.52mi | —/— | 2,756 (-13%) | 10mo | $89,900 | $33 | 45 |
| 4027 Palm St | 0.68mi | 12/6.0 | 2,914 (-8%) | 4mo | $72,900 | $25 | 35 |
Match score weights: distance 35% · size 25% · config 20% · recency 20%. Top-matched comps best support the ARV.
Projected returns pro-forma
-1.75% appreciation · 3.0% rent growth · sell at horizon
- IRR
- —
- Equity multiple
- 6.85×
- Total profit
- $90,034
- Equity at exit
- $11,318
- IRR
- —
- Equity multiple
- 14.29×
- Total profit
- $204,696
- Equity at exit
- $10,287
Cash invested: $15,400 (down + closing). Projections, not guarantees.
Landlord ↔ Tenant lean methodology
- Overall (STATE)
- 81 Strongly Landlord-Friendly
- State Missouri
- 81 Strongly Landlord-Friendly · R+10
- County
- — inherits STATE
- City
- — inherits STATE
ZIP-level market 63107
- Home prices YoY
- -1.9%
- Active inventory
- 58
- Price-to-rent
- 3.9×
Monthly cashflow live
- Estimated rent
- $2,326 high interval (Pro) →
- Mortgage (P&I)
- −$288
- Tax from tax record
- −$19 /mo · $225/yr
- Insurance
- −$23
- HOA
- −$0
- Vacancy / Maint / Mgmt
- −$488
- Net cashflow
- $1,507
Break-even live
2-unit breakdown (identical units grouped — click to expand)
| Units | Beds | Baths | Est. rent |
|---|---|---|---|
| 2× units | 2 | 1 | $2,326 |
| #1 | 2 | 1 | $1,163 |
| #2 | 2 | 1 | $1,163 |
| Total (2 units) | $2,326 | ||
UW: 25.0% down · 7.5% · 30yr · 1.5% tax · 5.0% vac · 8.0% maint · 8.0% mgmt
Financing live
Cash to close
- Down payment
- $13,750
- Closing costs
- $1,650
- Reserves months
- —
- Total cash needed
- —
Loan-product check · same deal, 3 products live
Conventional
25% down · 7.5% · 30yr
- Down + closing
- —
- Monthly P&I
- —
- Monthly cashflow
- —
- DSCR
- —
- Eligible?
- —
Personal DTI + credit; lowest rate.
DSCR
20% down · 8.5% · 30yr
- Down + closing
- —
- Monthly P&I
- —
- Monthly cashflow
- —
- DSCR
- —
- Eligible?
- —
No personal income docs; deal must DSCR.
Hard money
10% down · 12.0% · 12mo
- Down + closing
- —
- Monthly P&I
- —
- Monthly cashflow
- —
- DSCR
- —
- Eligible?
- —
Short-term bridge; refi at stabilization.
Rent comps 2 comps
| Address | Beds | Baths | Sqft | Rent | $/sqft | DOM | Units | Dist |
|---|---|---|---|---|---|---|---|---|
| 3127 Clay Ave Unit B St. Louis, MO | 1.0 | 1.0 | 3536 | $950 | $0.27 | 44d | 1 | 0.71mi |
| 1523 Angelrodt St Saint Louis, MO | 2.0 | 1.0 | 3049 | $1,000 | $0.33 | 18d | 1 | 1.00mi |
Listing history 12 events
-
2026-06-18days on market $55,000 Active 17 DOM
-
2026-06-17days on market $55,000 Active 16 DOM
-
2026-06-16days on market $55,000 Active 15 DOM
-
2026-06-15days on market $55,000 Active 14 DOM
-
2026-06-13days on market $55,000 Active 12 DOM
-
2026-06-09days on market $55,000 Active 8 DOM
-
2026-06-08days on market $55,000 Active 7 DOM
-
2026-06-07days on market $55,000 Active 6 DOM
-
2026-06-05days on market $55,000 Active 3 DOM
-
2026-06-03days on market $55,000 Active 2 DOM
-
2026-06-02remarks 389-char remark
-
2026-06-02$55,000 Active 1 DOM
ⓘ Source: listings_history table (triggers on properties + properties_extension) + one-shot
backfill from property_details.listing_events for pre-trigger history.
Tax reassessment forecast MO · Resets to sale price
- Current annual tax
- $225 · $19/mo
- Projected year-2 tax
- $534 · $44/mo
- Expected delta
- +$309/yr (+$26/mo · 137.4%)
ⓘ Screening estimate from a state-policy table — verify with the county assessor before closing.
Climate risk First Street
- Flood 1/10 Low FEMA zone X (unshaded) · 0% chance over 30 yrs
- Wildfire 1/10 Low
- Heat 5/10 Major 7 d/yr ≥108°F today · 21 d/yr by 30 yrs out
- Wind 2/10 Low 100% chance of damaging wind over 30 yrs
- Air quality 4/10 Moderate 5 unhealthy d/yr today · 6 by 30 yrs out
Nearby sold comps map
Loading sold comps map…
Walkable amenities ~0.75 mi
Loading nearby amenities…
Taxation est. · year 1
- Rental income
- $27,912
- − Mortgage interest
- −$3,081
- − Property taxes
- −$225
- − Insurance
- −$275
- − Repairs & maintenance
- −$2,233
- − Management
- −$2,233
- − Depreciation
- −$1,600
- Taxable income
- $18,265
- Est. tax owed @ 24.0%
- −$4,384
- After-tax cash flow
- $13,706/yr
For passive investors: Depreciation is non-cash, so a rental often shows a tax loss while cash-flowing — sheltering income. Rental losses are passive: they offset passive income freely, and up to $25,000/yr can offset ordinary (W-2) income if you actively participate and your MAGI is under $100k (phasing out to $0 by $150k); unused losses carry forward. On sale, claimed depreciation is recaptured at up to 25%, and gains may owe capital-gains tax (a 1031 exchange can defer both). Figures are a year-1 estimate at your 24.0% rate — not tax advice; consult a CPA.
Schools (NCES district)
- District
- St. Louis City
- NCES district ID
- 2929280
- Math proficiency
- 10% ▼ -6.00%
- Reading proficiency
- 18% ▼ -3.00%
- Median HH income
- $35,685
- Composite
- 11.54/100
- National rank
- #9699
- State rank
- #312 of 324 in MO
Livability — St. Louis
No livability data for this city. (Only ~50 U.S. cities are tracked.)
Census & demographics
- Census place
- St. Louis, MO
- City population
- 283,259
- Population (ZIP)
- 9,082
Population outlook (St. Louis County) Hauer SSP2
- Today (2025)
- 315,737 people
- By 2030
- 313,865 · -0.6%
- By 2040
- 305,439 · -3.3%
- By 2050
- 296,529 · -6.1%
- By 2075
- 271,028 · -14.2%
- By 2100
- 255,359 · -19.1%
Race, ethnicity, and origin ACS 2023
- Neighborhood character
- Predominantly Black (89%)
- Race & ethnicity
- Black 89% White 8% Hispanic / Latino 2% Two or more races 2%
- Common ancestry
- Lithuanian 1%
- Foreign-born
- 1% · Canada
- Languages at home
- 98% English-only · Spanish 1%
Political lean MEDSL · St. Louis
- 2024 margin
- Solid D (+64.7) · D 81.4% · R 16.7% · Other 2.0%
- 2008→2024 swing
- -3.5pp toward R · 2008: 68.2pp · 2024: 64.7pp
- All cycles
- 2024: D+64.7 2020: D+66.2 2016: D+63.7 2012: D+66.6 2008: D+68.2
Not yet ingested
- Civics
- —
Market trends
- HPI YoY
- ▼ -1.75%
- Current HPI
- 92.7423
- Rent YoY
- —
- Metro
- —
- State GDP YoY
- ▲ 1.84%
- F500 in state
- 20
Industry mix (Fortune 500 HQ in MO)
| Industry | F500 HQs | Revenue |
|---|---|---|
| Healthcare | 1 | $163B |
|
||
| Insurance | 1 | $21B |
|
||
| Industrial Technology | 1 | $17B |
|
||
| Retail | 1 | $16B |
|
||
| Industrial Distribution | 1 | $10B |
|
||
| Utilities | 1 | $9B |
|
||
Price history
-8.3% since first listed5 events — show timeline
- 2026-06-01 Listed $55,000 MARIS as Distributed by MLS Grid
- 2024-05-15 Sold (Public Records) $50,000 Public Records
- 2024-05-14 Sold (MLS) — MARIS as Distributed by MLS Grid
- 2024-05-06 Pending — MARIS as Distributed by MLS Grid
- 2024-02-25 Listed $60,000 MARIS as Distributed by MLS Grid
Property tax history
-2.8%/yrLatest (2024): $225 · +2.3% YoY. Source: county tax records.
Cash-flow waterfall
monthlySold comps — $/sqft
last 12 mo · ≤1 miLoading sold comps…