246 Deberry Rd · Mount Gilead, NC
Flood risk No data
- FEMA flood zone
- —
- Chance of flooding over 30 yrs
- —
- Est. flood insurance / yr
- —
Fire risk No data
- Est. fire insurance / yr
- —
Heat risk No data
- Hot days now (above threshold)
- —
- Hot days in 30 yrs
- —
Wind risk No data
- Chance of severe wind over 30 yrs
- —
Air-quality risk No data
- Unhealthy air days now
- —
- Unhealthy air days in 30 yrs
- —
Risk factors via First Street. Map © Google.
Why this score? — see what drove the D- grade
The composite is a weighted blend of 9 inputs, each scored 0–100. Each bar is that input's sub-score; the figure is the points it added to the 100-point composite (weight × sub-score).
- Cash flow +10.3/30.0
- ARV discount +7.5/15.0
- Appreciation +4.5/10.0
- Livability +3.7/5.0
- DSCR +3.0/10.0
- Schools +2.6/10.0
- Rent growth +2.5/5.0
- Condition / age +2.5/5.0
- 1% rule +1.8/10.0
$285,000
🖨 Deal sheet 📄 Offer letter ✓ Due diligence
Listing remarks
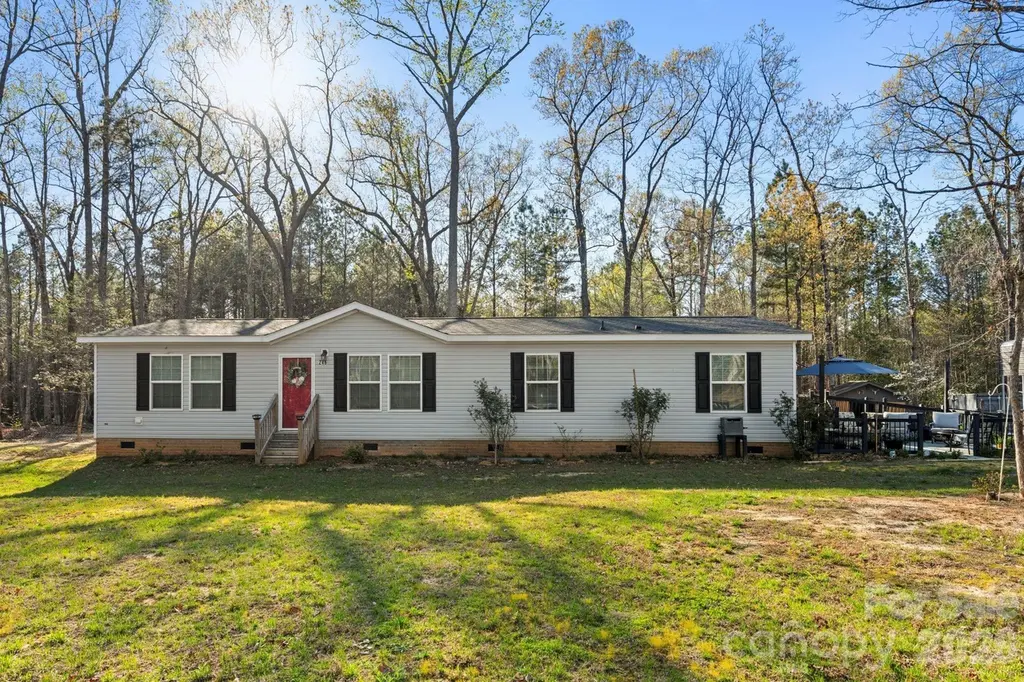
Looking for privacy on several acres of land? Meticulously maintained home with a large deck and three acres of land. The home has an open floorplan and an oversized island in the kitchen that can seat a family and all women will love. The master bedroom is large with a wonderful bath and walk in closet. It has great storage inside the home and out. Stepping outside you will find two storage buildings and a double carport. The deck is the perfect place for entertaining and having a party, or just sit on a cool summer night and enjoy the solitude. If you love the country, but want convenience, it is only a 15 drive to Albemarle or Troy. So come take a look. .. you will love this one.
Key facts
- Large deck
- Great storage
- Open floorplan
Tags
Neighborhood map
What this means for you Summary
Snapshot
- This is a 3-bed/2.0-bath manufactured listed at $285k.
Deal economics
- At list price, monthly cash flow is $-154 ($-2k/yr) — negative.
- To cash-flow at today's rent, offer at most $258k (9.6% below list).
- To meet the 1% rule (rent ≥ 1% of price), the offer needs to be $193k (32.1% below list).
- Recommended offer: $193k (32.1% below list) — sets the bar for 1% rule.
Location & tenants
- Location reads 74/100 on livability (#58 in NC, #4,548 nationally) — a middle-class / working-renter tenant base. Strengths: cost of living A+, health & safety A+, crime A; Watch: schools F, amenities F, commute F.
- Montgomery County Schools (rural): math 29% / reading 34% proficiency, ranked #143 of 178 in NC (top 80%) — families likely to look elsewhere, expect single-tenant / working-renter base with shorter leases; 66% free/reduced lunch — lower-income household profile, screen leases tightly.
- Market conditions: 113 active listings in the ZIP; 138 units permitted in Montgomery County in 2024 (0 in 5+ unit buildings).
Forward outlook
- Local home prices are declining (-0.9%/yr); year-one equity from $2k of loan paydown is wiped out by about $3k of value loss. Plan a longer hold.
- Montgomery County population projected at -17% by 2050 — secular population decline; favor cash flow + early exit over multi-decade hold.
Negotiation context
- Only 10 days on market — expect competitive offers; lowballing is unlikely to land.
Questions for the listing agent
- What do current leases actually rent for vs. the listed asking? Can we see a recent rent roll and the last 12 months of T-12 income?
- Is there a deadline driving the sale (1031 exchange, divorce, estate, relocation)? That informs how much negotiation room exists.
- Schools are F-rated, which usually means shorter tenancies and higher turnover. Who's the typical renter profile here, and what's been the actual vacancy rate?
- The area grade is low — what's the realistic commute time and amenity access for the typical tenant pool here? Any planned neighborhood developments (good or bad) we should know about?
- What's the average days-on-market for RENTAL listings here right now (not sales)? A rising rental-DOM trend means longer vacancies and softer asking-rent achievability than the comps imply.
- What's the recent tenant-quality profile in this submarket — average credit score on applications, eviction rate, late-payment / NSF rate, and stable-employment percentage? A property-management company in the area should have these aggregated.
- How much new for-sale + rental construction is in the pipeline within 1–3 miles? Heavy new supply typically softens prices + rents 12–24 months out; constrained supply supports both.
Investment metrics
- 1% rule
- 0.68% ✗
- Cap rate
- 5.64%
- Cash-on-cash
- -2.32%
- DSCR
- 0.90
- GRM
- 12.3
CMA / ARV
No comps found within radius.
Projected returns pro-forma
-0.94% appreciation · 3.0% rent growth · sell at horizon
- IRR
- -8.8%
- Equity multiple
- 0.62×
- Total profit
- $-30,645
- Equity at exit
- $69,643
- IRR
- -2.1%
- Equity multiple
- 0.80×
- Total profit
- $-15,910
- Equity at exit
- $73,854
Cash invested: $79,800 (down + closing). Projections, not guarantees.
Landlord ↔ Tenant lean methodology
- Overall (STATE)
- 85 Strongly Landlord-Friendly
- State North Carolina
- 85 Strongly Landlord-Friendly · R+3
- County
- — inherits STATE
- City
- — inherits STATE
ZIP-level market 27306
- Home prices YoY
- -0.3%
- Active inventory
- 113
- Price-to-rent
- 12.3×
Monthly cashflow live
- Estimated rent
- $1,934 medium interval (Pro) →
- Mortgage (P&I)
- −$1,495
- Tax from tax record
- −$69 /mo · $828/yr
- Insurance
- −$119
- HOA
- −$0
- Vacancy / Maint / Mgmt
- −$406
- Net cashflow
- $-154
Break-even live
UW: 25.0% down · 7.5% · 30yr · 1.5% tax · 5.0% vac · 8.0% maint · 8.0% mgmt
Financing live
Cash to close
- Down payment
- $71,250
- Closing costs
- $8,550
- Reserves months
- —
- Total cash needed
- —
Loan-product check · same deal, 3 products live
Conventional
25% down · 7.5% · 30yr
- Down + closing
- —
- Monthly P&I
- —
- Monthly cashflow
- —
- DSCR
- —
- Eligible?
- —
Personal DTI + credit; lowest rate.
DSCR
20% down · 8.5% · 30yr
- Down + closing
- —
- Monthly P&I
- —
- Monthly cashflow
- —
- DSCR
- —
- Eligible?
- —
No personal income docs; deal must DSCR.
Hard money
10% down · 12.0% · 12mo
- Down + closing
- —
- Monthly P&I
- —
- Monthly cashflow
- —
- DSCR
- —
- Eligible?
- —
Short-term bridge; refi at stabilization.
Listing history 3 events
-
2026-04-03status Pending
-
2026-04-01historical Active Under Contract
-
2026-03-23$285,000 Active
ⓘ Source: listings_history table (triggers on properties + properties_extension) + one-shot
backfill from property_details.listing_events for pre-trigger history.
Tax reassessment forecast NC · Resets to sale price
- Current annual tax
- $828 · $69/mo
- Projected year-2 tax
- $2,337 · $195/mo
- Expected delta
- +$1,509/yr (+$126/mo · 182.3%)
ⓘ Screening estimate from a state-policy table — verify with the county assessor before closing.
Nearby sold comps map
Loading sold comps map…
Walkable amenities ~0.75 mi
Loading nearby amenities…
Taxation est. · year 1
- Rental income
- $23,208
- − Mortgage interest
- −$15,964
- − Property taxes
- −$828
- − Insurance
- −$1,425
- − Repairs & maintenance
- −$1,857
- − Management
- −$1,857
- − Depreciation
- −$8,291
- Taxable loss
- −$7,013
- Est. tax savings @ 24.0%
- +$1,683
- After-tax cash flow
- $-170/yr
For passive investors: Depreciation is non-cash, so a rental often shows a tax loss while cash-flowing — sheltering income. Rental losses are passive: they offset passive income freely, and up to $25,000/yr can offset ordinary (W-2) income if you actively participate and your MAGI is under $100k (phasing out to $0 by $150k); unused losses carry forward. On sale, claimed depreciation is recaptured at up to 25%, and gains may owe capital-gains tax (a 1031 exchange can defer both). Figures are a year-1 estimate at your 24.0% rate — not tax advice; consult a CPA.
Schools (NCES district)
- District
- Montgomery County Schools
- NCES district ID
- 3703060
- Math proficiency
- 29% ▼ -6.00%
- Reading proficiency
- 34% ▼ -2.00%
- Median HH income
- $34,706
- Composite
- 25.97/100
- National rank
- #7328
- State rank
- #143 of 178 in NC
Livability — Mount Gilead
- Score
- 74/100
- State rank
- #58
- US rank
- #4548
Category grades
Schools grade is shown separately in the Schools card above.
Census & demographics
- Population (ZIP)
- 5,457
Population outlook (Montgomery County) Hauer SSP2
- Today (2025)
- 26,533 people
- By 2030
- 25,724 · -3.0%
- By 2040
- 23,842 · -10.1%
- By 2050
- 22,077 · -16.8%
- By 2075
- 18,754 · -29.3%
- By 2100
- 15,537 · -41.4%
Race, ethnicity, and origin ACS 2023
- Neighborhood character
- Majority White (64%)
- Race & ethnicity
- White 64% Black 26% Asian 6% Hispanic / Latino 2% Two or more races 2%
- Common ancestry
- Slovak 2% Serbian 1% Iranian 1%
- Foreign-born
- 6% · China, Canada, Philippines
- Languages at home
- 92% English-only · Other Asian/Pacific 5% Spanish 2% Chinese 1%
Political lean MEDSL · Montgomery
- 2024 margin
- Solid R (+37.8) · D 30.8% · R 68.6%
- 2008→2024 swing
- -26.9pp toward R · 2008: -11.0pp · 2024: -37.8pp
- All cycles
- 2024: R+37.8 2020: R+31.8 2016: R+25.9 2012: R+15.2 2008: R+11.0
Not yet ingested
- Civics
- —
Market trends
- HPI YoY
- ▼ -0.94%
- Current HPI
- 334.2599
- Rent YoY
- —
- Metro
- —
- State GDP YoY
- ▲ 3.28%
- F500 in state
- 26
Industry mix (Fortune 500 HQ in NC)
| Industry | F500 HQs | Revenue |
|---|---|---|
| Financial Services | 2 | $213B |
|
||
| Retail | 2 | $95B |
|
||
| Industrial Conglomerate | 1 | $38B |
|
||
| Metals / Steel | 1 | $35B |
|
||
| Utilities | 1 | $30B |
|
||
| Industrial Machinery | 1 | $19B |
|
||
Price history
3 events — show timeline
- 2026-04-03 Pending — CANOPYMLS as Distributed by MLS Grid
- 2026-04-01 Contingent — CANOPYMLS as Distributed by MLS Grid
- 2026-03-23 Listed $285,000 CANOPYMLS as Distributed by MLS Grid
Property tax history
+0.0%/yrLatest (2025): $828 · +0.0% YoY. Source: county tax records.
Cash-flow waterfall
monthlySold comps — $/sqft
last 12 mo · ≤1 miLoading sold comps…