802 S Broadway · Havana, IL
Flood risk 1/10 · Minimal
- FEMA flood zone
- X (unshaded)
- Chance of flooding over 30 yrs
- 0.0%
- Est. flood insurance / yr
- $473 – $860
Fire risk 1/10 · Minimal
- Est. fire insurance / yr
- $804 – $1,492
Heat risk 3/10 · Minor
- Hot days now (above 107°F)
- 7 days/yr
- Hot days in 30 yrs
- 19 days/yr
Wind risk 2/10 · Minimal
- Chance of severe wind over 30 yrs
- 1.0%
Air-quality risk 2/10 · Minimal
- Unhealthy air days now
- 1 days/yr
- Unhealthy air days in 30 yrs
- 2 days/yr
Risk factors via First Street. Map © Google.
Why this score? — see what drove the B- grade
The composite is a weighted blend of 9 inputs, each scored 0–100. Each bar is that input's sub-score; the figure is the points it added to the 100-point composite (weight × sub-score).
- Cash flow +30.0/30.0
- 1% rule +10.0/10.0
- DSCR +10.0/10.0
- ARV discount +7.5/15.0
- Livability +3.0/5.0
- Rent growth +2.5/5.0
- Condition / age +2.5/5.0
- Schools +1.7/10.0
- Appreciation +0.0/10.0
$35,000
🖨 Deal sheet 📄 Offer letter ✓ Due diligence
Listing remarks
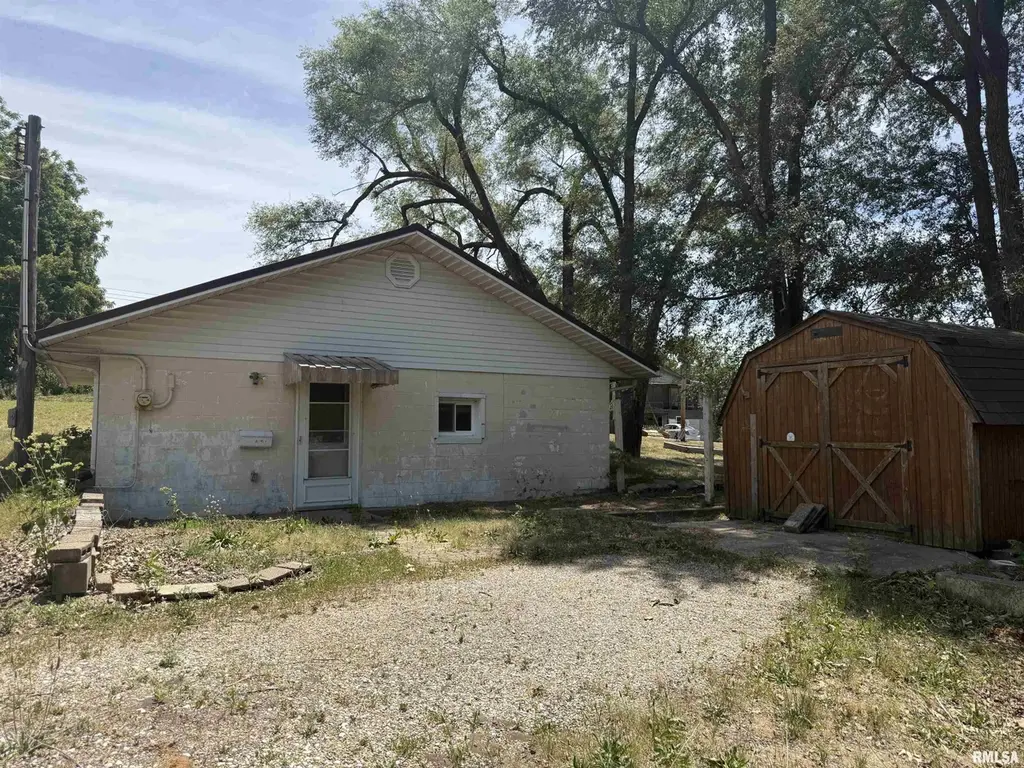
1 bed 1 bath home in need of some TLC, but, would be a darling home for the right person with the willingness to put a little work in to create a perfect little hideaway. Block built solid home on a large corner lot with a nice sized yard. Medal roof and on all 1 level makes this a great property for all. There is main floor laundry and a 10 x 16 yard barn.
Key facts
- Main floor laundry
- Yard barn
- Corner lot
Tags
Property features AI
Exterior
- Parking: Gravel parking; No garage spaces
- Utilities: Public water; Public sewer
- Home design: Single family residence; Property has attached neighbors
- Construction: Built in 1954
- Exterior features: Corner lot; Sloped lot; Metal roof
Interior
- Kitchen: Refrigerator
- Bedrooms: 1 bedroom (main level)
- Flooring: Tile in living room and kitchen; Other flooring in bedroom
- Bathrooms: 1 full bathroom
- Heating & cooling: Central air; Forced air heating; Electric water heater
- Interior features: Refrigerator included; No basement; No fireplaces
Neighborhood map
What this means for you Summary
Snapshot
- This is a 1-bed/1.0-bath other listed at $35k.
Deal economics
- At list price, monthly cash flow is $570 ($7k/yr) — positive.
- The deal already cash-flows at list — no discount required.
- Meets the 1% rule at list price ($1k rent vs $35k).
Location & tenants
- Location reads 60/100 on livability (#989 in IL) — a middle-class / working-renter tenant base. Strengths: cost of living A+, housing A+; Watch: crime F, amenities F, commute F.
- Havana CUSD 126 (town): math 17% / reading 22% proficiency, ranked #448 of 620 in IL (top 72%) — low school quality limits family demand, transient renter base, plan for 1-2y turnover.
- Zoned schools: Havana High School (math 15% / reading 24%, grade F, #379 of 693 statewide, top 57%, 279 students, 0% FRL) — zoned schools average 0% FRL vs 47% district-wide (47 pts lower); this property's tenant base skews higher-income than the district average.
- Market conditions: 36 active listings in the ZIP; 7 units permitted in Mason County in 2024 (0 in 5+ unit buildings).
Forward outlook
- Local home prices are declining (-3.0%/yr); year-one equity from $242 of loan paydown is wiped out by about $1k of value loss. Plan a longer hold.
- Mason County population projected at -30% by 2050 — secular population decline; favor cash flow + early exit over multi-decade hold.
- At projected returns (-3.0% appreciation + 3.0% rent growth), your $10k cash investment doubles in ~2 years — after that, you're playing with house money.
Negotiation context
- Only 11 days on market — expect competitive offers; lowballing is unlikely to land.
- Current owner paid $20k; list at $35k implies a 75% gain — meaningful room to come down on a strong offer.
Risks & watch-outs
- Watch-outs: built in 1954 — expect roof / HVAC / electrical / plumbing capex.
Questions for the listing agent
- Built in 1954 — when were the roof, HVAC, electrical panel, plumbing, and water heater last replaced?
- Is there a deadline driving the sale (1031 exchange, divorce, estate, relocation)? That informs how much negotiation room exists.
- Schools are D-rated, which usually means shorter tenancies and higher turnover. Who's the typical renter profile here, and what's been the actual vacancy rate?
- Crime grade is F in this area — have there been break-ins, vandalism, or insurance claims at this property in the last 3 years? What carrier currently insures it and at what premium?
- What's the average days-on-market for RENTAL listings here right now (not sales)? A rising rental-DOM trend means longer vacancies and softer asking-rent achievability than the comps imply.
- What's the recent tenant-quality profile in this submarket — average credit score on applications, eviction rate, late-payment / NSF rate, and stable-employment percentage? A property-management company in the area should have these aggregated.
- How much new for-sale + rental construction is in the pipeline within 1–3 miles? Heavy new supply typically softens prices + rents 12–24 months out; constrained supply supports both.
Investment metrics
- 1% rule
- 3.02% ✓
- Cap rate
- 25.82%
- Cash-on-cash
- 69.74%
- DSCR
- 4.10
- GRM
- 2.8
CMA / ARV
No comps found within radius.
Projected returns pro-forma
-3.0% appreciation · 3.0% rent growth · sell at horizon
- IRR
- 69.3%
- Equity multiple
- 4.13×
- Total profit
- $30,631
- Equity at exit
- $5,219
- IRR
- 73.3%
- Equity multiple
- 8.50×
- Total profit
- $73,502
- Equity at exit
- $3,026
Cash invested: $9,800 (down + closing). Projections, not guarantees.
Landlord ↔ Tenant lean methodology
- Overall (STATE)
- 43 Moderately Tenant-Leaning
- State Illinois
- 43 Moderately Tenant-Leaning · D+7
- County
- — inherits STATE
- City
- — inherits STATE
ZIP-level market 62644
- Home prices YoY
- -14.0%
- Active inventory
- 36
- Price-to-rent
- 2.8×
Monthly cashflow live
- Estimated rent
- $1,056 medium interval (Pro) →
- Mortgage (P&I)
- −$184
- Tax from tax record
- −$67 /mo · $801/yr
- Insurance
- −$15
- HOA
- −$0
- Vacancy / Maint / Mgmt
- −$222
- Net cashflow
- $570
Break-even live
UW: 25.0% down · 7.5% · 30yr · 1.5% tax · 5.0% vac · 8.0% maint · 8.0% mgmt
Financing live
Cash to close
- Down payment
- $8,750
- Closing costs
- $1,050
- Reserves months
- —
- Total cash needed
- —
Loan-product check · same deal, 3 products live
Conventional
25% down · 7.5% · 30yr
- Down + closing
- —
- Monthly P&I
- —
- Monthly cashflow
- —
- DSCR
- —
- Eligible?
- —
Personal DTI + credit; lowest rate.
DSCR
20% down · 8.5% · 30yr
- Down + closing
- —
- Monthly P&I
- —
- Monthly cashflow
- —
- DSCR
- —
- Eligible?
- —
No personal income docs; deal must DSCR.
Hard money
10% down · 12.0% · 12mo
- Down + closing
- —
- Monthly P&I
- —
- Monthly cashflow
- —
- DSCR
- —
- Eligible?
- —
Short-term bridge; refi at stabilization.
Listing history 9 events
-
2026-06-16status $35,000 Pending 11 DOM
-
2026-06-15days on market $35,000 Active 11 DOM
-
2026-06-13days on market $35,000 Active 9 DOM
-
2026-06-12days on market $35,000 Active 8 DOM
-
2026-06-09days on market $35,000 Active 5 DOM
-
2026-06-08days on market $35,000 Active 4 DOM
-
2026-06-07days on market $35,000 Active 3 DOM
-
2026-06-05remarks 359-char remark
-
2026-06-05$35,000 Active 1 DOM
ⓘ Source: listings_history table (triggers on properties + properties_extension) + one-shot
backfill from property_details.listing_events for pre-trigger history.
Tax reassessment forecast IL · Partial reset (capped growth)
- Current annual tax
- $801 · $67/mo
- Projected year-2 tax
- $801 · $67/mo
- Expected delta
- $0/yr ($0/mo · 0.0%)
ⓘ Screening estimate from a state-policy table — verify with the county assessor before closing.
Climate risk First Street
- Flood 1/10 Low FEMA zone X (unshaded) · 0% chance over 30 yrs
- Wildfire 1/10 Low
- Heat 3/10 Moderate 7 d/yr ≥107°F today · 19 d/yr by 30 yrs out
- Wind 2/10 Low 100% chance of damaging wind over 30 yrs
- Air quality 2/10 Low 1 unhealthy d/yr today · 2 by 30 yrs out
Nearby sold comps map
Loading sold comps map…
Walkable amenities ~0.75 mi
Loading nearby amenities…
Taxation est. · year 1
- Rental income
- $12,674
- − Mortgage interest
- −$1,961
- − Property taxes
- −$801
- − Insurance
- −$175
- − Repairs & maintenance
- −$1,014
- − Management
- −$1,014
- − Depreciation
- −$1,018
- Taxable income
- $6,692
- Est. tax owed @ 24.0%
- −$1,606
- After-tax cash flow
- $5,228/yr
For passive investors: Depreciation is non-cash, so a rental often shows a tax loss while cash-flowing — sheltering income. Rental losses are passive: they offset passive income freely, and up to $25,000/yr can offset ordinary (W-2) income if you actively participate and your MAGI is under $100k (phasing out to $0 by $150k); unused losses carry forward. On sale, claimed depreciation is recaptured at up to 25%, and gains may owe capital-gains tax (a 1031 exchange can defer both). Figures are a year-1 estimate at your 24.0% rate — not tax advice; consult a CPA.
Schools (NCES district)
- District
- Havana CUSD 126
- NCES district ID
- 1718510
- Math proficiency
- 17% ▼ -10.00%
- Reading proficiency
- 22% ▼ -16.00%
- Median HH income
- $39,881
- Composite
- 16.52/100
- National rank
- #9181
- State rank
- #448 of 620 in IL
Livability — Havana
- Score
- 60/100
- State rank
- #989
- US rank
- #19077
Category grades
Schools grade is shown separately in the Schools card above.
Census & demographics
- Census place
- Havana, IL
- City population
- 4,657
- Population (ZIP)
- 4,657
Population outlook (Mason County) Hauer SSP2
- Today (2025)
- 12,087 people
- By 2030
- 11,283 · -6.7%
- By 2040
- 9,766 · -19.2%
- By 2050
- 8,421 · -30.3%
- By 2075
- 5,785 · -52.1%
- By 2100
- 3,888 · -67.8%
Race, ethnicity, and origin ACS 2023
- Neighborhood character
- Predominantly White (93%)
- Race & ethnicity
- White 93% Two or more races 3% Hispanic / Latino 3%
- Common ancestry
- Slovak 3% Lithuanian 2% Italian 2%
- Foreign-born
- 1% · Canada, Jamaica
- Languages at home
- 98% English-only · Spanish 2%
Political lean MEDSL · Mason
- 2024 margin
- Solid R (+42.2) · D 27.8% · R 70.1% · Other 2.1%
- 2008→2024 swing
- -48.1pp toward R · 2008: 5.9pp · 2024: -42.2pp
- All cycles
- 2024: R+42.2 2020: R+39.5 2016: R+31.8 2012: R+6.3 2008: D+5.9
Not yet ingested
- Civics
- —
Market trends
- HPI YoY
- ▼ -18.81%
- Current HPI
- 115.1077
- Rent YoY
- —
- Metro
- —
- State GDP YoY
- ▲ 1.59%
- F500 in state
- 60
Industry mix (Fortune 500 HQ in IL)
| Industry | F500 HQs | Revenue |
|---|---|---|
| Insurance | 4 | $201B |
|
||
| Consumer Goods | 4 | $87B |
|
||
| Industrial Machinery | 3 | $64B |
|
||
| Healthcare | 2 | $55B |
|
||
| Retail / Pharmacy | 1 | $148B |
|
||
| Agriculture / Food | 1 | $86B |
|
||
Price history
+75.0% since first listed2 events — show timeline
- 2026-06-03 Listed $35,000 RMLSA as Distributed by MLS Grid
- 2008-01-16 Sold (Public Records) $20,000 Public Records
Property tax history
+0.0%/yrLatest (2024): $801 · -1.8% YoY. Source: county tax records.
Cash-flow waterfall
monthlySold comps — $/sqft
last 12 mo · ≤1 miLoading sold comps…