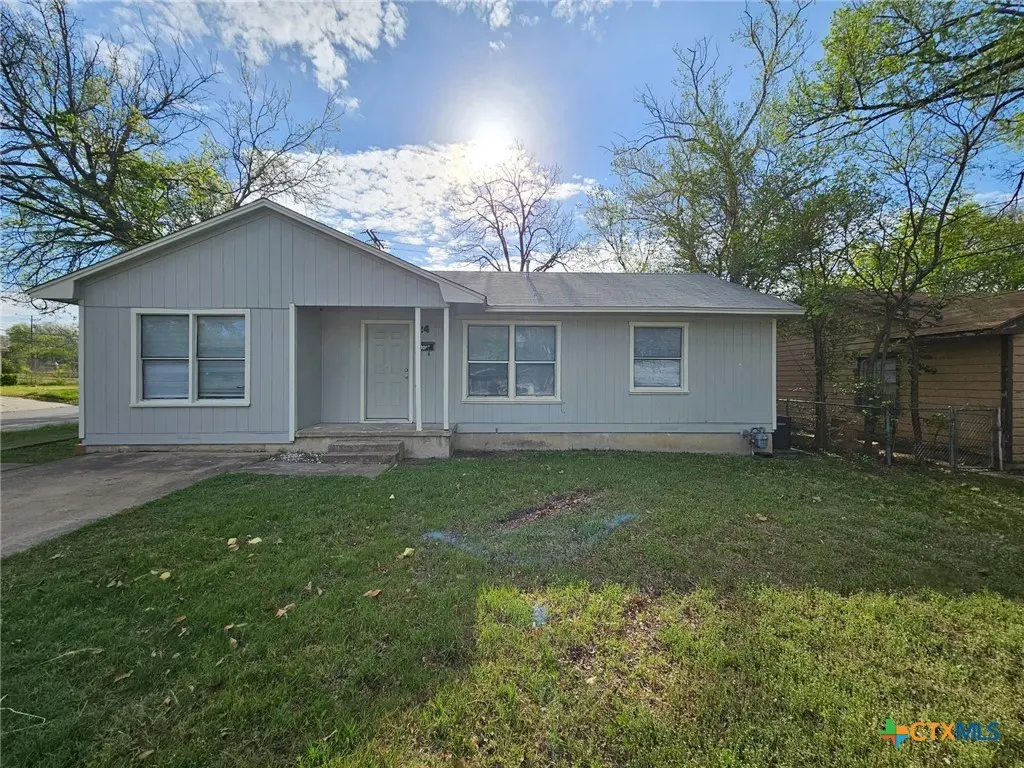
24 S 28th St · Killeen, TX
Flood risk 1/10 · Minimal
- FEMA flood zone
- X (shaded)
- Chance of flooding over 30 yrs
- 0.0%
- Est. flood insurance / yr
- $507 – $1,088
Fire risk 2/10 · Minimal
- Est. fire insurance / yr
- $1,222 – $2,270
Heat risk 7/10 · Major
- Hot days now (above 107°F)
- 7 days/yr
- Hot days in 30 yrs
- 23 days/yr
Wind risk 6/10 · Moderate
- Chance of severe wind over 30 yrs
- 62.0%
Air-quality risk 1/10 · Minimal
- Unhealthy air days now
- 0 days/yr
- Unhealthy air days in 30 yrs
- 0 days/yr
Risk factors via First Street. Map © Google.
Why this score? — see what drove the C+ grade
The composite is a weighted blend of 9 inputs, each scored 0–100. Each bar is that input's sub-score; the figure is the points it added to the 100-point composite (weight × sub-score).
- Cash flow +18.3/30.0
- ARV discount +15.0/15.0
- Appreciation +6.1/10.0
- 1% rule +5.9/10.0
- DSCR +5.7/10.0
- Livability +3.2/5.0
- Schools +3.0/10.0
- Condition / age +2.5/5.0
- Rent growth +2.0/5.0
$99,900
🖨 Deal sheet 📄 Offer letter ✓ Due diligence
Listing remarks MLS
This charming 3-bedroom, 1-bath Single Family Home offers a fantastic opportunity for investors or buyers looking to add their personal touch. Featuring wood flooring throughout. Conveniently located with easy access to shopping, dining, and local amenities.
Key facts
- Wood flooring
- Local amenities
- 7,509 sq ft lot
Tags
Neighborhood map
What this means for you Summary
Snapshot
- This is a 3-bed/1.0-bath single-family listed at $100k.
Deal economics
- At list price, monthly cash flow is $91 ($1k/yr) — positive.
- The deal already cash-flows at list — no discount required.
- Meets the 1% rule at list price ($1k rent vs $100k).
- Recommended offer: $97k (3.0% below list) — sets the bar for market timing.
- Cap rate 7.4% vs local median 3.9% in Killeen — top-decile yield for the area; either an underpriced asset or a hidden risk that comps aren't pricing in. Stress-test before assuming the spread holds.
Location & tenants
- Location reads 63/100 on livability (#853 in TX) — a middle-class / working-renter tenant base. Strengths: cost of living A+, housing A+; Watch: schools D+, amenities D, employment D.
- Killeen ISD (urban): math 31% / reading 38% proficiency, ranked #524 of 826 in TX (top 63%) — families likely to look elsewhere, expect single-tenant / working-renter base with shorter leases.
- Market conditions: Rents soft (-2.0%/yr); 123 active listings in the ZIP; 40 comparable units currently listed for rent nearby; rentals at typical pace (median 24d on market — plan ~3-4 weeks tenant-placement turnaround); 42% of comp listings sitting > 30 days — soft ceiling on asking rent; lower-income renter base — watch delinquency; 3,222 units permitted in Bell County in 2024 (246 in 5+ unit buildings).
- This rent runs 35% of the median local income ($37k/yr) — at the standard rent-burdened threshold; future hikes will face affordability resistance.
Forward outlook
- In year one you build about $3k of equity ($691 loan paydown + $2k appreciation (2.3% local appreciation)).
- Bell County population projected at +21% by 2050 — long-run rental-demand tailwind backs the buy-and-hold thesis.
- At projected returns (2.3% appreciation + 0.0% rent growth), your $28k cash investment doubles in ~7 years — after that, you're playing with house money.
Negotiation context
- It's been on market 47 days — a 3% lower offer ($97k) is reasonable based on typical stale-listing flexibility.
- 4 sale attempts since 2y ago with the ask held roughly flat each time — persistent listings suggest the price (not the market) is what's stuck; bring a comps-based counter.
Risks & watch-outs
- Climate carrying-cost: major wind risk, 62% chance of damaging wind over 30y; extreme-heat days projected 7→23/yr by 2055 (HVAC capex compounding) — expect insurance premiums to compound above CPI over the hold.
Questions for the listing agent
- It's been on market 47 days. Have you received any prior offers? Is the seller open to a 3% concession, seller financing, or rate buy-down credit?
- Built in 1962 — when were the roof, HVAC, electrical panel, plumbing, and water heater last replaced?
- Is there a deadline driving the sale (1031 exchange, divorce, estate, relocation)? That informs how much negotiation room exists.
- Schools are D-rated, which usually means shorter tenancies and higher turnover. Who's the typical renter profile here, and what's been the actual vacancy rate?
- Crime grade is D in this area — have there been break-ins, vandalism, or insurance claims at this property in the last 3 years? What carrier currently insures it and at what premium?
- What's the average days-on-market for RENTAL listings here right now (not sales)? A rising rental-DOM trend means longer vacancies and softer asking-rent achievability than the comps imply.
- What's the recent tenant-quality profile in this submarket — average credit score on applications, eviction rate, late-payment / NSF rate, and stable-employment percentage? A property-management company in the area should have these aggregated.
- How much new for-sale + rental construction is in the pipeline within 1–3 miles? Heavy new supply typically softens prices + rents 12–24 months out; constrained supply supports both.
Investment metrics
- 1% rule
- 1.09% ✓
- Cap rate
- 7.39%
- Cash-on-cash
- 3.93%
- DSCR
- 1.17
- GRM
- 7.7
CMA / ARV
- ARV (median comp)
- $143,565
- List price
- $99,900
- Delta
- -30.41%
- Verdict
- UNDERPRICED
- Comps
- 20 within 1.0 mi
Show comp detail 8 sales within ~0.75 mi
| Address | Dist | Beds/Ba | Sqft | Sold | Price | $/sf | Match |
|---|---|---|---|---|---|---|---|
| 601 Cardinal Ave | 0.31mi | 3/2.0 | 1,092 (-3%) | 4mo | $146,800 | $134 | 73 |
| 504 Alexander St | 0.25mi | 3/1.5 | 1,218 (+8%) | 3mo | $140,300 | $115 | 71 |
| 602 Brook Dr | 0.48mi | 2/1.0 (-1) | 1,169 (+4%) | 3mo | $45,000 | $38 | 64 |
| 502 Cardinal Ave | 0.25mi | 3/1.5 | 1,202 (+7%) | 16mo | $145,000 | $121 | 62 |
| 608 N 24th St | 0.35mi | 3/1.0 | 1,008 (-11%) | 19mo | $150,000 | $149 | 50 |
| 1004 Stewart St | 0.59mi | 3/1.0 | 995 (-12%) | 8mo | $67,500 | $68 | 46 |
| 508 Brook Dr | 0.54mi | 3/1.0 | 1,235 (+10%) | 24mo | $95,000 | $77 | 40 |
| 910 Sutton Dr | 0.69mi | 3/1.0 | 1,056 (-6%) | 23mo | $120,000 | $114 | 38 |
Match score weights: distance 35% · size 25% · config 20% · recency 20%. Top-matched comps best support the ARV.
Projected returns pro-forma
2.26% appreciation · 0.0% rent growth · sell at horizon
- IRR
- 7.2%
- Equity multiple
- 1.39×
- Total profit
- $10,896
- Equity at exit
- $40,823
- IRR
- 8.7%
- Equity multiple
- 2.14×
- Total profit
- $31,924
- Equity at exit
- $59,897
Cash invested: $27,972 (down + closing). Projections, not guarantees.
Landlord ↔ Tenant lean methodology
- Overall (STATE)
- 87 Strongly Landlord-Friendly
- State Texas
- 87 Strongly Landlord-Friendly · R+5
- County
- — inherits STATE
- City
- — inherits STATE
ZIP-level market 76541
- Home prices YoY
- 1.4%
- Rents YoY
- -2.0%
- Active inventory
- 123
- Price-to-rent
- 7.7×
Monthly cashflow live
- Estimated rent
- $1,084 high interval (Pro) →
- Mortgage (P&I)
- −$524
- Tax from tax record
- −$200 /mo · $2,397/yr
- Insurance
- −$42
- HOA
- −$0
- Vacancy / Maint / Mgmt
- −$228
- Net cashflow
- $91
Break-even live
UW: 25.0% down · 7.5% · 30yr · 1.5% tax · 5.0% vac · 8.0% maint · 8.0% mgmt
Financing live
Cash to close
- Down payment
- $24,975
- Closing costs
- $2,997
- Reserves months
- —
- Total cash needed
- —
Loan-product check · same deal, 3 products live
Conventional
25% down · 7.5% · 30yr
- Down + closing
- —
- Monthly P&I
- —
- Monthly cashflow
- —
- DSCR
- —
- Eligible?
- —
Personal DTI + credit; lowest rate.
DSCR
20% down · 8.5% · 30yr
- Down + closing
- —
- Monthly P&I
- —
- Monthly cashflow
- —
- DSCR
- —
- Eligible?
- —
No personal income docs; deal must DSCR.
Hard money
10% down · 12.0% · 12mo
- Down + closing
- —
- Monthly P&I
- —
- Monthly cashflow
- —
- DSCR
- —
- Eligible?
- —
Short-term bridge; refi at stabilization.
Rent comps 40 comps
| Address | Beds | Baths | Sqft | Rent | $/sqft | DOM | Units | Dist |
|---|---|---|---|---|---|---|---|---|
| 1309 Greenwood Ave Killeen, TX | 3.0 | 1.0 | 925 | $900 | $0.97 | 21d | 1 | 0.20mi |
| 1104 E Avenue E Killeen, TX | 2.0 | 1.0 | 736 | $800 | $1.09 | 43d | 1 | 0.24mi |
| 1201 Greenwood Ave Killeen, TX | 4.0 | 2.0 | 1276 | $1,350 | $1.06 | 43d | 1 | 0.28mi |
| 508 Patton Dr Killeen, TX | 3.0 | 1.5 | 924 | $1,150 | $1.24 | 23d | 1 | 0.32mi |
| 801 S W S Young Dr Killeen, TX | 3.0 | 1.0–2.0 | 1027 | $2,043 | $1.99 | 13d | 12 | 0.45mi |
| 705 Crockett Dr Killeen, TX | 3.0 | 1.0 | 1174 | $1,095 | $0.93 | 43d | 1 | 0.46mi |
| 501 N 18th St Unit B Killeen, TX | 3.0 | 1.5 | 1286 | $1,250 | $0.97 | 23d | 1 | 0.47mi |
| 715 Cardinal Ave Killeen, TX | 3.0 | 1.0 | 1142 | $800 | $0.70 | 43d | 1 | 0.48mi |
| 905 Parmer Ave Unit B Killeen, TX | 3.0 | 1.0 | 836 | $850 | $1.02 | 13d | 1 | 0.49mi |
| 608 N 18th St Unit B Killeen, TX | 3.0 | 1.0 | 838 | $915 | $1.09 | 13d | 1 | 0.50mi |
| 724 Carrie Ave Killeen, TX | 3.0 | 1.0 | 1100 | $1,000 | $0.91 | 43d | 1 | 0.51mi |
| 414 East Avenue A Unit 106 Killeen, TX | 2.0 | 1.0 | 800 | $705 | $0.88 | 13d | 1 | 0.63mi |
| 907 Wells St Killeen, TX | 3.0 | 1.0 | 1050 | $950 | $0.90 | 23d | 1 | 0.66mi |
| 913 Estelle Ave Killeen, TX | 4.0 | 2.0 | 1292 | $1,445 | $1.12 | 13d | 1 | 0.67mi |
| 1108 Stewart St Killeen, TX | 3.0 | 1.0 | 995 | $1,150 | $1.16 | 23d | 1 | 0.68mi |
| 1107 Middleton St Killeen, TX | 2.0 | 1.0 | 792 | $950 | $1.20 | 21d | 1 | 0.69mi |
| 1107 Middleton St Unit 1 Killeen, TX | 2.0 | 1.0 | 792 | $950 | $1.20 | 23d | 1 | 0.69mi |
| 1704 Smith Dr Killeen, TX | 2.0 | 1.0 | 925 | $1,000 | $1.08 | 43d | 1 | 0.72mi |
| 2307 Terrace Dr Unit C Killeen, TX | 3.0 | 2.0 | 1203 | $850 | $0.71 | 13d | 1 | 0.72mi |
| 1208 Alexander St Killeen, TX | 4.0 | 3.0 | 1500 | $1,600 | $1.07 | 43d | 1 | 0.73mi |
| 1703 Smith Dr Killeen, TX | 2.0 | 1.0 | 1176 | $900 | $0.77 | 23d | 1 | 0.75mi |
| 1015 N 14th St Unit 2 Killeen, TX | 2.0 | 1.0 | 850 | $845 | $0.99 | 13d | 1 | 0.76mi |
| 1015 N 14th St Unit 4 Killeen, TX | 2.0 | 1.0 | 850 | $845 | $0.99 | 23d | 1 | 0.76mi |
| 1015 N 14th St Unit 2 Killeen, TX | 2.0 | 1.0 | 850 | $845 | $0.99 | 43d | 1 | 0.76mi |
| 1015 N 14th St Apt 1 Killeen, TX | 2.0 | 1.0 | 850 | $850 | $1.00 | 43d | 1 | 0.76mi |
| 1204 N 18th St Unit B Killeen, TX | 3.0 | 2.0 | 1200 | $1,200 | $1.00 | 43d | 1 | 0.77mi |
| 2318 Terrace Dr Killeen, TX | 3.0 | 2.0 | 1370 | $1,299 | $0.95 | 44d | 1 | 0.78mi |
| 1312 Carol Way Killeen, TX | 3.0 | 1.0 | 1221 | $1,100 | $0.90 | 13d | 1 | 0.79mi |
| 2701 Hillside Dr Killeen, TX | 3.0 | 1.0 | 924 | $995 | $1.08 | 21d | 1 | 0.80mi |
| 1701 Elkins Ave Killeen, TX | 3.0 | 1.0 | 918 | $1,000 | $1.09 | 13d | 1 | 0.80mi |
| 2825 Cedar Cir Killeen, TX | 2.0 | 1.0 | 840 | $1,000 | $1.19 | 13d | 1 | 0.82mi |
| 2825 Cedar Cir Killeen, TX | 2.0 | 1.0 | 840 | $1,100 | $1.31 | 43d | 1 | 0.82mi |
| 910 Stetson Ave Unit (SR PnB) 910-912 Stetson Killeen, TX | 3.0 | 1.0 | 1082 | $900 | $0.83 | 23d | 1 | 0.83mi |
| 201 E Bryce Dr Killeen, TX | 1.0–2.0 | 1.0 | 620 | $1,010 | $1.63 | 43d | 9 | 0.85mi |
| 914 Stetson Ave Killeen, TX | 2.0 | 1.0 | 828 | $850 | $1.03 | 43d | 1 | 0.86mi |
| 1015 N 10th St Unit B Killeen, TX | 3.0 | 2.0 | 1118 | $1,100 | $0.98 | 43d | 1 | 0.86mi |
| 1104 Duncan Ave Killeen, TX | 2.0 | 1.0 | 786 | $852 | $1.08 | 21d | 1 | 0.86mi |
| 1414 Alta Mira Dr Killeen, TX | 3.0 | 1.0 | 1294 | $1,099 | $0.85 | 23d | 1 | 0.86mi |
| 1302 Redondo Dr Killeen, TX | 3.0 | 1.0 | 1327 | $1,200 | $0.90 | 43d | 1 | 0.87mi |
| 1903 Duncan Ave Killeen, TX | 2.0 | 1.0 | 787 | $650 | $0.83 | 43d | 1 | 0.88mi |
Listing history 10 events
-
2026-04-24status Active 258-char remark
Show marketing remark (258 chars)
This charming 3-bedroom, 1-bath Single Family Home offers a fantastic opportunity for investors or buyers looking to add their personal touch. Featuring wood flooring throughout. Conveniently located with easy access to shopping, dining, and local amenities.
-
2026-04-10status Pending 258-char remark
Show marketing remark (258 chars)
This charming 3-bedroom, 1-bath Single Family Home offers a fantastic opportunity for investors or buyers looking to add their personal touch. Featuring wood flooring throughout. Conveniently located with easy access to shopping, dining, and local amenities.
-
2026-03-27$99,900 Active 258-char remark
Show marketing remark (258 chars)
This charming 3-bedroom, 1-bath Single Family Home offers a fantastic opportunity for investors or buyers looking to add their personal touch. Featuring wood flooring throughout. Conveniently located with easy access to shopping, dining, and local amenities.
-
2025-01-04price $850
-
2024-04-11$900
-
2024-04-10historical $900
-
2024-04-04$900
-
2022-03-04price $900
-
2003-10-30soldstatus
-
1990-03-19soldstatus
ⓘ Source: listings_history table (triggers on properties + properties_extension) + one-shot
backfill from property_details.listing_events for pre-trigger history.
Tax reassessment forecast TX · Resets to sale price
- Current annual tax
- $2,397 · $200/mo
- Projected year-2 tax
- $2,397 · $200/mo
- Expected delta
- $0/yr ($0/mo · 0.0%)
ⓘ Screening estimate from a state-policy table — verify with the county assessor before closing.
Climate risk First Street
- Flood 1/10 Low FEMA zone X (shaded) · 0% chance over 30 yrs
- Wildfire 2/10 Low
- Heat 7/10 Severe 7 d/yr ≥107°F today · 23 d/yr by 30 yrs out
- Wind 6/10 Major 62% chance of damaging wind over 30 yrs
- Air quality 1/10 Low 0 unhealthy d/yr today · 0 by 30 yrs out
Nearby sold comps map
Loading sold comps map…
Walkable amenities ~0.75 mi
Loading nearby amenities…
Taxation est. · year 1
- Rental income
- $13,014
- − Mortgage interest
- −$5,596
- − Property taxes
- −$2,397
- − Insurance
- −$500
- − Repairs & maintenance
- −$1,041
- − Management
- −$1,041
- − Depreciation
- −$2,906
- Taxable loss
- −$467
- Est. tax savings @ 24.0%
- +$112
- After-tax cash flow
- $1,210/yr
For passive investors: Depreciation is non-cash, so a rental often shows a tax loss while cash-flowing — sheltering income. Rental losses are passive: they offset passive income freely, and up to $25,000/yr can offset ordinary (W-2) income if you actively participate and your MAGI is under $100k (phasing out to $0 by $150k); unused losses carry forward. On sale, claimed depreciation is recaptured at up to 25%, and gains may owe capital-gains tax (a 1031 exchange can defer both). Figures are a year-1 estimate at your 24.0% rate — not tax advice; consult a CPA.
Schools (NCES district)
- District
- Killeen ISD
- NCES district ID
- 4825660
- Math proficiency
- 31% ▼ -16.00%
- Reading proficiency
- 38% ▼ -3.00%
- Median HH income
- $47,665
- Composite
- 29.69/100
- National rank
- #6458
- State rank
- #524 of 826 in TX
Livability — Killeen
- Score
- 63/100
- State rank
- #853
- US rank
- #15359
Category grades
Schools grade is shown separately in the Schools card above.
Census & demographics
- Census place
- Killeen, TX
- County
- Bell County · 345,090 people
- City population
- 163,398
- Metro
- Killeen-Temple, TX
- Population (ZIP)
- 19,011
- Household income
- $37,349
- Rent vs Own
- Severe rent burden
- 1668.0
Population outlook (Bell County) Hauer SSP2
- Today (2025)
- 371,114 people
- By 2030
- 389,104 · +4.8%
- By 2040
- 420,592 · +13.3%
- By 2050
- 447,779 · +20.7%
- By 2075
- 499,130 · +34.5%
- By 2100
- 505,680 · +36.3%
Race, ethnicity, and origin ACS 2023
- Neighborhood character
- Highly diverse neighborhood (Simpson 0.73)
- Race & ethnicity
- Hispanic / Latino 32% White 31% Black 27% Two or more races 10% Asian 3% Pacific Islander 1%
- Hispanic origin (detail)
- Mexican 21% Puerto Rican 6% Dominican 1%
- Common ancestry
- Italian 2% Slovak 1% Lithuanian 1%
- Foreign-born
- 14% · Canada, Vietnam, South Korea
- Languages at home
- 69% English-only · Spanish 25% German/W. Germanic 2% Korean 1%
Political lean MEDSL · Bell
- 2024 margin
- R (+16.2) · D 41.3% · R 57.6% · Other 1.1%
- 2008→2024 swing
- -6.5pp toward R · 2008: -9.8pp · 2024: -16.2pp
- All cycles
- 2024: R+16.2 2020: R+8.5 2016: R+15.1 2012: R+16.4 2008: R+9.8
Not yet ingested
- Civics
- —
Market trends
- HPI YoY
- ▲ 2.26%
- Current HPI
- 168.1206
- Rent YoY
- ▼ -2.00%
- Metro
- Killeen-Temple, TX
- State GDP YoY
- ▲ 3.95%
- F500 in state
- 110
Industry mix (Fortune 500 HQ in TX)
| Industry | F500 HQs | Revenue |
|---|---|---|
| Energy | 16 | $1,198B |
|
||
| Technology | 5 | $198B |
|
||
| Engineering / Construction | 4 | $72B |
|
||
| Energy Services | 3 | $60B |
|
||
| Utilities | 3 | $41B |
|
||
| Healthcare | 2 | $330B |
|
||
Price history
10 events — show timeline
- 2026-04-24 Relisted — CTXMLS
- 2026-04-10 Pending — CTXMLS
- 2026-03-27 Listed $99,900 CTXMLS
- 2025-01-04 Price Changed $850 APPFOLIO
- 2024-04-11 Listed for Rent $900 APPFOLIO
- 2024-04-10 Rental Removed $900 APPFOLIO
- 2024-04-04 Listed for Rent $900 APPFOLIO
- 2022-03-04 Price Changed $900 APPFOLIO
- 2003-10-30 Sold (Public Records) — Public Records
- 1990-03-19 Sold (Public Records) — Public Records
Property tax history
+13.1%/yrLatest (2025): $2,397 · +20.6% YoY. Source: county tax records.
Cash-flow waterfall
monthlySold comps — $/sqft
last 12 mo · ≤1 miLoading sold comps…