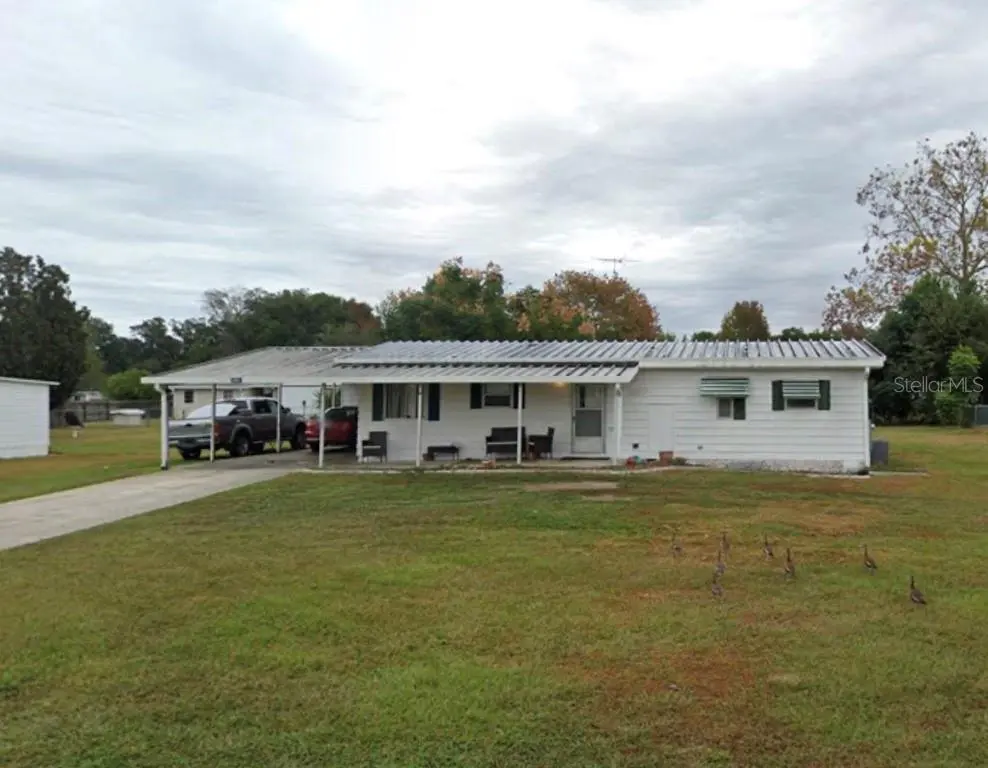
15211 SE 104th Ct · The Villages, FL
Flood risk 1/10 · Minimal
- FEMA flood zone
- X (unshaded)
- Chance of flooding over 30 yrs
- 0.0%
- Est. flood insurance / yr
- $507 – $1,088
Fire risk 4/10 · Minor
- Est. fire insurance / yr
- $947 – $1,759
Heat risk 8/10 · Major
- Hot days now (above 109°F)
- 7 days/yr
- Hot days in 30 yrs
- 21 days/yr
Wind risk 9/10 · Severe
- Chance of severe wind over 30 yrs
- 99.0%
Air-quality risk 3/10 · Minor
- Unhealthy air days now
- 2 days/yr
- Unhealthy air days in 30 yrs
- 2 days/yr
Risk factors via First Street. Map © Google.
Why this score? — see what drove the C+ grade
The composite is a weighted blend of 9 inputs, each scored 0–100. Each bar is that input's sub-score; the figure is the points it added to the 100-point composite (weight × sub-score).
- Cash flow +30.0/30.0
- DSCR +10.0/10.0
- 1% rule +8.5/10.0
- Schools +3.6/10.0
- Livability +3.5/5.0
- ARV discount +2.9/15.0
- Rent growth +2.5/5.0
- Condition / age +2.5/5.0
- Appreciation +0.0/10.0
$135,000
🖨 Deal sheet 📄 Offer letter ✓ Due diligence
Listing remarks
Charming Mobile Home on a Spacious Lot This great mobile home is ready for you to make it your own! Situated on a large lot, it features an oversized carport and a spacious family room, perfect for relaxing or entertaining. Enjoy the convenience of an enclosed Florida room and an indoor laundry area. This home offers 2 bedrooms and 2 bathrooms, providing comfortable living space and new AC Located just 2 minutes from Lake Weir and only 6 miles from Spanish Springs, you’ll be close to entertainment, restaurants, shopping, and hospitals—all just minutes away. Please verify all measurments.
Key facts
- 0.31 acre lot
- Parking
- Built 1978
Property features AI
Finance
- Other: Lot roughly 0.31 acres (about 1/4 to less than 1/2 acre); Living area approximately 2,186 (public records)
- Financial info: Homestead eligible; No lease restrictions
- HOA & community: No association fees
Exterior
- Parking: Carport (1 space)
- Utilities: Public water; Public sewer; Cable connected; Electricity connected; Water connected; Sewer connected
- Home design: Manufactured double-wide home; One level; Faces south
- Construction: Metal siding; Metal roof; Block foundation; Built as a manufactured home
- Exterior features: Awning(s); Balcony; Asphalt and concrete road access
Interior
- Kitchen: Refrigerator
- Bedrooms: 2 bedrooms
- Flooring: Carpet; Ceramic tile
- Bathrooms: 2 full bathrooms
- Heating & cooling: Central heating; Central air conditioning
- Interior features: Refrigerator included; Awning(s); Balcony
- Laundry & utility: Laundry inside
Neighborhood map
What this means for you Summary
Snapshot
- This is a 2-bed/2.0-bath manufactured listed at $135k.
Deal economics
- At list price, monthly cash flow is $616 ($7k/yr) — positive.
- The deal already cash-flows at list — no discount required.
- Meets the 1% rule at list price ($2k rent vs $135k).
- Recommended offer: $133k (1.5% below list) — sets the bar for market timing.
- Cap rate 11.8% vs local median 5.0% in The Villages — top-decile yield for the area; either an underpriced asset or a hidden risk that comps aren't pricing in. Stress-test before assuming the spread holds.
Location & tenants
- Location reads 70/100 on livability (#431 in FL) — a middle-class / working-renter tenant base. Strengths: schools A+, crime A+, housing A; Watch: amenities F, commute F, health & safety F.
- Marion (rural): math 42% / reading 43% proficiency, ranked #61 of 73 in FL (top 84%) — families likely to look elsewhere, expect single-tenant / working-renter base with shorter leases; 61% free/reduced lunch — lower-income household profile, screen leases tightly.
- Market conditions: 705 active listings in the ZIP; 5 comparable units currently listed for rent nearby; rentals at typical pace (median 22d on market — plan ~3-4 weeks tenant-placement turnaround); 7,071 units permitted in Marion County in 2024 (534 in 5+ unit buildings).
- This rent runs 33% of the median local income ($67k/yr) — at the standard rent-burdened threshold; future hikes will face affordability resistance.
Forward outlook
- Local home prices are declining (-3.0%/yr); year-one equity from $933 of loan paydown is wiped out by about $4k of value loss. Plan a longer hold.
- Marion County population projected at +13% by 2050 — modest demand growth; plan on rents tracking national, not racing it.
- At projected returns (-3.0% appreciation + 3.0% rent growth), your $38k cash investment doubles in ~7 years — after that, you're playing with house money.
Negotiation context
- It's been on market 20 days — a 2% lower offer ($133k) is reasonable based on typical stale-listing flexibility.
- 2 sale attempts with the ask held roughly flat each time — persistent listings suggest the price (not the market) is what's stuck; bring a comps-based counter.
- Current owner paid $44k; list at $135k implies a 210% gain — meaningful room to come down on a strong offer.
Risks & watch-outs
- Climate carrying-cost: severe wind risk, 99% chance of damaging wind over 30y; extreme-heat days projected 7→21/yr by 2055 (HVAC capex compounding) — expect insurance premiums to compound above CPI over the hold.
Questions for the listing agent
- Built in 1978 — when were the roof, HVAC, electrical panel, plumbing, and water heater last replaced?
- Is there a deadline driving the sale (1031 exchange, divorce, estate, relocation)? That informs how much negotiation room exists.
- Schools are A-rated — typically a magnet for longer-tenancy family renters. What's the average tenant stay here, and is there a school-zone premium baked into asking?
- What's the average days-on-market for RENTAL listings here right now (not sales)? A rising rental-DOM trend means longer vacancies and softer asking-rent achievability than the comps imply.
- What's the recent tenant-quality profile in this submarket — average credit score on applications, eviction rate, late-payment / NSF rate, and stable-employment percentage? A property-management company in the area should have these aggregated.
- How much new for-sale + rental construction is in the pipeline within 1–3 miles? Heavy new supply typically softens prices + rents 12–24 months out; constrained supply supports both.
Investment metrics
- 1% rule
- 1.35% ✓
- Cap rate
- 11.76%
- Cash-on-cash
- 19.54%
- DSCR
- 1.87
- GRM
- 6.2
CMA / ARV
- ARV (on-the-fly)
- $122,496
- Comps found
- 4
Show comp detail 4 sales within ~0.75 mi
| Address | Dist | Beds/Ba | Sqft | Sold | Price | $/sf | Match |
|---|---|---|---|---|---|---|---|
| 15050 SE 105th Ave | 0.15mi | 2/2.0 | 1,068 (+1%) | 4mo | $135,000 | $126 | 88 |
| 10340 SE 148th Pl | 0.36mi | 2/1.0 | 1,012 (-4%) | 7mo | $95,000 | $94 | 66 |
| 10175 SE Sunset Harbor Rd | 0.19mi | 2/2.0 | 920 (-13%) | 12mo | $100,000 | $109 | 60 |
| 10885 SE Timucuan Rd | 0.44mi | 2/1.0 | 936 (-11%) | 8mo | $109,000 | $116 | 50 |
Match score weights: distance 35% · size 25% · config 20% · recency 20%. Top-matched comps best support the ARV.
Projected returns pro-forma
-3.0% appreciation · 3.0% rent growth · sell at horizon
- IRR
- 11.5%
- Equity multiple
- 1.46×
- Total profit
- $17,288
- Equity at exit
- $20,129
- IRR
- 20.5%
- Equity multiple
- 2.73×
- Total profit
- $65,368
- Equity at exit
- $11,672
Cash invested: $37,800 (down + closing). Projections, not guarantees.
Landlord ↔ Tenant lean methodology
- Overall (STATE)
- 87 Strongly Landlord-Friendly
- State Florida
- 87 Strongly Landlord-Friendly · R+3
- County
- — inherits STATE
- City
- — inherits STATE
ZIP-level market 34491
- Home prices YoY
- -35.0%
- Active inventory
- 705
- Price-to-rent
- 6.2×
Monthly cashflow live
- Estimated rent
- $1,818 high interval (Pro) →
- Mortgage (P&I)
- −$708
- Tax from tax record
- −$56 /mo · $673/yr
- Insurance
- −$56
- HOA
- −$0
- Vacancy / Maint / Mgmt
- −$382
- Net cashflow
- $616
Break-even live
UW: 25.0% down · 7.5% · 30yr · 1.5% tax · 5.0% vac · 8.0% maint · 8.0% mgmt
Financing live
Cash to close
- Down payment
- $33,750
- Closing costs
- $4,050
- Reserves months
- —
- Total cash needed
- —
Loan-product check · same deal, 3 products live
Conventional
25% down · 7.5% · 30yr
- Down + closing
- —
- Monthly P&I
- —
- Monthly cashflow
- —
- DSCR
- —
- Eligible?
- —
Personal DTI + credit; lowest rate.
DSCR
20% down · 8.5% · 30yr
- Down + closing
- —
- Monthly P&I
- —
- Monthly cashflow
- —
- DSCR
- —
- Eligible?
- —
No personal income docs; deal must DSCR.
Hard money
10% down · 12.0% · 12mo
- Down + closing
- —
- Monthly P&I
- —
- Monthly cashflow
- —
- DSCR
- —
- Eligible?
- —
Short-term bridge; refi at stabilization.
Rent comps 5 comps
| Address | Beds | Baths | Sqft | Rent | $/sqft | DOM | Units | Dist |
|---|---|---|---|---|---|---|---|---|
| 10326 SE 162nd Place Rd Summerfield, FL | 3.0 | 2.0 | 1419 | $2,300 | $1.62 | 14d | 1 | 1.05mi |
| 11001 SE Sunset Harbor Rd Unit A08 Summerfield, FL | 2.0 | 1.5 | 1200 | $2,000 | $1.67 | 21d | 1 | 1.07mi |
| 11001 SE Sunset Harbor Rd Summerfield, FL | 2.0 | 1.5–2.0 | 1244 | $1,770 | $1.42 | 21d | 2 | 1.13mi |
| 11001 SE Sunset Harbor Rd Unit H52 Summerfield, FL | 2.0 | 2.5 | 1224 | $1,440 | $1.18 | 21d | 1 | 1.13mi |
| 9990 SE 166th St Summerfield, FL | 3.0 | 2.0 | 962 | $1,395 | $1.45 | 14d | 1 | 1.49mi |
Listing history 16 events
-
2026-06-18days on market $135,000 Active 20 DOM
-
2026-06-17days on market $135,000 Active 19 DOM
-
2026-06-16days on market $135,000 Active 18 DOM
-
2026-06-15days on market $135,000 Active 17 DOM
-
2026-06-14days on market $135,000 Active 15 DOM
-
2026-06-13days on market $135,000 Active 14 DOM
-
2026-06-10days on market $135,000 Active 12 DOM
-
2026-06-09days on market $135,000 Active 11 DOM
-
2026-06-08days on market $135,000 Active 10 DOM
-
2026-06-07days on market $135,000 Active 9 DOM
-
2026-06-03days on market $135,000 Active 5 DOM
-
2026-06-02days on market $135,000 Active 4 DOM
-
2026-06-01days on market $135,000 Active 3 DOM
-
2026-05-31days on market $135,000 Active 2 DOM
-
2026-05-30remarks 595-char remark
-
2026-05-30$135,000 Active 1 DOM
ⓘ Source: listings_history table (triggers on properties + properties_extension) + one-shot
backfill from property_details.listing_events for pre-trigger history.
Tax reassessment forecast FL · Resets to sale price
- Current annual tax
- $673 · $56/mo
- Projected year-2 tax
- $1,120 · $93/mo
- Expected delta
- +$448/yr (+$37/mo · 66.6%)
ⓘ Screening estimate from a state-policy table — verify with the county assessor before closing.
Climate risk First Street
- Flood 1/10 Low FEMA zone X (unshaded) · 0% chance over 30 yrs
- Wildfire 4/10 Moderate
- Heat 8/10 Severe 7 d/yr ≥109°F today · 21 d/yr by 30 yrs out
- Wind 9/10 Extreme 99% chance of damaging wind over 30 yrs
- Air quality 3/10 Moderate 2 unhealthy d/yr today · 2 by 30 yrs out
Nearby sold comps map
Loading sold comps map…
Walkable amenities ~0.75 mi
Loading nearby amenities…
Taxation est. · year 1
- Rental income
- $21,810
- − Mortgage interest
- −$7,562
- − Property taxes
- −$673
- − Insurance
- −$675
- − Repairs & maintenance
- −$1,745
- − Management
- −$1,745
- − Depreciation
- −$3,927
- Taxable income
- $5,483
- Est. tax owed @ 24.0%
- −$1,316
- After-tax cash flow
- $6,071/yr
For passive investors: Depreciation is non-cash, so a rental often shows a tax loss while cash-flowing — sheltering income. Rental losses are passive: they offset passive income freely, and up to $25,000/yr can offset ordinary (W-2) income if you actively participate and your MAGI is under $100k (phasing out to $0 by $150k); unused losses carry forward. On sale, claimed depreciation is recaptured at up to 25%, and gains may owe capital-gains tax (a 1031 exchange can defer both). Figures are a year-1 estimate at your 24.0% rate — not tax advice; consult a CPA.
Schools (NCES district)
- District
- Marion
- NCES district ID
- 1201260
- Math proficiency
- 42% ▼ -7.00%
- Reading proficiency
- 43% ▼ -4.00%
- Median HH income
- $40,015
- Composite
- 35.61/100
- National rank
- #4890
- State rank
- #61 of 73 in FL
Livability — The Villages
- Score
- 70/100
- State rank
- #431
- US rank
- #7363
Category grades
Schools grade is shown separately in the Schools card above.
Census & demographics
- County
- Marion County · 315,796 people
- City population
- 83,973
- Metro
- Ocala, FL
- Population (ZIP)
- 33,318
- Household income
- $66,679
- Rent vs Own
- Severe rent burden
- 256.0
Population outlook (Marion County) Hauer SSP2
- Today (2025)
- 365,905 people
- By 2030
- 376,768 · +3.0%
- By 2040
- 396,555 · +8.4%
- By 2050
- 412,723 · +12.8%
- By 2075
- 446,090 · +21.9%
- By 2100
- 436,193 · +19.2%
Race, ethnicity, and origin ACS 2023
- Neighborhood character
- Predominantly White (77%)
- Race & ethnicity
- White 77% Hispanic / Latino 14% Two or more races 9% Black 4% Asian 2%
- Hispanic origin (detail)
- Mexican 3% Puerto Rican 6% Cuban 1%
- Common ancestry
- Lithuanian 3% Slovak 2% Romanian 2%
- Foreign-born
- 8% · Canada, Vietnam, Jamaica
- Languages at home
- 85% English-only · Spanish 11% Vietnamese 1% French/Haitian/Cajun 1%
Political lean MEDSL · Marion
- 2024 margin
- Solid R (+31.6) · D 33.8% · R 65.5%
- 2008→2024 swing
- -20.0pp toward R · 2008: -11.6pp · 2024: -31.6pp
- All cycles
- 2024: R+31.6 2020: R+25.9 2016: R+26.2 2012: R+16.2 2008: R+11.6
Not yet ingested
- Civics
- —
Market trends
- HPI YoY
- ▼ -107.67%
- Current HPI
- 200.0792
- Rent YoY
- —
- Metro
- Ocala, FL
- State GDP YoY
- ▲ 3.28%
- F500 in state
- 36
Industry mix (Fortune 500 HQ in FL)
| Industry | F500 HQs | Revenue |
|---|---|---|
| Industrial Technology | 2 | $29B |
|
||
| Insurance | 2 | $17B |
|
||
| Retail | 1 | $60B |
|
||
| Technology Distribution | 1 | $58B |
|
||
| Homebuilding | 1 | $35B |
|
||
| Technology Manufacturing | 1 | $35B |
|
||
Price history
+264.9% since first listed6 events — show timeline
- 2026-05-29 Relisted — Stellar MLS as Distributed by MLS Grid
- 2026-05-21 Price Changed $135,000 Stellar MLS as Distributed by MLS Grid
- 2026-05-21 Listed $135,000 Stellar MLS as Distributed by MLS Grid
- 2003-01-21 Sold (Public Records) $43,500 Public Records
- 2000-06-26 Sold (Public Records) $39,000 Public Records
- 1998-11-17 Sold (Public Records) $37,000 Public Records
Property tax history
+7.1%/yrLatest (2025): $673 · +50.2% YoY. Source: county tax records.
Cash-flow waterfall
monthlySold comps — $/sqft
last 12 mo · ≤1 miLoading sold comps…