 🔨 Auction
304 S 12th Ave · Piggott, AR
Flood risk 4/10 · Minor
- FEMA flood zone
- AE
- Chance of flooding over 30 yrs
- 0.2%
- Est. flood insurance / yr
- $1,737 – $8,500
Fire risk 3/10 · Minor
- Est. fire insurance / yr
- $1,499 – $2,785
Heat risk 5/10 · Moderate
- Hot days now (above 109°F)
- 7 days/yr
- Hot days in 30 yrs
- 20 days/yr
Wind risk 4/10 · Minor
- Chance of severe wind over 30 yrs
- 7.0%
Air-quality risk 2/10 · Minimal
- Unhealthy air days now
- 0 days/yr
- Unhealthy air days in 30 yrs
- 1 days/yr
Risk factors via First Street. Map © Google.
Why this score? — see what drove the C- grade
The composite is a weighted blend of 9 inputs, each scored 0–100. Each bar is that input's sub-score; the figure is the points it added to the 100-point composite (weight × sub-score).
- Cash flow +15.0/30.0
- Appreciation +10.0/10.0
- ARV discount +7.5/15.0
- 1% rule +5.0/10.0
- DSCR +5.0/10.0
- Livability +3.5/5.0
- Rent growth +2.5/5.0
- Schools +2.5/10.0
- Condition / age +2.5/5.0
$1
🖨 Deal sheet 📄 Offer letter ✓ Due diligence
Listing remarks
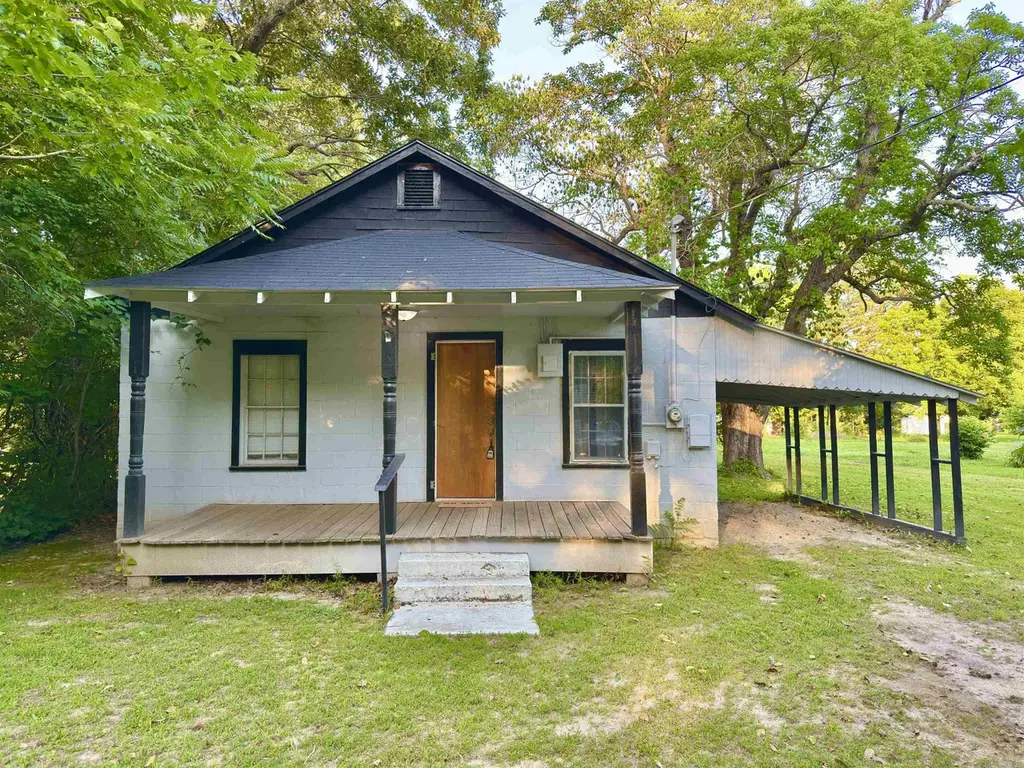
Investor opportunity selling at auction! This 2 bedroom, 1 bath home offers approximately 672 square feet of living space on a 0.63± acre lot and is conveniently located just minutes from downtown Piggott. The home features a clean, move-in ready appearance, utility room, front porch, carport, and additional parking area. Mature trees provide shade throughout the spacious yard, while two outbuildings offer additional storage and utility space. Whether you're seeking a rental property, investment opportunity, or affordable residence, this property offers a variety of possibilities. Conveniently located near local shopping, dining, schools, and community amenities. This property is bei
Key facts
- Spacious yard
- Utility room
- Front porch
Tags
Property features AI
Exterior
- Parking: Space for 4+ cars
- Utilities: Public sewer; Public water; Electric service (municipal, Entergy); Natural gas
- Home design: Block construction; Crawl space foundation; 3-tab shingle roof
- Construction: Block exterior
- Exterior features: Front porch; Level lot; Paved road access; Located inside city limits
Interior
- Kitchen: Free‑standing stove; Refrigerator remains
- Flooring: Carpet; Vinyl
- Bathrooms: 1 full bathroom
- Heating & cooling: Window air conditioning units; Floor/wall furnace
- Interior features: Ceiling fans; Kitchen with other type of countertops
- Laundry & utility: Laundry room
Neighborhood map
What this means for you Summary
Snapshot
- This is a 2-bed/1.0-bath single-family listed at $1.
Deal economics
- At list price, monthly cash flow is $190 ($2k/yr) — positive.
- The deal already cash-flows at list — no discount required.
- Meets the 1% rule at list price ($781 rent vs $1).
- Cap rate 740044.7% vs local median 4.4% in Piggott — top-decile yield for the area; either an underpriced asset or a hidden risk that comps aren't pricing in. Stress-test before assuming the spread holds.
Location & tenants
- Location reads 70/100 on livability (#50 in AR) — a middle-class / working-renter tenant base. Strengths: crime A+, cost of living A+, housing A+; Watch: schools F, amenities F, commute F.
- Piggott School District (town): math 32% / reading 28% proficiency, ranked #157 of 238 in AR (top 66%) — families likely to look elsewhere, expect single-tenant / working-renter base with shorter leases.
- Market conditions: 71 active listings in the ZIP; 4 units permitted in Clay County in 2024 (0 in 5+ unit buildings).
Forward outlook
- Clay County population projected at -24% by 2050 — secular population decline; favor cash flow + early exit over multi-decade hold.
- At projected returns (10.0% appreciation + 3.0% rent growth), your $0 cash investment doubles in ~1 year — after that, you're playing with house money.
Negotiation context
- It's been on market 15 days — a 2% lower offer ($0) is reasonable based on typical stale-listing flexibility.
Risks & watch-outs
- Watch-outs: flood insurance adds $427/mo.
- Climate carrying-cost: in FEMA flood zone AE (mandatory federal flood insurance); extreme-heat days projected 7→20/yr by 2055 (HVAC capex compounding) — expect insurance premiums to compound above CPI over the hold.
Questions for the listing agent
- What's the actual annual flood-insurance premium (NFIP or private), and is the property in a SFHA with mandatory coverage?
- Is there a deadline driving the sale (1031 exchange, divorce, estate, relocation)? That informs how much negotiation room exists.
- Schools are F-rated, which usually means shorter tenancies and higher turnover. Who's the typical renter profile here, and what's been the actual vacancy rate?
- What's the average days-on-market for RENTAL listings here right now (not sales)? A rising rental-DOM trend means longer vacancies and softer asking-rent achievability than the comps imply.
- What's the recent tenant-quality profile in this submarket — average credit score on applications, eviction rate, late-payment / NSF rate, and stable-employment percentage? A property-management company in the area should have these aggregated.
- How much new for-sale + rental construction is in the pipeline within 1–3 miles? Heavy new supply typically softens prices + rents 12–24 months out; constrained supply supports both.
Investment metrics
- 1% rule
- 78064.00% ✓
- Cap rate
- 740044.72%
- Cash-on-cash
- 2642994.38%
- DSCR
- 117599.38
- GRM
- 0.0
CMA / ARV
No comps found within radius.
Projected returns pro-forma
10.0% appreciation · 3.0% rent growth · sell at horizon
- IRR
- —
- Equity multiple
- 44235.54×
- Total profit
- $12,386
- Equity at exit
- $1
- IRR
- —
- Equity multiple
- 98194.60×
- Total profit
- $27,494
- Equity at exit
- $2
Cash invested: $0 (down + closing). Projections, not guarantees.
Landlord ↔ Tenant lean methodology
- Overall (STATE)
- 92 Strongly Landlord-Friendly
- State Arkansas
- 92 Strongly Landlord-Friendly · R+14
- County
- — inherits STATE
- City
- — inherits STATE
ZIP-level market 72454
- Home prices YoY
- 3.4%
- Active inventory
- 71
Monthly cashflow live
- Estimated rent
- $781 medium interval (Pro) →
- Mortgage (P&I)
- −$0
- Tax est. 1.5%
- −$0 /mo · $0/yr
- Insurance
- −$0
- Flood insurance flood zone
- −$427 /mo · $5,118/yr
- HOA
- −$0
- Vacancy / Maint / Mgmt
- −$164
- Net cashflow
- $190
Break-even live
UW: 25.0% down · 7.5% · 30yr · 1.5% tax · 5.0% vac · 8.0% maint · 8.0% mgmt
Financing live
Cash to close
- Down payment
- $0
- Closing costs
- $0
- Reserves months
- —
- Total cash needed
- —
Loan-product check · same deal, 3 products live
Conventional
25% down · 7.5% · 30yr
- Down + closing
- —
- Monthly P&I
- —
- Monthly cashflow
- —
- DSCR
- —
- Eligible?
- —
Personal DTI + credit; lowest rate.
DSCR
20% down · 8.5% · 30yr
- Down + closing
- —
- Monthly P&I
- —
- Monthly cashflow
- —
- DSCR
- —
- Eligible?
- —
No personal income docs; deal must DSCR.
Hard money
10% down · 12.0% · 12mo
- Down + closing
- —
- Monthly P&I
- —
- Monthly cashflow
- —
- DSCR
- —
- Eligible?
- —
Short-term bridge; refi at stabilization.
Listing history 12 events
-
2026-06-19days on market $1 Active 15 DOM
-
2026-06-18days on market $1 Active 14 DOM
-
2026-06-17days on market $1 Active 13 DOM
-
2026-06-16days on market $1 Active 12 DOM
-
2026-06-15days on market $1 Active 11 DOM
-
2026-06-14days on market $1 Active 9 DOM
-
2026-06-12statusdays on market $1 Active 8 DOM
-
2026-06-09days on market $1 New Listing 5 DOM
-
2026-06-08days on market $1 New Listing 4 DOM
-
2026-06-07days on market $1 New Listing 3 DOM
-
2026-06-05remarks 692-char remark
-
2026-06-05$1 New Listing 1 DOM
ⓘ Source: listings_history table (triggers on properties + properties_extension) + one-shot
backfill from property_details.listing_events for pre-trigger history.
Climate risk First Street
- Flood 4/10 Moderate FEMA zone AE · 20% chance over 30 yrs
- Wildfire 3/10 Moderate
- Heat 5/10 Major 7 d/yr ≥109°F today · 20 d/yr by 30 yrs out
- Wind 4/10 Moderate 7% chance of damaging wind over 30 yrs
- Air quality 2/10 Low 0 unhealthy d/yr today · 1 by 30 yrs out
Nearby sold comps map
Loading sold comps map…
Walkable amenities ~0.75 mi
Loading nearby amenities…
Taxation est. · year 1
- Rental income
- $9,368
- − Mortgage interest
- −$0
- − Property taxes
- −$0
- − Insurance
- −$5,119
- − Repairs & maintenance
- −$749
- − Management
- −$749
- − Depreciation
- −$0
- Taxable income
- $2,750
- Est. tax owed @ 24.0%
- −$660
- After-tax cash flow
- $1,622/yr
For passive investors: Depreciation is non-cash, so a rental often shows a tax loss while cash-flowing — sheltering income. Rental losses are passive: they offset passive income freely, and up to $25,000/yr can offset ordinary (W-2) income if you actively participate and your MAGI is under $100k (phasing out to $0 by $150k); unused losses carry forward. On sale, claimed depreciation is recaptured at up to 25%, and gains may owe capital-gains tax (a 1031 exchange can defer both). Figures are a year-1 estimate at your 24.0% rate — not tax advice; consult a CPA.
Schools (NCES district)
- District
- Piggott School District
- NCES district ID
- 0511370
- Math proficiency
- 32% ▼ -15.00%
- Reading proficiency
- 28% ▼ -10.00%
- Median HH income
- $33,336
- Composite
- 24.63/100
- National rank
- #7628
- State rank
- #157 of 238 in AR
Livability — Piggott
- Score
- 70/100
- State rank
- #50
- US rank
- #7358
Category grades
Schools grade is shown separately in the Schools card above.
Census & demographics
- Census place
- Piggott, AR
- Population (ZIP)
- 4,699
Population outlook (Clay County) Hauer SSP2
- Today (2025)
- 13,564 people
- By 2030
- 12,834 · -5.4%
- By 2040
- 11,498 · -15.2%
- By 2050
- 10,325 · -23.9%
- By 2075
- 8,228 · -39.3%
- By 2100
- 6,675 · -50.8%
Race, ethnicity, and origin ACS 2023
- Neighborhood character
- Predominantly White (94%)
- Race & ethnicity
- White 94% Two or more races 5% Hispanic / Latino 2%
- Common ancestry
- Slovak 1% Serbian 1% Italian 1%
- Foreign-born
- 1%
- Languages at home
- 99% English-only · German/W. Germanic 1%
Political lean MEDSL · Clay
- 2024 margin
- Solid R (+61.6) · D 18.3% · R 79.9% · Other 1.9%
- 2008→2024 swing
- -47.3pp toward R · 2008: -14.3pp · 2024: -61.6pp
- All cycles
- 2024: R+61.6 2020: R+60.3 2016: R+29.8 2012: R+29.1 2008: R+14.3
Not yet ingested
- Civics
- —
Market trends
- HPI YoY
- ▲ 11.57%
- Current HPI
- 355.7877
- Rent YoY
- —
- Metro
- —
- State GDP YoY
- ▲ 3.80%
- F500 in state
- 10
Industry mix (Fortune 500 HQ in AR)
| Industry | F500 HQs | Revenue |
|---|---|---|
| Retail | 1 | $681B |
|
||
| Food / Agriculture | 1 | $53B |
|
||
| Retail / Energy | 1 | $22B |
|
||
| Transportation / Logistics | 1 | $12B |
|
||
| Energy | 1 | $4B |
|
||
Price history
+400.0% since first listed5 events — show timeline
- 2026-06-04 Listed $1 CARMLS
- 2024-05-13 Sold (Public Records) $40,000 Public Records
- 2023-09-22 Sold (Public Records) $17,500 Public Records
- 2007-04-04 Sold (Public Records) $18,000 Public Records
- 1989-06-30 Sold (Public Records) $8,000 Public Records
Property tax history
+18.7%/yrLatest (2025): $324 · +0.0% YoY. Source: county tax records.
Cash-flow waterfall
monthlySold comps — $/sqft
last 12 mo · ≤1 miLoading sold comps…