 Triplex
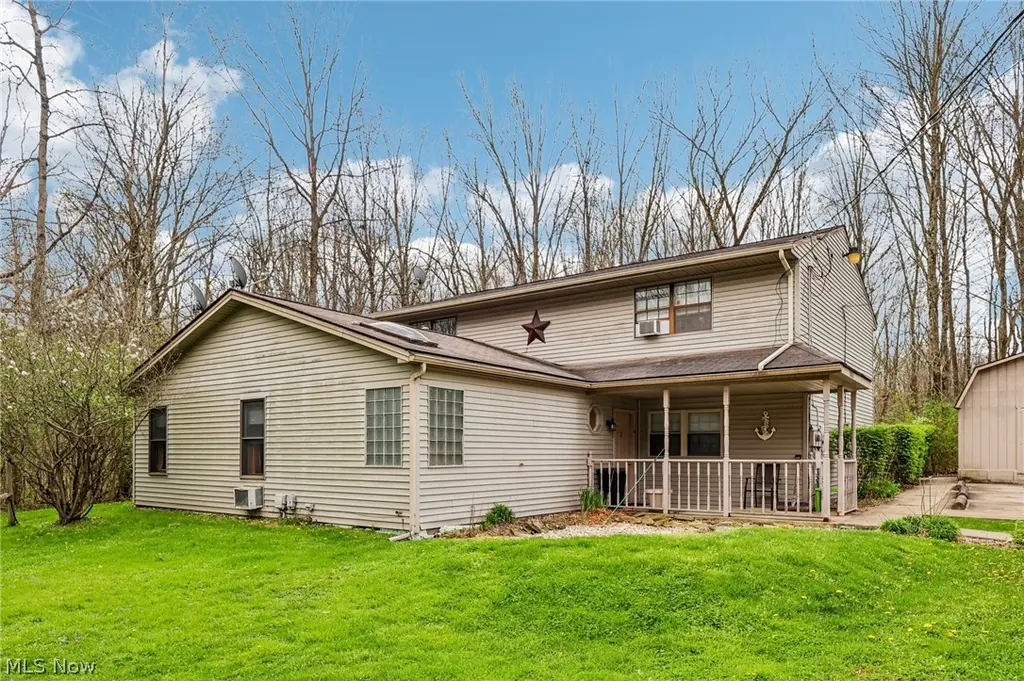
1886 James B Dr · Hilltop, OH
Flood risk 1/10 · Minimal
- FEMA flood zone
- X (unshaded)
- Chance of flooding over 30 yrs
- 0.0%
- Est. flood insurance / yr
- $507 – $1,088
Fire risk 1/10 · Minimal
- Est. fire insurance / yr
- $713 – $1,323
Heat risk 3/10 · Minor
- Hot days now (above 97°F)
- 7 days/yr
- Hot days in 30 yrs
- 17 days/yr
Wind risk 1/10 · Minimal
- Chance of severe wind over 30 yrs
- —
Air-quality risk 3/10 · Minor
- Unhealthy air days now
- 1 days/yr
- Unhealthy air days in 30 yrs
- 4 days/yr
Risk factors via First Street. Map © Google.
Why this score? — see what drove the C+ grade
The composite is a weighted blend of 9 inputs, each scored 0–100. Each bar is that input's sub-score; the figure is the points it added to the 100-point composite (weight × sub-score).
- Cash flow +30.0/30.0
- 1% rule +10.0/10.0
- DSCR +10.0/10.0
- Schools +5.5/10.0
- Livability +3.2/5.0
- Rent growth +2.5/5.0
- Condition / age +2.5/5.0
- ARV discount +0.0/15.0
- Appreciation +0.0/10.0
$179,999
🖨 Deal sheet 📄 Offer letter ✓ Due diligence
Multi-family units
County records classify this as Multi-Family (2-4 Unit). Listing-text estimate: 3 units. confirmed
Listing remarks MLS
This unique triplex at 1886 James B Dr in McDonald offers a fantastic investment opportunity or owner-occupant setup. The property features three separate units, including one studio apartment and two 2-bedroom units, providing flexibility for rental income and multiple living arrangements. Each unit offers functional layouts and comfortable living spaces, making this property ideal for long-term tenants or an investor looking to expand their portfolio. Conveniently located near local schools, shopping, dining, and major roadways, this property combines strong income potential with a desirable location. Whether you are looking for a fully income-producing property or the opportunity to live in one unit while renting the others, this triplex offers excellent value and potential.
Key facts
- Triplex
- Two 2-bedroom units
- Three separate units
Tags
Neighborhood map
What this means for you Summary
Snapshot
- This is a 3 × 5-bed/4.0-bath units multifamily listed at $180k.
Deal economics
- At list price, monthly cash flow is $1k ($14k/yr) — positive. Per door: $387/mo.
- The deal already cash-flows at list — no discount required.
- Meets the 1% rule at list price ($3k rent vs $180k).
- Recommended offer: $177k (1.5% below list) — sets the bar for market timing.
Location & tenants
- Location reads 63/100 on livability (#820 in OH) — a middle-class / working-renter tenant base. Strengths: cost of living A+, housing A+; Watch: crime C-, schools F, amenities F.
- Weathersfield Local (suburban): math 63% / reading 68% proficiency, ranked #209 of 656 in OH (top 32%) — acceptable for families but not a draw, mixed tenant base, ~2y average lease.
- Market conditions: 21 active listings in the ZIP; 129 units permitted in Trumbull County in 2024 (0 in 5+ unit buildings).
- At $3,072/mo this rent would consume 51% of the median local household income ($73k/yr) — very limited rent-growth headroom before tenants either downsize or default.
Forward outlook
- Local home prices are declining (-3.0%/yr); year-one equity from $1k of loan paydown is wiped out by about $5k of value loss. Plan a longer hold.
- Trumbull County population projected at -22% by 2050 — secular population decline; favor cash flow + early exit over multi-decade hold.
- At projected returns (-3.0% appreciation + 3.0% rent growth), your $50k cash investment doubles in ~5 years — after that, you're playing with house money.
Negotiation context
- It's been on market 21 days — a 2% lower offer ($177k) is reasonable based on typical stale-listing flexibility.
- 2 sale attempts since 16y ago with the ask held roughly flat each time — persistent listings suggest the price (not the market) is what's stuck; bring a comps-based counter.
Questions for the listing agent
- Can we see the unit-by-unit rent roll, current vacancy, and any below-market leases? What's the average tenancy length?
- What capital expenditures (roof, boiler, parking lot, exteriors) have been made in the last 5 years, and what's planned in the next 2?
- Built in 1979 — when were the roof, HVAC, electrical panel, plumbing, and water heater last replaced?
- Is there a deadline driving the sale (1031 exchange, divorce, estate, relocation)? That informs how much negotiation room exists.
- Schools are F-rated, which usually means shorter tenancies and higher turnover. Who's the typical renter profile here, and what's been the actual vacancy rate?
- What's the average days-on-market for RENTAL listings here right now (not sales)? A rising rental-DOM trend means longer vacancies and softer asking-rent achievability than the comps imply.
- What's the recent tenant-quality profile in this submarket — average credit score on applications, eviction rate, late-payment / NSF rate, and stable-employment percentage? A property-management company in the area should have these aggregated.
- How much new apartment / multifamily construction is in the pipeline within 1–3 miles? Heavy new supply (>2% of stock underway) typically softens rents 12–24 months out; light construction supports rent growth.
Investment metrics
- 1% rule
- 1.71% ✓
- Cap rate
- 14.03%
- Cash-on-cash
- 27.61%
- DSCR
- 2.23
- GRM
- 4.9
CMA / ARV
- ARV (median comp)
- $151,000
- List price
- $179,999
- Delta
- 19.20%
- Verdict
- OVERPRICED
- Comps
- 7 within 2.0 mi
Projected returns pro-forma
-3.0% appreciation · 3.0% rent growth · sell at horizon
- IRR
- 21.7%
- Equity multiple
- 1.89×
- Total profit
- $44,763
- Equity at exit
- $26,838
- IRR
- 29.8%
- Equity multiple
- 3.67×
- Total profit
- $134,344
- Equity at exit
- $15,563
Cash invested: $50,400 (down + closing). Projections, not guarantees.
Landlord ↔ Tenant lean methodology
- Overall (STATE)
- 73 Landlord-Friendly
- State Ohio
- 73 Landlord-Friendly · R+6
- County
- — inherits STATE
- City
- — inherits STATE
ZIP-level market 44437
- Home prices YoY
- -7.8%
- Active inventory
- 21
- Price-to-rent
- 14.7×
Monthly cashflow live
- Estimated rent
- $3,072 medium interval (Pro) →
- Mortgage (P&I)
- −$944
- Tax from tax record
- −$248 /mo · $2,977/yr
- Insurance
- −$75
- HOA
- −$0
- Vacancy / Maint / Mgmt
- −$645
- Net cashflow
- $1,160
Break-even live
3-unit breakdown (identical units grouped — click to expand)
| Units | Beds | Baths | Est. rent |
|---|---|---|---|
| 3× units | 5 | 4 | $3,072 |
| #1 | 5 | 4 | $1,024 |
| #2 | 5 | 4 | $1,024 |
| #3 | 5 | 4 | $1,024 |
| Total (3 units) | $3,072 | ||
UW: 25.0% down · 7.5% · 30yr · 1.5% tax · 5.0% vac · 8.0% maint · 8.0% mgmt
Financing live
Cash to close
- Down payment
- $45,000
- Closing costs
- $5,400
- Reserves months
- —
- Total cash needed
- —
Loan-product check · same deal, 3 products live
Conventional
25% down · 7.5% · 30yr
- Down + closing
- —
- Monthly P&I
- —
- Monthly cashflow
- —
- DSCR
- —
- Eligible?
- —
Personal DTI + credit; lowest rate.
DSCR
20% down · 8.5% · 30yr
- Down + closing
- —
- Monthly P&I
- —
- Monthly cashflow
- —
- DSCR
- —
- Eligible?
- —
No personal income docs; deal must DSCR.
Hard money
10% down · 12.0% · 12mo
- Down + closing
- —
- Monthly P&I
- —
- Monthly cashflow
- —
- DSCR
- —
- Eligible?
- —
Short-term bridge; refi at stabilization.
Listing history 4 events
-
2026-05-08status Pending 788-char remark
Show marketing remark (788 chars)
This unique triplex at 1886 James B Dr in McDonald offers a fantastic investment opportunity or owner-occupant setup. The property features three separate units, including one studio apartment and two 2-bedroom units, providing flexibility for rental income and multiple living arrangements. Each unit offers functional layouts and comfortable living spaces, making this property ideal for long-term tenants or an investor looking to expand their portfolio. Conveniently located near local schools, shopping, dining, and major roadways, this property combines strong income potential with a desirable location. Whether you are looking for a fully income-producing property or the opportunity to live in one unit while renting the others, this triplex offers excellent value and potential.
-
2026-04-16$179,999 Active 788-char remark
Show marketing remark (788 chars)
This unique triplex at 1886 James B Dr in McDonald offers a fantastic investment opportunity or owner-occupant setup. The property features three separate units, including one studio apartment and two 2-bedroom units, providing flexibility for rental income and multiple living arrangements. Each unit offers functional layouts and comfortable living spaces, making this property ideal for long-term tenants or an investor looking to expand their portfolio. Conveniently located near local schools, shopping, dining, and major roadways, this property combines strong income potential with a desirable location. Whether you are looking for a fully income-producing property or the opportunity to live in one unit while renting the others, this triplex offers excellent value and potential.
-
2011-01-27historical
-
2010-06-08$92,000
ⓘ Source: listings_history table (triggers on properties + properties_extension) + one-shot
backfill from property_details.listing_events for pre-trigger history.
Tax reassessment forecast OH · Partial reset (capped growth)
- Current annual tax
- $2,977 · $248/mo
- Projected year-2 tax
- $2,977 · $248/mo
- Expected delta
- $0/yr ($0/mo · 0.0%)
ⓘ Screening estimate from a state-policy table — verify with the county assessor before closing.
Climate risk First Street
- Flood 1/10 Low FEMA zone X (unshaded) · 0% chance over 30 yrs
- Wildfire 1/10 Low
- Heat 3/10 Moderate 7 d/yr ≥97°F today · 17 d/yr by 30 yrs out
- Wind 1/10 Low
- Air quality 3/10 Moderate 1 unhealthy d/yr today · 4 by 30 yrs out
Nearby sold comps map
Loading sold comps map…
Walkable amenities ~0.75 mi
Loading nearby amenities…
Taxation est. · year 1
- Rental income
- $36,864
- − Mortgage interest
- −$10,083
- − Property taxes
- −$2,977
- − Insurance
- −$900
- − Repairs & maintenance
- −$2,949
- − Management
- −$2,949
- − Depreciation
- −$5,236
- Taxable income
- $11,769
- Est. tax owed @ 24.0%
- −$2,825
- After-tax cash flow
- $11,093/yr
For passive investors: Depreciation is non-cash, so a rental often shows a tax loss while cash-flowing — sheltering income. Rental losses are passive: they offset passive income freely, and up to $25,000/yr can offset ordinary (W-2) income if you actively participate and your MAGI is under $100k (phasing out to $0 by $150k); unused losses carry forward. On sale, claimed depreciation is recaptured at up to 25%, and gains may owe capital-gains tax (a 1031 exchange can defer both). Figures are a year-1 estimate at your 24.0% rate — not tax advice; consult a CPA.
Schools (NCES district)
- District
- Weathersfield Local
- NCES district ID
- 3905025
- Math proficiency
- 63% ▼ -14.00%
- Reading proficiency
- 68% ▼ -7.00%
- Median HH income
- $48,310
- Composite
- 55.46/100
- National rank
- #1247
- State rank
- #209 of 656 in OH
Livability — Hilltop
- Score
- 63/100
- State rank
- #820
- US rank
- #15271
Category grades
Schools grade is shown separately in the Schools card above.
Census & demographics
- County
- Trumbull · 193,293 people
- Metro
- Youngstown-Warren, OH
- Population (ZIP)
- 3,900
- Household income
- $72,545
- Rent vs Own
Population outlook (Trumbull County) Hauer SSP2
- Today (2025)
- 191,696 people
- By 2030
- 184,015 · -4.0%
- By 2040
- 166,810 · -13.0%
- By 2050
- 149,857 · -21.8%
- By 2075
- 115,769 · -39.6%
- By 2100
- 83,617 · -56.4%
Race, ethnicity, and origin ACS 2023
- Neighborhood character
- Predominantly White (98%)
- Race & ethnicity
- White 98% Two or more races 2%
- Common ancestry
- Romanian 7% Scotch-Irish 2% Subsaharan African 2%
- Foreign-born
- 1%
- Languages at home
- 96% English-only · Other Indo-European 3% Spanish 1%
Political lean MEDSL · Trumbull
- 2024 margin
- R (+16.8) · D 41.2% · R 58.0%
- 2008→2024 swing
- -39.2pp toward R · 2008: 22.4pp · 2024: -16.8pp
- All cycles
- 2024: R+16.8 2020: R+10.6 2016: R+6.4 2012: D+22.2 2008: D+22.4
Not yet ingested
- Civics
- —
Market trends
- HPI YoY
- ▼ -20.52%
- Current HPI
- 241.8126
- Rent YoY
- —
- Metro
- —
- State GDP YoY
- ▲ 1.98%
- F500 in state
- 48
Industry mix (Fortune 500 HQ in OH)
| Industry | F500 HQs | Revenue |
|---|---|---|
| Insurance | 3 | $145B |
|
||
| Industrial Machinery | 3 | $49B |
|
||
| Financial Services | 3 | $24B |
|
||
| Consumer Goods | 2 | $93B |
|
||
| Aerospace / Defense | 2 | $47B |
|
||
| Utilities | 2 | $33B |
|
||
Price history
+95.7% since first listed4 events — show timeline
- 2026-05-08 Pending — MLSNOW
- 2026-04-16 Listed $179,999 MLSNOW
- 2011-01-27 Listing Removed — MLSNOW
- 2010-06-08 Listed $92,000 MLSNOW
Property tax history
+3.2%/yrLatest (2025): $2,977 · +1.3% YoY. Source: county tax records.
Cash-flow waterfall
monthlySold comps — $/sqft
last 12 mo · ≤1 miLoading sold comps…