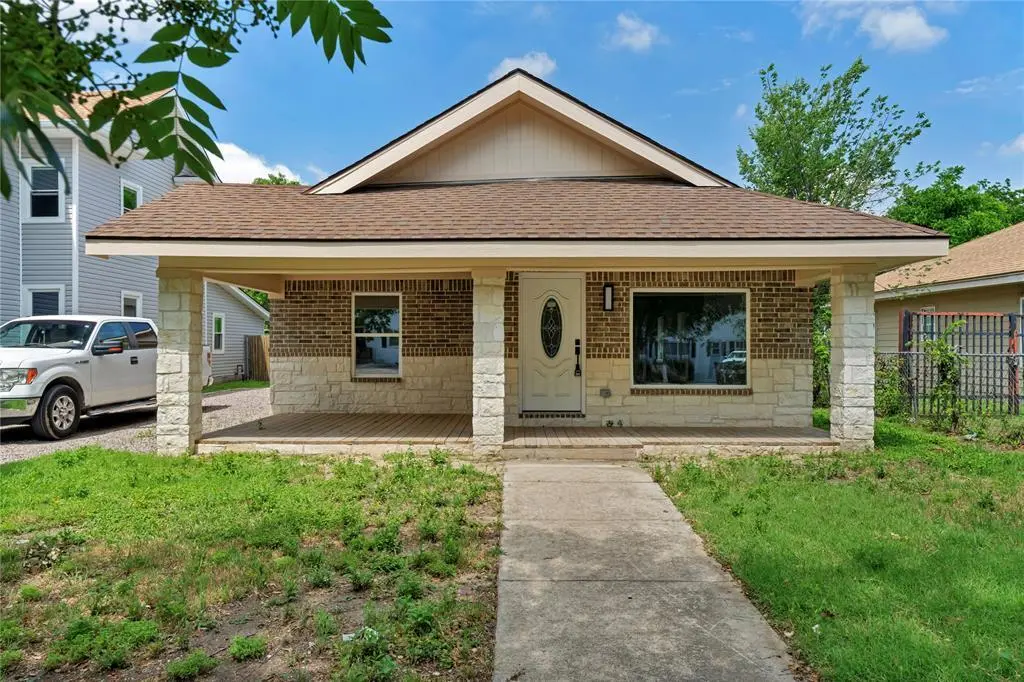
2916 Travis Ave · Fort Worth, TX
Flood risk 1/10 · Minimal
- FEMA flood zone
- X (unshaded)
- Chance of flooding over 30 yrs
- 0.0%
- Est. flood insurance / yr
- $507 – $1,088
Fire risk 1/10 · Minimal
- Est. fire insurance / yr
- $1,222 – $2,270
Heat risk 8/10 · Major
- Hot days now (above 109°F)
- 7 days/yr
- Hot days in 30 yrs
- 23 days/yr
Wind risk 4/10 · Minor
- Chance of severe wind over 30 yrs
- 21.0%
Air-quality risk 3/10 · Minor
- Unhealthy air days now
- 3 days/yr
- Unhealthy air days in 30 yrs
- 4 days/yr
Risk factors via First Street. Map © Google.
Why this score? — see what drove the D grade
The composite is a weighted blend of 9 inputs, each scored 0–100. Each bar is that input's sub-score; the figure is the points it added to the 100-point composite (weight × sub-score).
- Cash flow +15.9/30.0
- ARV discount +7.5/15.0
- DSCR +4.9/10.0
- Livability +4.0/5.0
- 1% rule +3.8/10.0
- Rent growth +2.7/5.0
- Condition / age +2.5/5.0
- Schools +2.0/10.0
- Appreciation +0.0/10.0
$289,000
🖨 Deal sheet (PDF) 📄 Offer letter ✓ Due diligence
Listing remarks
Updated 4-bedroom, 2.5-bath home in Fort Worth with over 2,100 sq ft, conveniently located near TCU, Magnolia Ave, and major highways. Recent improvements include a new HVAC system, updated electrical and plumbing, and a new water heater. The remodeled kitchen features new cabinets, countertops, and modern finishes. Additional updates include new flooring throughout and fresh interior and exterior paint. Spacious layout with large living areas, generous bedrooms, and plenty of natural light. Situated on a large lot with mature trees, this move-in ready home combines modern updates with a convenient location.
Key facts
- Updated electrical
- Remodeled kitchen
- New water heater
Tags
Property features AI
Finance
- Other: Listing accepts Cash, Conventional, FHA, and VA financing; Possession at closing/funding
- HOA & community: No association
Exterior
- Parking: Driveway parking; On-street parking; No garage or carport spaces
- Utilities: City water; City sewer; Not in a municipal utility district
- Home design: Single-family residence; Residential property; Two-story layout; Built in 1927
- Construction: Brick construction; Year built: 1927
- Exterior features: Wood fencing; Lot less than 0.5 acre (approx. 0.172 acres); Subdivision: South Hemphill Heights Add
Interior
- Kitchen: Granite counters; Pantry; Electric water heater
- Bedrooms: Primary bedroom on main level with ensuite bath, dual sinks and walk-in closet; Two bedrooms on second level (one with walk-in closet); Additional main-level bedroom
- Bathrooms: Two full bathrooms; One half bath
- Heating & cooling: Central heat; Electric heating; Central air conditioning; Ceiling fan(s)
- Interior features: Open floorplan; Pantry; Granite counters; High-speed internet available; One living area; One dining area; Total of 12 rooms; Two levels
- Laundry & utility: Utility room; Full-size washer/dryer area; Washer hookup; Separate utility room (10 x 5)
Neighborhood map
What this means for you Summary
Snapshot
- This is a 3-bed/2.0-bath single-family listed at $289k.
Deal economics
- At list price, monthly cash flow is $140 ($2k/yr) — positive.
- The deal already cash-flows at list — no discount required.
- To meet the 1% rule (rent ≥ 1% of price), the offer needs to be $253k (12.4% below list).
- Recommended offer: $253k (12.4% below list) — sets the bar for 1% rule.
- Cap rate 6.9% vs local median 3.9% in Fort Worth — top-decile yield for the area; either an underpriced asset or a hidden risk that comps aren't pricing in. Stress-test before assuming the spread holds.
Location & tenants
- Location reads 80/100 on livability (#49 in TX, #1,954 nationally) — a professional / high-income tenant draw. Strengths: amenities A+, cost of living A+, housing A+; Watch: crime F.
- Fort Worth ISD (urban): math 18% / reading 28% proficiency, ranked #742 of 826 in TX (top 90%) — low school quality limits family demand, transient renter base, plan for 1-2y turnover; 73% free/reduced lunch — lower-income household profile, screen leases tightly.
- Zoned schools: Daggett El (math 17% / reading 20%, grade F, #3,759 of 4,322 statewide, top 88%, 544 students, 84% FRL).
- Market conditions: Rents flat; 153 active listings in the ZIP; 40 comparable units currently listed for rent nearby; rentals at typical pace (median 22d on market — plan ~3-4 weeks tenant-placement turnaround); 18,938 units permitted in Tarrant County in 2024 (8,336 in 5+ unit buildings).
- This rent runs 44% of the median local income ($70k/yr) — at the standard rent-burdened threshold; future hikes will face affordability resistance.
Forward outlook
- Local home prices are declining (-3.0%/yr); year-one equity from $2k of loan paydown is wiped out by about $9k of value loss. Plan a longer hold.
- Tarrant County population projected at +41% by 2050 — long-run rental-demand tailwind backs the buy-and-hold thesis.
Negotiation context
- It's been on market 19 days — a 2% lower offer ($285k) is reasonable based on typical stale-listing flexibility.
- 3 sale attempts with the ask held roughly flat each time — persistent listings suggest the price (not the market) is what's stuck; bring a comps-based counter.
Risks & watch-outs
- Watch-outs: built in 1927 — expect roof / HVAC / electrical / plumbing capex.
- Climate carrying-cost: extreme-heat days projected 7→23/yr by 2055 (HVAC capex compounding) — expect insurance premiums to compound above CPI over the hold.
Questions for the listing agent
- Built in 1927 — when were the roof, HVAC, electrical panel, plumbing, and water heater last replaced?
- Is there a deadline driving the sale (1031 exchange, divorce, estate, relocation)? That informs how much negotiation room exists.
- Schools are D-rated, which usually means shorter tenancies and higher turnover. Who's the typical renter profile here, and what's been the actual vacancy rate?
- Crime grade is F in this area — have there been break-ins, vandalism, or insurance claims at this property in the last 3 years? What carrier currently insures it and at what premium?
- The area grade is low — what's the realistic commute time and amenity access for the typical tenant pool here? Any planned neighborhood developments (good or bad) we should know about?
- What's the average days-on-market for RENTAL listings here right now (not sales)? A rising rental-DOM trend means longer vacancies and softer asking-rent achievability than the comps imply.
- What's the recent tenant-quality profile in this submarket — average credit score on applications, eviction rate, late-payment / NSF rate, and stable-employment percentage? A property-management company in the area should have these aggregated.
- How much new for-sale + rental construction is in the pipeline within 1–3 miles? Heavy new supply typically softens prices + rents 12–24 months out; constrained supply supports both.
Investment metrics
- 1% rule
- 0.88% ✗
- Cap rate
- 6.87%
- Cash-on-cash
- 2.08%
- DSCR
- 1.09
- GRM
- 9.5
CMA / ARV
- ARV (on-the-fly)
- $579,852
- Comps found
- 12
Show comp detail 12 sales within ~0.75 mi
| Address | Dist | Beds/Ba | Sqft | Sold | Price | $/sf | Match |
|---|---|---|---|---|---|---|---|
| 2946 Lipscomb St | 0.10mi | 3/2.0 | 2,086 (-2%) | 3mo | $279,000 | $134 | 90 |
| 2620 Ryan Ave | 0.65mi | 3/2.0 | 2,116 (-0%) | 1mo | $570,000 | $269 | 68 |
| 2837 College Ave | 0.14mi | 3/2.5 | 1,911 (-10%) | 8mo | $529,000 | $277 | 68 |
| 2511 Lipscomb St | 0.43mi | 4/3.5 (+1) | 2,072 (-2%) | 3mo | $398,000 | $192 | 62 |
| 2925 5th Ave | 0.33mi | 4/3.0 (+1) | 1,992 (-6%) | 8mo | $575,000 | $289 | 59 |
| 3033 6th Ave | 0.44mi | 3/2.0 | 1,886 (-11%) | 3mo | $515,000 | $273 | 59 |
| 3020 Willing Ave | 0.53mi | 4/4.0 (+1) | 2,212 (+4%) | 1mo | $250,000 | $113 | 55 |
| 2912 6th Ave | 0.44mi | 3/3.0 | 2,400 (+13%) | 0mo | $725,000 | $302 | 53 |
| 2913 Willing Ave | 0.48mi | 4/3.0 (+1) | 1,887 (-11%) | 11mo | $599,000 | $317 | 41 |
| 2802 Addison Park Ln | 0.74mi | 3/3.5 | 1,937 (-9%) | 6mo | $399,900 | $206 | 40 |
| 3004 Ryan Ave | 0.58mi | 3/2.5 | 2,441 (+15%) | 12mo | $699,900 | $287 | 36 |
| 2900 8th Ave | 0.64mi | 4/3.5 (+1) | 2,388 (+12%) | 3mo | $499,900 | $209 | 36 |
Match score weights: distance 35% · size 25% · config 20% · recency 20%. Top-matched comps best support the ARV.
Projected returns pro-forma
-3.0% appreciation · 0.7% rent growth · sell at horizon
- IRR
- -15.5%
- Equity multiple
- 0.46×
- Total profit
- $-43,676
- Equity at exit
- $43,091
- IRR
- -11.2%
- Equity multiple
- 0.39×
- Total profit
- $-49,162
- Equity at exit
- $24,987
Cash invested: $80,920 (down + closing). Projections, not guarantees.
Landlord ↔ Tenant lean methodology
- Overall (STATE)
- 87 Strongly Landlord-Friendly
- State Texas
- 87 Strongly Landlord-Friendly · R+5
- County
- — inherits STATE
- City
- — inherits STATE
ZIP-level market 76110
- Rents YoY
- 0.7%
- Active inventory
- 153
- Price-to-rent
- 9.5×
Monthly cashflow live
- Estimated rent
- $2,531 high interval (Pro) →
- Mortgage (P&I)
- −$1,516
- Tax from tax record
- −$223 /mo · $2,677/yr
- Insurance
- −$120
- HOA
- −$0
- Vacancy / Maint / Mgmt
- −$531
- Net cashflow
- $140
Break-even live
Sensitivity live
| Price | -10% $304 | -5% $222 | +0% $140 | +5% $58 | +10% $-23 |
|---|---|---|---|---|---|
| Rent | -10% $-60 | -5% $40 | +0% $140 | +5% $240 | +10% $340 |
| Rate | -1.0pp $286 | -0.5pp $214 | base $140 | +0.5pp $65 | +1.0pp $-11 |
UW: 25.0% down · 7.5% · 30yr · 1.5% tax · 5.0% vac · 8.0% maint · 8.0% mgmt
Financing live
Cash to close
- Down payment
- $72,250
- Closing costs
- $8,670
- Reserves months
- —
- Total cash needed
- —
Loan-product check · same deal, 3 products live
Conventional
25% down · 7.5% · 30yr
- Down + closing
- —
- Monthly P&I
- —
- Monthly cashflow
- —
- DSCR
- —
- Eligible?
- —
Personal DTI + credit; lowest rate.
DSCR
20% down · 8.5% · 30yr
- Down + closing
- —
- Monthly P&I
- —
- Monthly cashflow
- —
- DSCR
- —
- Eligible?
- —
No personal income docs; deal must DSCR.
Hard money
10% down · 12.0% · 12mo
- Down + closing
- —
- Monthly P&I
- —
- Monthly cashflow
- —
- DSCR
- —
- Eligible?
- —
Short-term bridge; refi at stabilization.
Rent comps 40 comps
| Address | Beds | Baths | Sqft | Rent | $/sqft | DOM | Units | Dist |
|---|---|---|---|---|---|---|---|---|
| 2932 Travis Ave Unit 2932 Fort Worth, TX | 3.0 | 2.0 | 1600 | $1,700 | $1.06 | 22d | 1 | 0.05mi |
| 3000 S Jennings St Fort Worth, TX | 4.0 | 3.0 | 2270 | $2,050 | $0.90 | 6d | 1 | 0.17mi |
| 3225 S Adams St Fort Worth, TX | 4.0 | 2.0 | 1948 | $2,395 | $1.23 | 26d | 1 | 0.45mi |
| 1246 Lowe St Fort Worth, TX | 3.0 | 2.5 | 1752 | $1,895 | $1.08 | 16d | 1 | 0.52mi |
| 2341 Alston Ave Fort Worth, TX | 4.0 | 3.0 | 2343 | $4,245 | $1.81 | 45d | 1 | 0.54mi |
| 3329 Hemphill St Fort Worth, TX | 3.0 | 2.0 | 1425 | $2,950 | $2.07 | 45d | 1 | 0.55mi |
| 2911 Ryan Ave Fort Worth, TX | 3.0 | 2.0 | 1790 | $1,750 | $0.98 | 8d | 1 | 0.56mi |
| 2701 Stuart Dr Fort Worth, TX | 3.0 | 3.0 | 2104 | $1,800 | $0.86 | 45d | 1 | 0.59mi |
| 3201 Ryan Ave Fort Worth, TX | 4.0 | 2.0 | 2000 | $2,100 | $1.05 | 45d | 1 | 0.66mi |
| 2532 Ryan Ave Fort Worth, TX | 3.0 | 2.0 | 1416 | $2,100 | $1.48 | 45d | 1 | 0.69mi |
| 2828 Addison Park Ln Fort Worth, TX | 3.0 | 3.5 | 1936 | $2,495 | $1.29 | 22d | 1 | 0.74mi |
| 2807 Stanley Ave Fort Worth, TX | 3.0 | 2.5 | 1906 | $2,395 | $1.26 | 26d | 1 | 0.76mi |
| 1741 W Cantey St Fort Worth, TX | 3.0 | 3.5 | 1882 | $2,400 | $1.28 | 5d | 1 | 0.77mi |
| 2828 Livingston Ave Fort Worth, TX | 4.0 | 2.5 | 2208 | $3,500 | $1.59 | 0d | 1 | 0.84mi |
| 2200 6th Ave Fort Worth, TX | 3.0 | 3.0 | 1552 | $2,650 | $1.71 | 45d | 1 | 0.89mi |
| 2816 Gordon Ave Fort Worth, TX | 3.0 | 3.0 | 1570 | $3,000 | $1.91 | 8d | 1 | 0.90mi |
| 2101 Fairmount Ave Fort Worth, TX | 3.0 | 2.5 | 1516 | $3,200 | $2.11 | 4d | 1 | 0.98mi |
| 1920 Saint Louis Ave Fort Worth, TX | 4.0 | 3.0 | 1484 | $1,745 | $1.18 | 45d | 1 | 0.98mi |
| 642 E Harvey Ave Fort Worth, TX | 4.0 | 2.0 | 1755 | $2,099 | $1.20 | 45d | 1 | 1.00mi |
| 1909 May St Unit 1909 Fort Worth, TX | 4.0 | 2.5 | 2968 | $1,600 | $0.54 | 45d | 1 | 1.01mi |
| 2311 Warner Rd Fort Worth, TX | 3.0 | 2.0 | 2114 | $3,750 | $1.77 | 8d | 1 | 1.01mi |
| 2311 Warner Rd Fort Worth, TX | 3.0 | 2.0 | 2114 | $3,750 | $1.77 | 20d | 1 | 1.01mi |
| 2600 Townsend Dr Fort Worth, TX | 4.0 | 3.0 | 2300 | $4,000 | $1.74 | 20d | 1 | 1.02mi |
| 3134 Wayside Ave Fort Worth, TX | 3.0 | 2.5 | 1922 | $3,000 | $1.56 | 8d | 1 | 1.12mi |
| 3136 Wayside Ave Fort Worth, TX | 3.0 | 2.5 | 1875 | $3,000 | $1.60 | 8d | 1 | 1.12mi |
| 3201 Forest Park Blvd Fort Worth, TX | 4.0 | 4.0 | 1772 | $3,750 | $2.12 | 20d | 1 | 1.17mi |
| 3445 Frazier Ave Fort Worth, TX | 3.0 | 2.5 | 1540 | $2,200 | $1.43 | 45d | 1 | 1.18mi |
| 1724 5th Ave Fort Worth, TX | 3.0 | 2.5 | 2479 | $3,000 | $1.21 | 26d | 1 | 1.20mi |
| 1108 E Robert St Fort Worth, TX | 3.0 | 1.0 | 1444 | $1,775 | $1.23 | 0d | 1 | 1.20mi |
| 823 E Arlington Ave Fort Worth, TX | 4.0 | 2.5 | 1720 | $2,350 | $1.37 | 26d | 1 | 1.20mi |
| 2714 McCart Ave Fort Worth, TX | 4.0 | 4.0 | 2090 | $4,800 | $2.30 | 20d | 1 | 1.21mi |
| 2800 Sandage Ave Apt 203 Fort Worth, TX | 3.0 | 3.0 | 1931 | $3,300 | $1.71 | 8d | 1 | 1.26mi |
| 1921 Ben Hall Ct Fort Worth, TX | 3.0 | 1.0 | 1507 | $2,850 | $1.89 | 12d | 1 | 1.31mi |
| 2509 Benbrook Blvd Unit 902 Fort Worth, TX | 3.0 | 3.0 | 1756 | $2,595 | $1.48 | 45d | 1 | 1.32mi |
| 3240 Sandage Ave Fort Worth, TX | 4.0 | 4.0 | 2200 | $3,900 | $1.77 | 16d | 1 | 1.34mi |
| 2521 Benbrook Blvd Fort Worth, TX | 3.0 | 3.0 | 1849 | $4,000 | $2.16 | 6d | 1 | 1.34mi |
| 2800 Lubbock Ave Unit 102 Fort Worth, TX | 3.0 | 2.5 | 2405 | $4,200 | $1.75 | 24d | 1 | 1.37mi |
| 2821 Parmer Ave #125 Fort Worth, TX | 3.0 | 3.5 | 1898 | $2,350 | $1.24 | 45d | 1 | 1.38mi |
| 2813 Parmer Ave Unit 103 Fort Worth, TX | 3.0 | 2.5 | 2405 | $4,200 | $1.75 | 21d | 1 | 1.38mi |
| 2920 Pima Ln Fort Worth, TX | 3.0 | 2.5 | 1540 | $1,800 | $1.17 | 15d | 1 | 1.38mi |
Listing history 12 events
-
2026-06-21days on market $289,000 Active 19 DOM
-
2026-06-18days on market $289,000 Active 16 DOM
-
2026-06-17days on market $289,000 Active 15 DOM
-
2026-06-16days on market $289,000 Active 14 DOM
-
2026-06-15days on market $289,000 Active 13 DOM
-
2026-06-13days on market $289,000 Active 11 DOM
-
2026-06-09days on market $289,000 Active 7 DOM
-
2026-06-08days on market $289,000 Active 6 DOM
-
2026-06-07days on market $289,000 Active 5 DOM
-
2026-06-04days on market $289,000 Active 2 DOM
-
2026-06-03remarks 615-char remark
-
2026-06-03$289,000 Active 1 DOM
ⓘ Source: listings_history table (triggers on properties + properties_extension) + one-shot
backfill from property_details.listing_events for pre-trigger history.
Tax reassessment forecast TX · Resets to sale price
- Current annual tax
- $2,677 · $223/mo
- Projected year-2 tax
- $5,289 · $441/mo
- Expected delta
- +$2,611/yr (+$218/mo · 97.5%)
ⓘ Screening estimate from a state-policy table — verify with the county assessor before closing.
Climate risk First Street
- Flood 1/10 Low FEMA zone X (unshaded) · 0% chance over 30 yrs
- Wildfire 1/10 Low
- Heat 8/10 Severe 7 d/yr ≥109°F today · 23 d/yr by 30 yrs out
- Wind 4/10 Moderate 21% chance of damaging wind over 30 yrs
- Air quality 3/10 Moderate 3 unhealthy d/yr today · 4 by 30 yrs out
Nearby sold comps map
Loading sold comps map…
Walkable amenities ~0.75 mi
Loading nearby amenities…
Taxation est. · year 1
- Rental income
- $30,368
- − Mortgage interest
- −$16,188
- − Property taxes
- −$2,677
- − Insurance
- −$1,445
- − Repairs & maintenance
- −$2,429
- − Management
- −$2,429
- − Depreciation
- −$8,407
- Taxable loss
- −$3,209
- Est. tax savings @ 24.0%
- +$770
- After-tax cash flow
- $2,452/yr
For passive investors: Depreciation is non-cash, so a rental often shows a tax loss while cash-flowing — sheltering income. Rental losses are passive: they offset passive income freely, and up to $25,000/yr can offset ordinary (W-2) income if you actively participate and your MAGI is under $100k (phasing out to $0 by $150k); unused losses carry forward. On sale, claimed depreciation is recaptured at up to 25%, and gains may owe capital-gains tax (a 1031 exchange can defer both). Figures are a year-1 estimate at your 24.0% rate — not tax advice; consult a CPA.
Schools (NCES district)
- District
- Fort Worth ISD
- NCES district ID
- 4819700
- Math proficiency
- 18% ▼ -16.00%
- Reading proficiency
- 28% ▼ -6.00%
- Median HH income
- $42,109
- Composite
- 19.61/100
- National rank
- #8753
- State rank
- #742 of 826 in TX
Livability — Fort Worth
- Score
- 80/100
- State rank
- #49
- US rank
- #1954
Category grades
Schools grade is shown separately in the Schools card above.
Census & demographics
- Census place
- Fort Worth, TX
- County
- Tarrant County · 2,033,669 people
- City population
- 911,619
- Metro
- Dallas-Fort Worth-Arlington, TX
- Population (ZIP)
- 33,441
- Household income
- $69,790
- Rent vs Own
- Severe rent burden
- 1471.0
Population outlook (Tarrant County) Hauer SSP2
- Today (2025)
- 2,380,417 people
- By 2030
- 2,578,900 · +8.3%
- By 2040
- 2,974,995 · +25.0%
- By 2050
- 3,350,489 · +40.8%
- By 2075
- 4,216,909 · +77.2%
- By 2100
- 4,741,527 · +99.2%
Race, ethnicity, and origin ACS 2023
- Neighborhood character
- Majority Hispanic (63%)
- Race & ethnicity
- Hispanic / Latino 63% White 30% Two or more races 24% Black 2% Asian 2%
- Hispanic origin (detail)
- Mexican 57%
- Common ancestry
- Slovak 1% Italian 1% Lithuanian 1%
- Foreign-born
- 26% · Canada, China
- Languages at home
- 45% English-only · Spanish 52% Other Asian/Pacific 1% Other Indo-European 1%
Political lean MEDSL · Tarrant
- 2024 margin
- Lean R (+5.1) · D 46.7% · R 51.9% · Other 1.4%
- 2008→2024 swing
- +6.6pp toward D · 2008: -11.7pp · 2024: -5.1pp
- All cycles
- 2024: R+5.1 2020: D+0.2 2016: R+8.7 2012: R+15.7 2008: R+11.7
Not yet ingested
- Civics
- —
Market trends
- HPI YoY
- ▼ -194.46%
- Current HPI
- 274.8888
- Rent YoY
- ▲ 0.70%
- Metro
- Dallas-Fort Worth-Arlington, TX
- State GDP YoY
- ▲ 3.95%
- F500 in state
- 110
Industry mix (Fortune 500 HQ in TX)
| Industry | F500 HQs | Revenue |
|---|---|---|
| Energy | 16 | $1,198B |
|
||
| Technology | 5 | $198B |
|
||
| Engineering / Construction | 4 | $72B |
|
||
| Energy Services | 3 | $60B |
|
||
| Utilities | 3 | $41B |
|
||
| Healthcare | 2 | $330B |
|
||
Price history
-23.9% since first listed20 events — show timeline
- 2026-05-27 Listed $289,000 NTREIS
- 2026-04-19 Listing Removed — NTREIS
- 2026-03-30 Price Changed $309,900 NTREIS
- 2026-03-22 Price Changed $319,900 NTREIS
- 2026-03-05 Price Changed $330,000 NTREIS
- 2026-01-30 Listed $335,000 NTREIS
- 2025-09-30 Listing Removed — NTREIS
- 2025-08-26 Price Changed $354,900 NTREIS
- 2025-07-01 Price Changed $359,900 NTREIS
- 2025-06-04 Price Changed $369,900 NTREIS
- 2025-05-15 Price Changed $374,900 NTREIS
- 2025-04-17 Listed $380,000 NTREIS
- 2024-12-31 Sold (Public Records) — Public Records
- 2024-12-19 Sold (Public Records) — Public Records
- 2024-12-16 Sold (Public Records) — Public Records
- 2024-12-16 Sold (Public Records) — Public Records
- 2024-12-16 Sold (Public Records) — Public Records
- 2024-12-16 Sold (Public Records) — Public Records
- 2024-10-08 Sold (Public Records) — Public Records
- 2024-09-16 Sold (Public Records) — Public Records
Property tax history
+0.2%/yrLatest (2025): $2,677 · -2.4% YoY. Source: county tax records.
Cash-flow waterfall
monthlySold comps — $/sqft
last 12 mo · ≤1 miLoading sold comps…