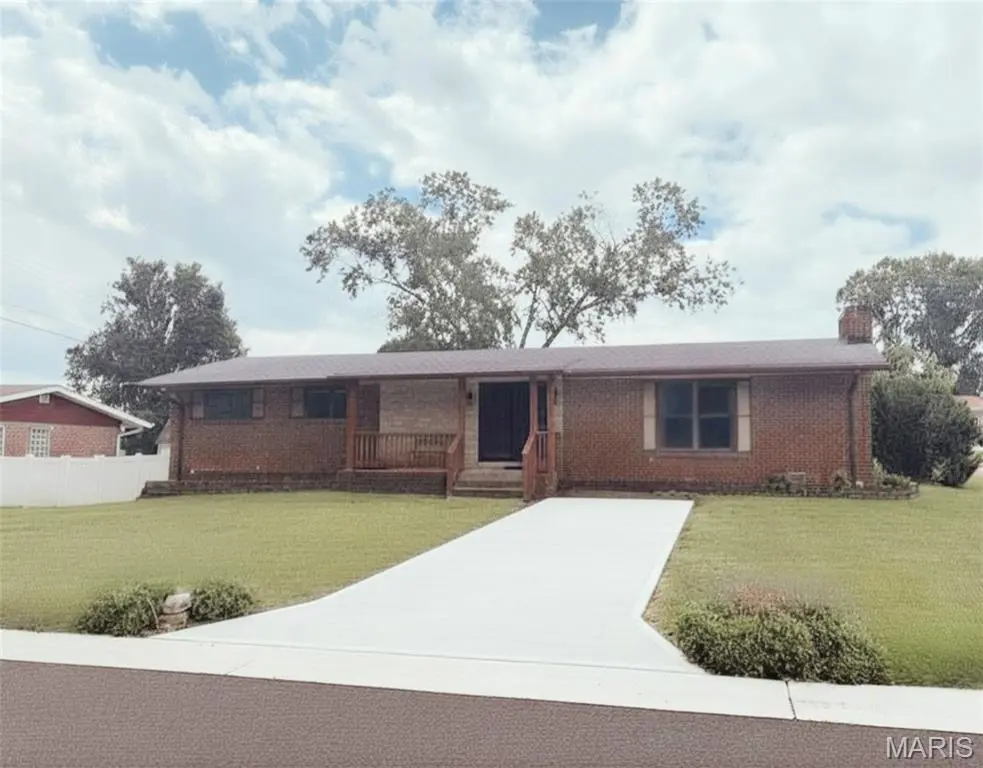
710 Peace Haven Dr · Mehlville, MO
Flood risk 7/10 · Major
- FEMA flood zone
- X (unshaded)
- Chance of flooding over 30 yrs
- 0.76%
- Est. flood insurance / yr
- $473 – $860
Fire risk 1/10 · Minimal
- Est. fire insurance / yr
- $1,054 – $1,958
Heat risk 5/10 · Moderate
- Hot days now (above 107°F)
- 7 days/yr
- Hot days in 30 yrs
- 21 days/yr
Wind risk 2/10 · Minimal
- Chance of severe wind over 30 yrs
- 1.0%
Air-quality risk 3/10 · Minor
- Unhealthy air days now
- 2 days/yr
- Unhealthy air days in 30 yrs
- 3 days/yr
Risk factors via First Street. Map © Google.
Why this score? — see what drove the D grade
The composite is a weighted blend of 9 inputs, each scored 0–100. Each bar is that input's sub-score; the figure is the points it added to the 100-point composite (weight × sub-score).
- ARV discount +13.1/15.0
- Cash flow +11.8/30.0
- DSCR +3.5/10.0
- Schools +3.5/10.0
- Livability +3.3/5.0
- 1% rule +3.0/10.0
- Rent growth +2.5/5.0
- Condition / age +2.5/5.0
- Appreciation +0.0/10.0
$249,900
🖨 Deal sheet 📄 Offer letter ✓ Due diligence
Listing remarks
Charming 3-bedroom, 2-full-bath ranch home tucked on a cul-de-sac in a fantastic neighborhood! This 4-sides brick home offers solid curb appeal, a partially finished walk-out lower level, and great potential for your personal touch. Enjoy the fenced backyard with a small inground pool, perfect for relaxing or entertaining. Detached oversized 2-car garage provides excellent parking, storage, or workspace. A wonderful opportunity to add minor cosmetic updates and make this home shine!
Key facts
- 0.3 acre lot
- 2 garage spots
- Pool
Property features AI
Finance
- HOA & community: Peace Haven association
Exterior
- Parking: Attached garage with space for 2 cars
- Utilities: Public water; Public sewer; Electric service by Ameren; Cable available
- Home design: Single-family residence; One level
- Construction: Brick and stone veneer exterior; Other construction materials
- Exterior features: Private pool; Located on a cul-de-sac; Gentle sloping lot
Interior
- Bedrooms: Three bedrooms on the main level
- Bathrooms: Two full bathrooms (one on main level, one lower level)
- Heating & cooling: Forced-air heating (natural gas); Central air conditioning
- Interior features: Full basement; Two fireplaces; Ceiling fans
Neighborhood map
What this means for you Summary
Snapshot
- This is a 3-bed/1.5-bath single-family listed at $250k.
Deal economics
- At list price, monthly cash flow is $-124 ($-1k/yr) — negative.
- To cash-flow at today's rent, offer at most $228k (8.7% below list).
- To meet the 1% rule (rent ≥ 1% of price), the offer needs to be $200k (20.1% below list).
- Recommended offer: $200k (20.1% below list) — sets the bar for 1% rule.
- Cap rate 6.0% vs local median 4.4% in Mehlville — top-decile yield for the area; either an underpriced asset or a hidden risk that comps aren't pricing in. Stress-test before assuming the spread holds.
Location & tenants
- Location reads 66/100 on livability (#232 in MO) — a middle-class / working-renter tenant base. Strengths: cost of living A+, housing A+; Watch: crime D+, amenities F, commute F.
- Mehlville R-IX (suburban): math 31% / reading 48% proficiency, ranked #126 of 324 in MO (top 39%) — families likely to look elsewhere, expect single-tenant / working-renter base with shorter leases.
- Zoned schools: Beasley Elem. (math 32% / reading 47%, grade F, #537 of 1,115 statewide, top 53%, 283 students, 53% FRL); Mehlville High School (math 26% / reading 54%, grade F, #243 of 521 statewide, top 47%, 1,440 students, 43% FRL) — zoned schools average 48% FRL vs 22% district-wide (26 pts higher); higher-poverty schools than district average — tighter screening recommended.
- Market conditions: 146 active listings in the ZIP; 4 comparable units currently listed for rent nearby; rentals at typical pace (median 20d on market — plan ~3-4 weeks tenant-placement turnaround); 920 units permitted in St. Louis County in 2024 (250 in 5+ unit buildings).
- This rent runs 39% of the median local income ($62k/yr) — at the standard rent-burdened threshold; future hikes will face affordability resistance.
Forward outlook
- Local home prices are declining (-3.0%/yr); year-one equity from $2k of loan paydown is wiped out by about $7k of value loss. Plan a longer hold.
Negotiation context
- Only 6 days on market — expect competitive offers; lowballing is unlikely to land.
Risks & watch-outs
- Watch-outs: flood insurance adds $56/mo.
- Climate carrying-cost: major flood risk; extreme-heat days projected 7→21/yr by 2055 (HVAC capex compounding) — expect insurance premiums to compound above CPI over the hold.
Questions for the listing agent
- What do current leases actually rent for vs. the listed asking? Can we see a recent rent roll and the last 12 months of T-12 income?
- Built in 1963 — when were the roof, HVAC, electrical panel, plumbing, and water heater last replaced?
- What's the actual annual flood-insurance premium (NFIP or private), and is the property in a SFHA with mandatory coverage?
- Is there a deadline driving the sale (1031 exchange, divorce, estate, relocation)? That informs how much negotiation room exists.
- Crime grade is D in this area — have there been break-ins, vandalism, or insurance claims at this property in the last 3 years? What carrier currently insures it and at what premium?
- The area grade is low — what's the realistic commute time and amenity access for the typical tenant pool here? Any planned neighborhood developments (good or bad) we should know about?
- What's the average days-on-market for RENTAL listings here right now (not sales)? A rising rental-DOM trend means longer vacancies and softer asking-rent achievability than the comps imply.
- What's the recent tenant-quality profile in this submarket — average credit score on applications, eviction rate, late-payment / NSF rate, and stable-employment percentage? A property-management company in the area should have these aggregated.
- How much new for-sale + rental construction is in the pipeline within 1–3 miles? Heavy new supply typically softens prices + rents 12–24 months out; constrained supply supports both.
Investment metrics
- 1% rule
- 0.80% ✗
- Cap rate
- 5.97%
- Cash-on-cash
- -1.17%
- DSCR
- 0.95
- GRM
- 10.4
CMA / ARV
- ARV (median comp)
- $285,199
- List price
- $249,900
- Delta
- -12.38%
- Verdict
- UNDERPRICED
- Comps
- 20 within 1.0 mi
Show comp detail 12 sales within ~0.75 mi
| Address | Dist | Beds/Ba | Sqft | Sold | Price | $/sf | Match |
|---|---|---|---|---|---|---|---|
| 710 Peace Haven Dr | 0.00mi | 3/2.0 | 1,537 (0%) | 0mo | $249,900 | $163 | 98 |
| 686 Damascus Dr | 0.13mi | 3/2.0 | 1,446 (-6%) | 2mo | $315,000 | $218 | 81 |
| 657 Damascus Dr | 0.19mi | 3/3.0 | 1,482 (-4%) | 1mo | $310,000 | $209 | 79 |
| 560 Blossomheath Dr | 0.18mi | 3/2.5 | 1,660 (+8%) | 1mo | $249,900 | $151 | 73 |
| 3143 Lin Tel Rd | 0.47mi | 3/1.5 | 1,494 (-3%) | 6mo | $239,000 | $160 | 69 |
| 625 Lind Rd | 0.22mi | 3/2.0 | 1,713 (+12%) | 0mo | $420,000 | $245 | 68 |
| 767 Paschal Dr | 0.61mi | 3/1.5 | 1,392 (-9%) | 4mo | $329,900 | $237 | 53 |
| 904 Victory Dr | 0.44mi | 4/2.0 (+1) | 1,680 (+9%) | 6mo | $199,900 | $119 | 52 |
| 793 Forder Manor Dr | 0.62mi | 2/2.0 (-1) | 1,696 (+10%) | 2mo | $379,900 | $224 | 45 |
| 2907 Hubert Dr | 0.73mi | 4/2.0 (+1) | 1,628 (+6%) | 5mo | $234,000 | $144 | 45 |
| 2957 Caspian Ln | 0.64mi | 4/2.0 (+1) | 1,700 (+11%) | 2mo | $211,000 | $124 | 44 |
| 1104 Brookville Ct | 0.71mi | 4/2.0 (+1) | 1,344 (-13%) | 6mo | $275,000 | $205 | 34 |
Match score weights: distance 35% · size 25% · config 20% · recency 20%. Top-matched comps best support the ARV.
Projected returns pro-forma
-3.0% appreciation · 3.0% rent growth · sell at horizon
- IRR
- -19.8%
- Equity multiple
- 0.31×
- Total profit
- $-48,350
- Equity at exit
- $37,261
- IRR
- -12.7%
- Equity multiple
- 0.25×
- Total profit
- $-52,177
- Equity at exit
- $21,607
Cash invested: $69,972 (down + closing). Projections, not guarantees.
Landlord ↔ Tenant lean methodology
- Overall (STATE)
- 81 Strongly Landlord-Friendly
- State Missouri
- 81 Strongly Landlord-Friendly · R+10
- County
- — inherits STATE
- City
- — inherits STATE
ZIP-level market 63125
- Active inventory
- 146
- Price-to-rent
- 10.4×
Monthly cashflow live
- Estimated rent
- $1,997 medium interval (Pro) →
- Mortgage (P&I)
- −$1,311
- Tax from tax record
- −$231 /mo · $2,775/yr
- Insurance
- −$104
- Flood insurance flood zone
- −$56 /mo · $666/yr
- HOA
- −$0
- Vacancy / Maint / Mgmt
- −$419
- Net cashflow
- $-124
Break-even live
UW: 25.0% down · 7.5% · 30yr · 1.5% tax · 5.0% vac · 8.0% maint · 8.0% mgmt
Financing live
Cash to close
- Down payment
- $62,475
- Closing costs
- $7,497
- Reserves months
- —
- Total cash needed
- —
Loan-product check · same deal, 3 products live
Conventional
25% down · 7.5% · 30yr
- Down + closing
- —
- Monthly P&I
- —
- Monthly cashflow
- —
- DSCR
- —
- Eligible?
- —
Personal DTI + credit; lowest rate.
DSCR
20% down · 8.5% · 30yr
- Down + closing
- —
- Monthly P&I
- —
- Monthly cashflow
- —
- DSCR
- —
- Eligible?
- —
No personal income docs; deal must DSCR.
Hard money
10% down · 12.0% · 12mo
- Down + closing
- —
- Monthly P&I
- —
- Monthly cashflow
- —
- DSCR
- —
- Eligible?
- —
Short-term bridge; refi at stabilization.
Rent comps 4 comps
| Address | Beds | Baths | Sqft | Rent | $/sqft | DOM | Units | Dist |
|---|---|---|---|---|---|---|---|---|
| 4372 Casa Brazilia Dr St. Louis, MO | 1.0–2.0 | 1.0–2.0 | 845 | $1,400 | $1.66 | 1d | 15 | 1.02mi |
| 2628 Wessex Dr Saint Louis, MO | 3.0 | 2.0 | 1560 | $1,975 | $1.27 | 19d | 1 | 1.22mi |
| 3912 Manorwood Dr Saint Louis, MO | 4.0 | 2.0 | 1800 | $2,350 | $1.31 | 44d | 1 | 1.23mi |
| 4001 Mitchford Dr Saint Louis, MO | 3.0 | 2.0 | 1288 | $2,400 | $1.86 | 1d | 1 | 1.28mi |
Listing history 2 events
-
2026-05-14historical $249,900 487-char remark
-
1963-10-22soldstatus
ⓘ Source: listings_history table (triggers on properties + properties_extension) + one-shot
backfill from property_details.listing_events for pre-trigger history.
Tax reassessment forecast MO · Resets to sale price
- Current annual tax
- $2,775 · $231/mo
- Projected year-2 tax
- $2,775 · $231/mo
- Expected delta
- $0/yr ($0/mo · 0.0%)
ⓘ Screening estimate from a state-policy table — verify with the county assessor before closing.
Climate risk First Street
- Flood 7/10 Severe FEMA zone X (unshaded) · 76% chance over 30 yrs
- Wildfire 1/10 Low
- Heat 5/10 Major 7 d/yr ≥107°F today · 21 d/yr by 30 yrs out
- Wind 2/10 Low 100% chance of damaging wind over 30 yrs
- Air quality 3/10 Moderate 2 unhealthy d/yr today · 3 by 30 yrs out
Nearby sold comps map
Loading sold comps map…
Walkable amenities ~0.75 mi
Loading nearby amenities…
Taxation est. · year 1
- Rental income
- $23,968
- − Mortgage interest
- −$13,998
- − Property taxes
- −$2,775
- − Insurance
- −$1,916
- − Repairs & maintenance
- −$1,917
- − Management
- −$1,917
- − Depreciation
- −$7,270
- Taxable loss
- −$5,826
- Est. tax savings @ 24.0%
- +$1,398
- After-tax cash flow
- $-84/yr
For passive investors: Depreciation is non-cash, so a rental often shows a tax loss while cash-flowing — sheltering income. Rental losses are passive: they offset passive income freely, and up to $25,000/yr can offset ordinary (W-2) income if you actively participate and your MAGI is under $100k (phasing out to $0 by $150k); unused losses carry forward. On sale, claimed depreciation is recaptured at up to 25%, and gains may owe capital-gains tax (a 1031 exchange can defer both). Figures are a year-1 estimate at your 24.0% rate — not tax advice; consult a CPA.
Schools (NCES district)
- District
- Mehlville R-IX
- NCES district ID
- 2920670
- Math proficiency
- 31% ▼ -14.00%
- Reading proficiency
- 48% ▼ -5.00%
- Median HH income
- $62,254
- Composite
- 35.19/100
- National rank
- #4995
- State rank
- #126 of 324 in MO
Livability — Mehlville
- Score
- 66/100
- State rank
- #232
- US rank
- #11310
Category grades
Schools grade is shown separately in the Schools card above.
Census & demographics
- Census place
- Mehlville, MO
- County
- Saint Louis County · 888,823 people
- Metro
- St. Louis, MO-IL
- Population (ZIP)
- 33,294
- Household income
- $61,624
- Rent vs Own
- Severe rent burden
- 631.0
Population outlook (St. Louis County) Hauer SSP2
- Today (2025)
- 1,025,227 people
- By 2030
- 1,028,023 · +0.3%
- By 2040
- 1,020,940 · -0.4%
- By 2050
- 1,007,280 · -1.8%
- By 2075
- 987,277 · -3.7%
- By 2100
- 921,984 · -10.1%
Race, ethnicity, and origin ACS 2023
- Neighborhood character
- Predominantly White (86%)
- Race & ethnicity
- White 86% Two or more races 5% Black 4% Hispanic / Latino 4% Asian 2%
- Common ancestry
- American 9% Romanian 3% Lithuanian 3%
- Foreign-born
- 14% · Canada, Vietnam
- Languages at home
- 83% English-only · Russian/Polish/Slavic 11% Spanish 3% Vietnamese 1%
Political lean MEDSL · St. Louis
- 2024 margin
- Strong D (+23.4) · D 60.8% · R 37.4% · Other 1.7%
- 2008→2024 swing
- +3.5pp toward D · 2008: 19.9pp · 2024: 23.4pp
- All cycles
- 2024: D+23.4 2020: D+24.0 2016: D+16.2 2012: D+13.7 2008: D+19.9
Not yet ingested
- Civics
- —
Market trends
- HPI YoY
- ▼ -173.27%
- Current HPI
- 234.3792
- Rent YoY
- —
- Metro
- St. Louis, MO-IL
- State GDP YoY
- ▲ 1.84%
- F500 in state
- 20
Industry mix (Fortune 500 HQ in MO)
| Industry | F500 HQs | Revenue |
|---|---|---|
| Healthcare | 1 | $163B |
|
||
| Insurance | 1 | $21B |
|
||
| Industrial Technology | 1 | $17B |
|
||
| Retail | 1 | $16B |
|
||
| Industrial Distribution | 1 | $10B |
|
||
| Utilities | 1 | $9B |
|
||
Price history
+0.0% since first listed5 events — show timeline
- 2026-06-08 Sold (MLS) — MARIS as Distributed by MLS Grid
- 2026-05-26 Pending — MARIS as Distributed by MLS Grid
- 2026-05-20 Listed $249,900 MARIS as Distributed by MLS Grid
- 2026-05-14 Coming Soon $249,900 MARIS as Distributed by MLS Grid
- 1963-10-22 Sold (Public Records) — Public Records
Property tax history
+3.2%/yrLatest (2022): $2,775 · +3.3% YoY. Source: county tax records.
Cash-flow waterfall
monthlySold comps — $/sqft
last 12 mo · ≤1 miLoading sold comps…