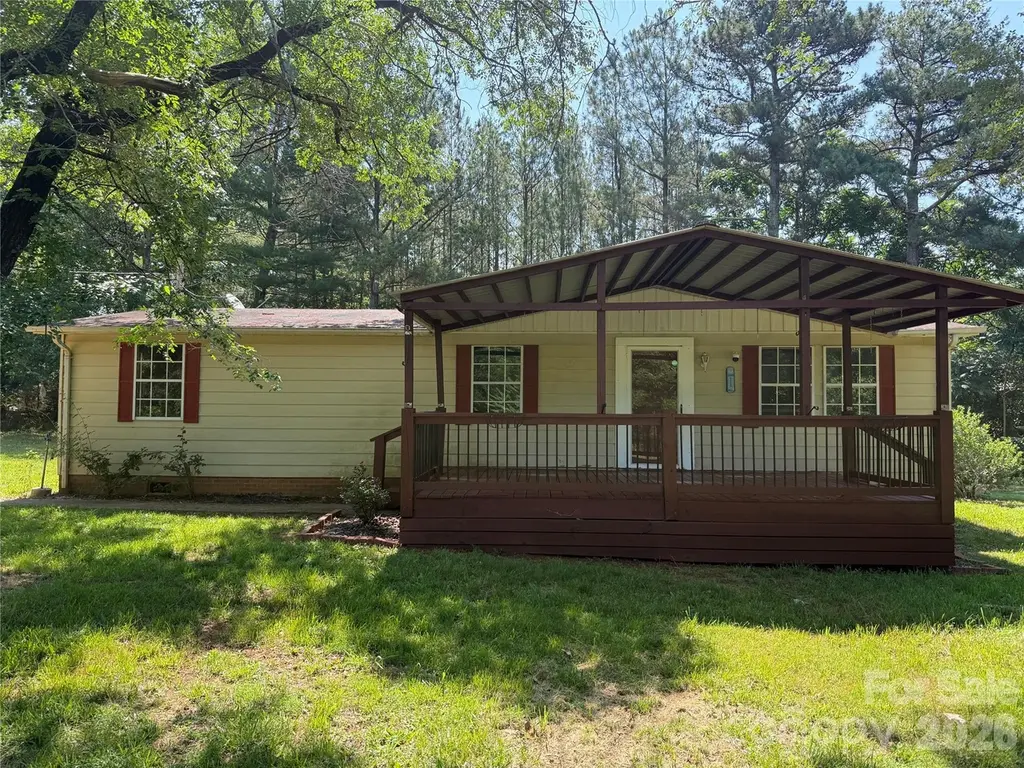
211 Corry Ln · Bostic, NC
Flood risk 1/10 · Minimal
- FEMA flood zone
- X (unshaded)
- Chance of flooding over 30 yrs
- 0.0%
- Est. flood insurance / yr
- $507 – $1,088
Fire risk 5/10 · Moderate
- Est. fire insurance / yr
- $906 – $1,684
Heat risk 5/10 · Moderate
- Hot days now (above 104°F)
- 7 days/yr
- Hot days in 30 yrs
- 17 days/yr
Wind risk 2/10 · Minimal
- Chance of severe wind over 30 yrs
- 0.0%
Air-quality risk 3/10 · Minor
- Unhealthy air days now
- 3 days/yr
- Unhealthy air days in 30 yrs
- 3 days/yr
Risk factors via First Street. Map © Google.
Why this score? — see what drove the D grade
The composite is a weighted blend of 9 inputs, each scored 0–100. Each bar is that input's sub-score; the figure is the points it added to the 100-point composite (weight × sub-score).
- Cash flow +14.5/30.0
- ARV discount +7.5/15.0
- DSCR +4.4/10.0
- Schools +3.6/10.0
- Livability +3.3/5.0
- 1% rule +2.9/10.0
- Rent growth +2.5/5.0
- Condition / age +2.5/5.0
- Appreciation +0.9/10.0
$139,000
🖨 Deal sheet (PDF) 📄 Offer letter ✓ Due diligence
Listing remarks MLS
Good price on doublewide on large level lot located at end of road.
Key facts
- Covered front porch
- Outbuilding
- Private well
Tags
Property features AI
Finance
- Other: Lot size approximately 1.26 acres; No restrictions
- HOA & community: No HOA
Exterior
- Parking: Driveway
- Utilities: Well water; Septic system
- Home design: Manufactured doublewide single-family home; One story; Crawl space foundation
- Construction: Manufactured construction; Aluminum and partial brick exterior
- Exterior features: Deck; Front porch; Road access includes dirt/other surfaces; road responsibility: other (see remarks)
Interior
- Kitchen: Electric range; Microwave; Refrigerator
- Bedrooms: 3 bedrooms on the main level (sizes include ~16'10" x 11'2" and ~14'3" x 11'2")
- Bathrooms: 2 full bathrooms on the main level
- Heating & cooling: Heat pump for heating and cooling
- Interior features: Open room count of 2; Utility room for laundry
- Laundry & utility: Utility room
Neighborhood map
What this means for you Summary
Snapshot
- This is a 3-bed/2.0-bath manufactured listed at $139k.
Deal economics
- At list price, monthly cash flow is $31 ($376/yr) — positive.
- The deal already cash-flows at list — no discount required.
- To meet the 1% rule (rent ≥ 1% of price), the offer needs to be $110k (21.0% below list).
- Recommended offer: $110k (21.0% below list) — sets the bar for 1% rule.
- Cap rate 6.6% vs local median 1.7% in Bostic — top-decile yield for the area; either an underpriced asset or a hidden risk that comps aren't pricing in. Stress-test before assuming the spread holds.
Location & tenants
- Location reads 66/100 on livability (#266 in NC) — a middle-class / working-renter tenant base. Strengths: cost of living A+, health & safety A+, housing B; Watch: crime D-, amenities F, commute F.
- Rutherford County Schools (rural): math 43% / reading 44% proficiency, ranked #98 of 178 in NC (top 55%) — families likely to look elsewhere, expect single-tenant / working-renter base with shorter leases; 60% free/reduced lunch — lower-income household profile, screen leases tightly.
- Zoned schools: Sunshine Elementary School (math 62% / reading 57%, grade B-, #205 of 1,410 statewide, top 16%, 190 students, 98% FRL); East Rutherford Middle School (math 32% / reading 40%, grade F, #273 of 475 statewide, top 58%, 552 students, 100% FRL); East Rutherford High School (math 62% / reading 47%, grade C-, #270 of 535 statewide, top 52%, 659 students, 100% FRL) — zoned schools average 99% FRL vs 60% district-wide (39 pts higher); higher-poverty schools than district average — tighter screening recommended.
- Market conditions: 91 active listings in the ZIP; 193 units permitted in Rutherford County in 2024 (0 in 5+ unit buildings).
Forward outlook
- Local home prices are declining (-3.0%/yr); year-one equity from $961 of loan paydown is wiped out by about $4k of value loss. Plan a longer hold.
- Rutherford County population projected at -17% by 2050 — secular population decline; favor cash flow + early exit over multi-decade hold.
Negotiation context
- Only 9 days on market — expect competitive offers; lowballing is unlikely to land.
- 2 sale attempts since 12y ago with the ask held roughly flat each time — persistent listings suggest the price (not the market) is what's stuck; bring a comps-based counter.
- Current owner paid $19k; list at $139k implies a 624% gain — meaningful room to come down on a strong offer.
Risks & watch-outs
- Climate carrying-cost: moderate wildfire risk; extreme-heat days projected 7→17/yr by 2055 (HVAC capex compounding) — expect insurance premiums to compound above CPI over the hold.
Questions for the listing agent
- Built in 1979 — when were the roof, HVAC, electrical panel, plumbing, and water heater last replaced?
- Is there a deadline driving the sale (1031 exchange, divorce, estate, relocation)? That informs how much negotiation room exists.
- Crime grade is D in this area — have there been break-ins, vandalism, or insurance claims at this property in the last 3 years? What carrier currently insures it and at what premium?
- The area grade is low — what's the realistic commute time and amenity access for the typical tenant pool here? Any planned neighborhood developments (good or bad) we should know about?
- What's the average days-on-market for RENTAL listings here right now (not sales)? A rising rental-DOM trend means longer vacancies and softer asking-rent achievability than the comps imply.
- What's the recent tenant-quality profile in this submarket — average credit score on applications, eviction rate, late-payment / NSF rate, and stable-employment percentage? A property-management company in the area should have these aggregated.
- How much new for-sale + rental construction is in the pipeline within 1–3 miles? Heavy new supply typically softens prices + rents 12–24 months out; constrained supply supports both.
Investment metrics
- 1% rule
- 0.79% ✗
- Cap rate
- 6.56%
- Cash-on-cash
- 0.97%
- DSCR
- 1.04
- GRM
- 10.5
CMA / ARV
No comps found within radius.
Projected returns pro-forma
-3.0% appreciation · 3.0% rent growth · sell at horizon
- IRR
- -14.8%
- Equity multiple
- 0.47×
- Total profit
- $-20,589
- Equity at exit
- $20,725
- IRR
- -6.2%
- Equity multiple
- 0.60×
- Total profit
- $-15,603
- Equity at exit
- $12,018
Cash invested: $38,920 (down + closing). Projections, not guarantees.
Landlord ↔ Tenant lean methodology
- Overall (STATE)
- 85 Strongly Landlord-Friendly
- State North Carolina
- 85 Strongly Landlord-Friendly · R+3
- County
- — inherits STATE
- City
- — inherits STATE
ZIP-level market 28018
- Home prices YoY
- -2.7%
- Active inventory
- 91
- Price-to-rent
- 10.5×
Monthly cashflow live
- Estimated rent
- $1,098 medium interval (Pro) →
- Mortgage (P&I)
- −$729
- Tax from tax record
- −$50 /mo · $594/yr
- Insurance
- −$58
- HOA
- −$0
- Vacancy / Maint / Mgmt
- −$231
- Net cashflow
- $31
Break-even live
Sensitivity live
| Price | -10% $110 | -5% $71 | +0% $31 | +5% $-8 | +10% $-47 |
|---|---|---|---|---|---|
| Rent | -10% $-55 | -5% $-12 | +0% $31 | +5% $75 | +10% $118 |
| Rate | -1.0pp $101 | -0.5pp $67 | base $31 | +0.5pp $-5 | +1.0pp $-41 |
UW: 25.0% down · 7.5% · 30yr · 1.5% tax · 5.0% vac · 8.0% maint · 8.0% mgmt
Financing live
Cash to close
- Down payment
- $34,750
- Closing costs
- $4,170
- Reserves months
- —
- Total cash needed
- —
Loan-product check · same deal, 3 products live
Conventional
25% down · 7.5% · 30yr
- Down + closing
- —
- Monthly P&I
- —
- Monthly cashflow
- —
- DSCR
- —
- Eligible?
- —
Personal DTI + credit; lowest rate.
DSCR
20% down · 8.5% · 30yr
- Down + closing
- —
- Monthly P&I
- —
- Monthly cashflow
- —
- DSCR
- —
- Eligible?
- —
No personal income docs; deal must DSCR.
Hard money
10% down · 12.0% · 12mo
- Down + closing
- —
- Monthly P&I
- —
- Monthly cashflow
- —
- DSCR
- —
- Eligible?
- —
Short-term bridge; refi at stabilization.
Listing history 8 events
-
2026-06-22days on market $139,000 Active 9 DOM
-
2026-06-19days on market $139,000 Active 7 DOM
-
2026-06-18days on market $139,000 Active 6 DOM
-
2026-06-17days on market $139,000 Active 5 DOM
-
2026-06-16days on market $139,000 Active 4 DOM
-
2026-06-15days on market $139,000 Active 3 DOM
-
2026-06-13remarks 699-char remark
-
2026-06-13$139,000 Active 1 DOM
ⓘ Source: listings_history table (triggers on properties + properties_extension) + one-shot
backfill from property_details.listing_events for pre-trigger history.
Tax reassessment forecast NC · Resets to sale price
- Current annual tax
- $594 · $50/mo
- Projected year-2 tax
- $1,140 · $95/mo
- Expected delta
- +$546/yr (+$45/mo · 91.8%)
ⓘ Screening estimate from a state-policy table — verify with the county assessor before closing.
Climate risk First Street
- Flood 1/10 Low FEMA zone X (unshaded) · 0% chance over 30 yrs
- Wildfire 5/10 Major
- Heat 5/10 Major 7 d/yr ≥104°F today · 17 d/yr by 30 yrs out
- Wind 2/10 Low 0% chance of damaging wind over 30 yrs
- Air quality 3/10 Moderate 3 unhealthy d/yr today · 3 by 30 yrs out
Nearby sold comps map
Loading sold comps map…
Walkable amenities ~0.75 mi
Loading nearby amenities…
Taxation est. · year 1
- Rental income
- $13,180
- − Mortgage interest
- −$7,786
- − Property taxes
- −$594
- − Insurance
- −$695
- − Repairs & maintenance
- −$1,054
- − Management
- −$1,054
- − Depreciation
- −$4,044
- Taxable loss
- −$2,048
- Est. tax savings @ 24.0%
- +$491
- After-tax cash flow
- $867/yr
For passive investors: Depreciation is non-cash, so a rental often shows a tax loss while cash-flowing — sheltering income. Rental losses are passive: they offset passive income freely, and up to $25,000/yr can offset ordinary (W-2) income if you actively participate and your MAGI is under $100k (phasing out to $0 by $150k); unused losses carry forward. On sale, claimed depreciation is recaptured at up to 25%, and gains may owe capital-gains tax (a 1031 exchange can defer both). Figures are a year-1 estimate at your 24.0% rate — not tax advice; consult a CPA.
Schools (NCES district)
- District
- Rutherford County Schools
- NCES district ID
- 3704080
- Math proficiency
- 43% ▼ -1.00%
- Reading proficiency
- 44% ▼ -2.00%
- Median HH income
- $36,490
- Composite
- 36.11/100
- National rank
- #4753
- State rank
- #98 of 178 in NC
Livability — Bostic
- Score
- 66/100
- State rank
- #266
- US rank
- #11575
Category grades
Schools grade is shown separately in the Schools card above.
Census & demographics
- Population (ZIP)
- 5,298
Population outlook (Rutherford County) Hauer SSP2
- Today (2025)
- 63,695 people
- By 2030
- 61,670 · -3.2%
- By 2040
- 57,212 · -10.2%
- By 2050
- 52,763 · -17.2%
- By 2075
- 44,493 · -30.1%
- By 2100
- 38,127 · -40.1%
Race, ethnicity, and origin ACS 2023
- Neighborhood character
- Predominantly White (96%)
- Race & ethnicity
- White 96% Hispanic / Latino 2% Native American 1% Black 1%
- Common ancestry
- Slovak 3% Romanian 2% Italian 1%
- Foreign-born
- 1% · Canada
- Languages at home
- 97% English-only · Spanish 2%
Political lean MEDSL · Rutherford
- 2024 margin
- Solid R (+47.8) · D 25.8% · R 73.6%
- 2008→2024 swing
- -16.0pp toward R · 2008: -31.8pp · 2024: -47.8pp
- All cycles
- 2024: R+47.8 2020: R+45.8 2016: R+47.9 2012: R+33.5 2008: R+31.8
Not yet ingested
- Civics
- —
Market trends
- HPI YoY
- ▼ -8.19%
- Current HPI
- 291.1852
- Rent YoY
- —
- Metro
- —
- State GDP YoY
- ▲ 3.28%
- F500 in state
- 26
Industry mix (Fortune 500 HQ in NC)
| Industry | F500 HQs | Revenue |
|---|---|---|
| Financial Services | 2 | $213B |
|
||
| Retail | 2 | $95B |
|
||
| Industrial Conglomerate | 1 | $38B |
|
||
| Metals / Steel | 1 | $35B |
|
||
| Utilities | 1 | $30B |
|
||
| Industrial Machinery | 1 | $19B |
|
||
Price history
+115.5% since first listed6 events — show timeline
- 2026-06-12 Listed $139,000 CANOPYMLS as Distributed by MLS Grid
- 2014-03-25 Sold (MLS) $19,200 NCMMLS
- 2014-03-25 Sold (MLS) $19,200 CANOPYMLS as Distributed by MLS Grid
- 2014-03-12 Delisted — CANOPYMLS as Distributed by MLS Grid
- 2014-01-24 Listed $24,900 CANOPYMLS as Distributed by MLS Grid
- 2008-01-18 Sold (Public Records) $64,500 Public Records
Property tax history
+9.7%/yrLatest (2025): $594 · +13.0% YoY. Source: county tax records.
Cash-flow waterfall
monthlySold comps — $/sqft
last 12 mo · ≤1 miLoading sold comps…