 Triplex
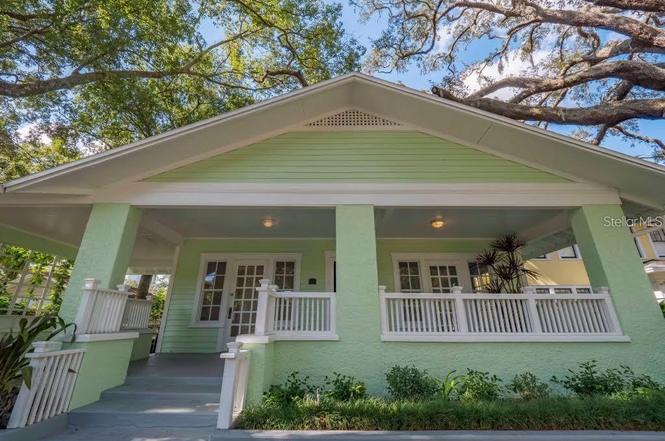
510 N Summerlin Ave · Orlando, FL
Flood risk 1/10 · Minimal
- FEMA flood zone
- X (unshaded)
- Chance of flooding over 30 yrs
- 0.0%
- Est. flood insurance / yr
- $507 – $1,088
Fire risk 1/10 · Minimal
- Est. fire insurance / yr
- $947 – $1,759
Heat risk 9/10 · Severe
- Hot days now (above 107°F)
- 7 days/yr
- Hot days in 30 yrs
- 22 days/yr
Wind risk 9/10 · Severe
- Chance of severe wind over 30 yrs
- 99.0%
Air-quality risk 2/10 · Minimal
- Unhealthy air days now
- 0 days/yr
- Unhealthy air days in 30 yrs
- 1 days/yr
Risk factors via First Street. Map © Google.
Why this score? — see what drove the F grade
The composite is a weighted blend of 9 inputs, each scored 0–100. Each bar is that input's sub-score; the figure is the points it added to the 100-point composite (weight × sub-score).
- ARV discount +7.5/15.0
- Cash flow +6.9/30.0
- Livability +4.3/5.0
- Schools +4.1/10.0
- Rent growth +3.2/5.0
- Condition / age +2.5/5.0
- 1% rule +1.1/10.0
- DSCR +1.1/10.0
- Appreciation +0.0/10.0
$839,000
🖨 Deal sheet 📄 Offer letter ✓ Due diligence
Multi-family units
County records classify this as Multi-Family (2-4 Unit). Listing-text estimate: 3 units. confirmed
Listing remarks
This charming triplex in the heart of Downtown Orlando offers three 1-bedroom, 1-bathroom units, perfect for investors or anyone looking to live in one unit while renting the others. All 3 units were beautifully renovated in 2021 and feature updated kitchens, modern finishes, newly installed AC systems, and full-size in-unit laundry, making them highly desirable and move-in ready. Unit 3 includes a private second-floor screened balcony, providing a relaxing outdoor space and a unique rental draw. Situated steps from Orlando’s best dining, entertainment, Lake Eola Park, and major downtown employers, this property delivers unbeatable convenience and strong long-term demand. Whether you'
Key facts
- Modern finishes
- Updated kitchens
- 5,015 sq ft lot
Tags
Property features AI
Finance
- Other: Total living area reported as 1,903 square feet (public records)
- Financial info: Gross income reported at $64,800; Annual net income reported at $51,485; Pro forma rent listed at $1,800 per unit for three 1-bedroom units (potential total $5,400/month); Tenants pay electricity, sewer, trash collection, and water
- HOA & community: No HOA/association
Exterior
- Utilities: Public water; Public sewer; Cable available and connected; Electricity available and connected; Water available and connected; Sewer available and connected
- Home design: Residential income property (Triplex); Single building; R-2B/T/HP zoning; 0.12 acre lot; Asphalt road access
- Construction: Frame construction; Shingle roof; Crawlspace foundation; Built as a triplex (single-story details not specified)
- Exterior features: Covered front porch; Sidewalk; Irrigation equipment
Interior
- Bedrooms: 3 bedrooms total; Three 1-bedroom units (each unit is 1 bedroom)
- Bathrooms: Each unit has 1 bathroom
- Heating & cooling: Central heating; Central air conditioning
- Interior features: Ceiling fans
- Laundry & utility: Laundry inside
Neighborhood map
What this means for you Summary
Snapshot
- This is a 3 × 1-bed/1.0-bath units multifamily listed at $839k.
Deal economics
- At list price, monthly cash flow is $-1k ($-15k/yr) — negative. Per door: $-426/mo.
- To cash-flow at today's rent, offer at most $613k (26.9% below list).
- To meet the 1% rule (rent ≥ 1% of price), the offer needs to be $510k (39.2% below list).
- Recommended offer: $510k (39.2% below list) — sets the bar for 1% rule.
- Cap rate 4.5% vs local median 3.0% in Orlando — top-decile yield for the area; either an underpriced asset or a hidden risk that comps aren't pricing in. Stress-test before assuming the spread holds.
Location & tenants
- Location reads 86/100 on livability (#12 in FL, #360 nationally) — a professional / high-income tenant draw. Strengths: amenities A+, commute A+, housing A+.
- Orange (suburban): math 46% / reading 51% proficiency, ranked #43 of 73 in FL (top 59%) — families likely to look elsewhere, expect single-tenant / working-renter base with shorter leases.
- Zoned schools: Lake Como School (math 45% / reading 49%, grade D-, #1,191 of 2,144 statewide, top 57%, 885 students, 54% FRL); Edgewater High (math 14% / reading 46%, grade F, #441 of 667 statewide, top 67%, 2,059 students, 52% FRL) — zoned schools at 53% FRL track the district average.
- Market conditions: Rents rising (+2.6%/yr); 180 active listings in the ZIP; 40 comparable units currently listed for rent nearby; rentals at typical pace (median 18d on market — plan ~3-4 weeks tenant-placement turnaround); solid renter incomes; 8,053 units permitted in Orange County in 2024 (3,133 in 5+ unit buildings).
- At $5,098/mo this rent would consume 57% of the median local household income ($108k/yr) (locally 793% of renters already pay >50% of income on rent) — very limited rent-growth headroom before tenants either downsize or default.
Forward outlook
- Local home prices are declining (-3.0%/yr); year-one equity from $6k of loan paydown is wiped out by about $25k of value loss. Plan a longer hold.
- Orange County population projected at +52% by 2050 — long-run rental-demand tailwind backs the buy-and-hold thesis.
Negotiation context
- It's been on market 205 days — a 12% lower offer ($738k) is reasonable based on typical stale-listing flexibility.
- 7 sale attempts since 5y ago with the ask held roughly flat each time — persistent listings suggest the price (not the market) is what's stuck; bring a comps-based counter.
- Current owner paid $300k; list at $839k implies a 180% gain — meaningful room to come down on a strong offer.
Risks & watch-outs
- Watch-outs: built in 1925 — expect roof / HVAC / electrical / plumbing capex.
- Climate carrying-cost: severe wind risk, 99% chance of damaging wind over 30y; extreme-heat days projected 7→22/yr by 2055 (HVAC capex compounding) — expect insurance premiums to compound above CPI over the hold.
Questions for the listing agent
- What do current leases actually rent for vs. the listed asking? Can we see a recent rent roll and the last 12 months of T-12 income?
- It's been on market 205 days. Have you received any prior offers? Is the seller open to a 39% concession, seller financing, or rate buy-down credit?
- Can we see the unit-by-unit rent roll, current vacancy, and any below-market leases? What's the average tenancy length?
- What capital expenditures (roof, boiler, parking lot, exteriors) have been made in the last 5 years, and what's planned in the next 2?
- Built in 1925 — when were the roof, HVAC, electrical panel, plumbing, and water heater last replaced?
- Why hasn't it sold? Are there any deal-killer items the seller is aware of (foundation, flood, title, zoning, code violations)?
- Is there a deadline driving the sale (1031 exchange, divorce, estate, relocation)? That informs how much negotiation room exists.
- Schools are B-rated — typically a magnet for longer-tenancy family renters. What's the average tenant stay here, and is there a school-zone premium baked into asking?
- The area grade is low — what's the realistic commute time and amenity access for the typical tenant pool here? Any planned neighborhood developments (good or bad) we should know about?
- What's the average days-on-market for RENTAL listings here right now (not sales)? A rising rental-DOM trend means longer vacancies and softer asking-rent achievability than the comps imply.
- What's the recent tenant-quality profile in this submarket — average credit score on applications, eviction rate, late-payment / NSF rate, and stable-employment percentage? A property-management company in the area should have these aggregated.
- How much new apartment / multifamily construction is in the pipeline within 1–3 miles? Heavy new supply (>2% of stock underway) typically softens rents 12–24 months out; light construction supports rent growth.
Investment metrics
- 1% rule
- 0.61% ✗
- Cap rate
- 4.46%
- Cash-on-cash
- -6.53%
- DSCR
- 0.71
- GRM
- 13.7
CMA / ARV
- ARV (on-the-fly)
- $551,870
- Comps found
- 2
Show comp detail 2 sales within ~0.75 mi
| Address | Dist | Beds/Ba | Sqft | Sold | Price | $/sf | Match |
|---|---|---|---|---|---|---|---|
| 511 Broadway Ave | 0.23mi | 4/2.0 (+1) | 1,850 (-3%) | 6mo | $325,000 | $176 | 71 |
| 1239 E Ridgewood St | 0.42mi | 4/3.0 (+1) | 1,999 (+5%) | 10mo | $580,000 | $290 | 58 |
Match score weights: distance 35% · size 25% · config 20% · recency 20%. Top-matched comps best support the ARV.
Projected returns pro-forma
-3.0% appreciation · 2.64% rent growth · sell at horizon
- IRR
- -28.0%
- Equity multiple
- 0.07×
- Total profit
- $-219,419
- Equity at exit
- $125,098
- IRR
- -28.2%
- Equity multiple
- -0.30×
- Total profit
- $-304,293
- Equity at exit
- $72,541
Cash invested: $234,920 (down + closing). Projections, not guarantees.
Landlord ↔ Tenant lean methodology
- Overall (STATE)
- 87 Strongly Landlord-Friendly
- State Florida
- 87 Strongly Landlord-Friendly · R+3
- County
- — inherits STATE
- City
- — inherits STATE
ZIP-level market 32803
- Rents YoY
- 2.6%
- Active inventory
- 180
- Price-to-rent
- 41.1×
Monthly cashflow live
- Estimated rent
- $5,098 high interval (Pro) →
- Mortgage (P&I)
- −$4,400
- Tax from tax record
- −$556 /mo · $6,673/yr
- Insurance
- −$350
- HOA
- −$0
- Vacancy / Maint / Mgmt
- −$1,071
- Net cashflow
- $-1,278
Break-even live
3-unit breakdown (identical units grouped — click to expand)
| Units | Beds | Baths | Est. rent |
|---|---|---|---|
| 3× units | 1 | 1 | $5,097 |
| #1 | 1 | 1 | $1,699 |
| #2 | 1 | 1 | $1,699 |
| #3 | 1 | 1 | $1,699 |
| Total (3 units) | $5,098 | ||
UW: 25.0% down · 7.5% · 30yr · 1.5% tax · 5.0% vac · 8.0% maint · 8.0% mgmt
Financing live
Cash to close
- Down payment
- $209,750
- Closing costs
- $25,170
- Reserves months
- —
- Total cash needed
- —
Loan-product check · same deal, 3 products live
Conventional
25% down · 7.5% · 30yr
- Down + closing
- —
- Monthly P&I
- —
- Monthly cashflow
- —
- DSCR
- —
- Eligible?
- —
Personal DTI + credit; lowest rate.
DSCR
20% down · 8.5% · 30yr
- Down + closing
- —
- Monthly P&I
- —
- Monthly cashflow
- —
- DSCR
- —
- Eligible?
- —
No personal income docs; deal must DSCR.
Hard money
10% down · 12.0% · 12mo
- Down + closing
- —
- Monthly P&I
- —
- Monthly cashflow
- —
- DSCR
- —
- Eligible?
- —
Short-term bridge; refi at stabilization.
Rent comps 40 comps
| Address | Beds | Baths | Sqft | Rent | $/sqft | DOM | Units | Dist |
|---|---|---|---|---|---|---|---|---|
| 520 E Amelia St Orlando, FL | 2.0 | 2.0 | 1250 | $2,400 | $1.92 | 24d | 1 | 0.14mi |
| 400 E Colonial Dr Orlando, FL | 2.0 | 2.0 | 1179 | $2,485 | $2.11 | 3d | 1 | 0.27mi |
| 266 Park Lake St Unit 19 Orlando, FL | 3.0 | 3.5 | 1785 | $4,600 | $2.58 | 24d | 1 | 0.45mi |
| 266 Park Lake St Unit 14 Orlando, FL | 3.0 | 3.5 | 2381 | $5,400 | $2.27 | 20d | 1 | 0.45mi |
| 1504 Mount Vernon St Orlando, FL | 3.0 | 2.0 | 1981 | $3,195 | $1.61 | 3d | 1 | 0.47mi |
| 218 Park Lake St #01 Orlando, FL | 3.0 | 3.5 | 2385 | $6,250 | $2.62 | 20d | 1 | 0.47mi |
| 431 E Central Blvd Orlando, FL | 3.0 | 1.0–3.0 | 1228 | $3,420 | $2.79 | 2d | 24 | 0.52mi |
| 335 N Magnolia Ave Orlando, FL | 3.0 | 1.0–3.0 | 1041 | $2,640 | $2.54 | 2d | 35 | 0.53mi |
| 151 E Robinson St Orlando, FL | 4.0 | 1.0–3.5 | 1815 | $7,950 | $4.38 | 15d | 2 | 0.54mi |
| 150 E Robinson St Unit 31B Orlando, FL | 2.0 | 2.0 | 1237 | $3,400 | $2.75 | 18d | 1 | 0.56mi |
| 1 S Eola Dr #11 Orlando, FL | 3.0 | 3.0 | 1978 | $3,795 | $1.92 | 24d | 1 | 0.56mi |
| 1513 Woodward St Orlando, FL | 3.0 | 2.5 | 1542 | $2,950 | $1.91 | 24d | 1 | 0.56mi |
| 21 N Mills Ave Orlando, FL | 3.0 | 1.0 | 1382 | $2,250 | $1.63 | 22d | 1 | 0.57mi |
| 1010 E Central Blvd Orlando, FL | 2.0 | 1.0 | 1317 | $1,899 | $1.44 | 22d | 1 | 0.60mi |
| 415 E Pine St Orlando, FL | 2.0 | 2.0 | 1471 | $2,595 | $1.76 | 15d | 1 | 0.61mi |
| 151 E Washington St Orlando, FL | 2.0 | 2.0 | 1507 | $3,250 | $2.16 | 24d | 2 | 0.61mi |
| 823 La Salle Ave Orlando, FL | 3.0 | 3.0 | 1350 | $3,950 | $2.93 | 3d | 1 | 0.61mi |
| 413 E Pine St Orlando, FL | 3.0 | 2.0 | 1743 | $3,485 | $2.00 | 24d | 1 | 0.62mi |
| 100 S Eola Dr #607 Orlando, FL | 2.0 | 2.0 | 1970 | $3,795 | $1.93 | 11d | 1 | 0.64mi |
| 410 N Orange Ave Orlando, FL | 3.0 | 1.0–3.0 | 854 | $4,725 | $5.53 | 2d | 181 | 0.65mi |
| 101 Lake Ave Orlando, FL | 3.0 | 2.0 | 1706 | $4,000 | $2.34 | 24d | 1 | 0.67mi |
| 612 E Church St Orlando, FL | 3.0 | 2.5 | 1764 | $2,795 | $1.58 | 2d | 1 | 0.67mi |
| 520 E Church St Orlando, FL | 1.0–3.0 | 1.0–2.0 | 1108 | $3,829 | $3.45 | 3d | 14 | 0.67mi |
| 420 E Church St Orlando, FL | 1.0–3.0 | 1.0–2.0 | 1086 | $3,289 | $3.03 | 3d | 12 | 0.70mi |
| 899 N Orange Ave Orlando, FL | 1.0–2.0 | 1.0–2.0 | 1067 | $2,837 | $2.66 | 2d | 10 | 0.70mi |
| 820 Altaloma Ave Orlando, FL | 3.0 | 3.0 | 2200 | $2,900 | $1.32 | 24d | 1 | 0.71mi |
| 125 E Pine St Orlando, FL | 2.0 | 2.0 | 1237 | $3,150 | $2.55 | 24d | 1 | 0.72mi |
| 525 E Jackson St Unit P4 Orlando, FL | 2.0 | 2.0 | 1691 | $6,400 | $3.78 | 24d | 1 | 0.74mi |
| 525 E Jackson St Unit P3 Orlando, FL | 2.0 | 2.0 | 1644 | $6,200 | $3.77 | 24d | 1 | 0.74mi |
| 525 E Jackson St Orlando, FL | 1.0–3.0 | 1.0–2.0 | 1540 | $6,500 | $4.22 | 14d | 6 | 0.74mi |
| 260 S Osceola Ave #1106 Orlando, FL | 2.0 | 2.5 | 2000 | $4,750 | $2.38 | 24d | 1 | 0.74mi |
| 260 S Osceola Ave Orlando, FL | 2.0 | 2.0–2.5 | 1882 | $4,350 | $2.31 | 16d | 2 | 0.74mi |
| 1900 E Jefferson St Orlando, FL | 3.0 | 2.0 | 1602 | $2,800 | $1.75 | 11d | 1 | 0.82mi |
| 1219 Lake Highland Dr Orlando, FL | 3.0 | 2.0 | 1320 | $2,500 | $1.89 | 24d | 1 | 0.86mi |
| 2165 Ridgewood St Orlando, FL | 3.0 | 2.5 | 1910 | $3,395 | $1.78 | 2d | 1 | 0.93mi |
| 2316 E Concord St #9 Orlando, FL | 3.0 | 3.0 | 1727 | $3,495 | $2.02 | 24d | 1 | 1.01mi |
| 544 N Bumby Ave Unit 5 Orlando, FL | 3.0 | 3.0 | 1807 | $4,095 | $2.27 | 24d | 1 | 1.01mi |
| 505 Chatham Ave Orlando, FL | 3.0 | 1.0–2.0 | 1022 | $3,144 | $3.08 | 3d | 27 | 1.02mi |
| 1033 N Hampton Ave Orlando, FL | 3.0 | 2.0 | 1402 | $2,995 | $2.14 | 8d | 1 | 1.03mi |
| 1460 Alden Rd Orlando, FL | 1.0–3.0 | 1.0–3.0 | 1020 | $3,804 | $3.73 | 2d | 39 | 1.09mi |
Listing history 28 events
-
2026-06-18days on market $839,000 Active 205 DOM
-
2026-06-17days on market $839,000 Active 204 DOM
-
2026-06-16days on market $839,000 Active 203 DOM
-
2026-06-15days on market $839,000 Active 202 DOM
-
2026-06-13days on market $839,000 Active 200 DOM
-
2026-06-13days on market $839,000 Active 199 DOM
-
2026-06-09days on market $839,000 Active 196 DOM
-
2026-06-08days on market $839,000 Active 195 DOM
-
2026-06-07days on market $839,000 Active 194 DOM
-
2026-06-04days on market $839,000 Active 191 DOM
-
2026-06-03days on market $839,000 Active 190 DOM
-
2026-06-02days on market $839,000 Active 189 DOM
-
2026-06-02days on market $839,000 Active 188 DOM
-
2026-05-31days on market $839,000 Active 187 DOM
-
2025-11-25$839,000 Active
-
2025-10-01historical
-
2025-09-25status Active
-
2025-03-11$849,000 Active
-
2024-09-13historical
-
2024-05-05price $849,000
-
2023-09-20status Active
-
2023-08-25status Pending
-
2023-08-14status Active
-
2023-07-31status Pending
-
2023-07-27$839,000 Active
-
2021-04-05historical
-
2021-02-18$699,000 Active
-
2018-01-26soldstatus $300,000
ⓘ Source: listings_history table (triggers on properties + properties_extension) + one-shot
backfill from property_details.listing_events for pre-trigger history.
Tax reassessment forecast FL · Resets to sale price
- Current annual tax
- $6,673 · $556/mo
- Projected year-2 tax
- $6,964 · $580/mo
- Expected delta
- +$291/yr (+$24/mo · 4.4%)
ⓘ Screening estimate from a state-policy table — verify with the county assessor before closing.
Climate risk First Street
- Flood 1/10 Low FEMA zone X (unshaded) · 0% chance over 30 yrs
- Wildfire 1/10 Low
- Heat 9/10 Extreme 7 d/yr ≥107°F today · 22 d/yr by 30 yrs out
- Wind 9/10 Extreme 99% chance of damaging wind over 30 yrs
- Air quality 2/10 Low 0 unhealthy d/yr today · 1 by 30 yrs out
Nearby sold comps map
Loading sold comps map…
Walkable amenities ~0.75 mi
Loading nearby amenities…
Taxation est. · year 1
- Rental income
- $61,176
- − Mortgage interest
- −$46,997
- − Property taxes
- −$6,673
- − Insurance
- −$4,195
- − Repairs & maintenance
- −$4,894
- − Management
- −$4,894
- − Depreciation
- −$24,407
- Taxable loss
- −$30,884
- Est. tax savings @ 24.0%
- +$7,412
- After-tax cash flow
- $-7,924/yr
For passive investors: Depreciation is non-cash, so a rental often shows a tax loss while cash-flowing — sheltering income. Rental losses are passive: they offset passive income freely, and up to $25,000/yr can offset ordinary (W-2) income if you actively participate and your MAGI is under $100k (phasing out to $0 by $150k); unused losses carry forward. On sale, claimed depreciation is recaptured at up to 25%, and gains may owe capital-gains tax (a 1031 exchange can defer both). Figures are a year-1 estimate at your 24.0% rate — not tax advice; consult a CPA.
Schools (NCES district)
- District
- Orange
- NCES district ID
- 1201440
- Math proficiency
- 46% ▼ -9.00%
- Reading proficiency
- 51% ▼ -2.00%
- Median HH income
- $49,350
- Composite
- 41.47/100
- National rank
- #3461
- State rank
- #43 of 73 in FL
Livability — Orlando
- Score
- 86/100
- State rank
- #12
- US rank
- #360
Category grades
Schools grade is shown separately in the Schools card above.
Census & demographics
- Census place
- Orlando, FL
- County
- Orange County · 1,471,359 people
- City population
- 964,969
- Metro
- Orlando-Kissimmee-Sanford, FL
- Population (ZIP)
- 22,152
- Household income
- $107,592
- Rent vs Own
- Severe rent burden
- 793.0
Population outlook (Orange County) Hauer SSP2
- Today (2025)
- 1,618,226 people
- By 2030
- 1,787,404 · +10.5%
- By 2040
- 2,125,621 · +31.4%
- By 2050
- 2,454,016 · +51.6%
- By 2075
- 3,173,711 · +96.1%
- By 2100
- 3,607,781 · +122.9%
Race, ethnicity, and origin ACS 2023
- Neighborhood character
- Predominantly White (69%)
- Race & ethnicity
- White 69% Hispanic / Latino 17% Two or more races 13% Asian 5% Black 4%
- Hispanic origin (detail)
- Mexican 2% Puerto Rican 7% Cuban 2%
- Common ancestry
- Romanian 3% Slovak 3% Italian 2%
- Foreign-born
- 8% · Canada, Dominican Republic, Vietnam
- Languages at home
- 85% English-only · Spanish 10% Other Indo-European 1% Tagalog/Filipino 1%
Political lean MEDSL · Orange
- 2024 margin
- D (+13.6) · D 56.1% · R 42.5% · Other 1.3%
- 2008→2024 swing
- -5.0pp toward R · 2008: 18.6pp · 2024: 13.6pp
- All cycles
- 2024: D+13.6 2020: D+23.1 2016: D+24.6 2012: D+18.2 2008: D+18.6
Not yet ingested
- Civics
- —
Market trends
- HPI YoY
- ▼ -505.52%
- Current HPI
- 303.0942
- Rent YoY
- ▲ 2.64%
- Metro
- Orlando-Kissimmee-Sanford, FL
- State GDP YoY
- ▲ 3.28%
- F500 in state
- 36
Industry mix (Fortune 500 HQ in FL)
| Industry | F500 HQs | Revenue |
|---|---|---|
| Industrial Technology | 2 | $29B |
|
||
| Insurance | 2 | $17B |
|
||
| Retail | 1 | $60B |
|
||
| Technology Distribution | 1 | $58B |
|
||
| Homebuilding | 1 | $35B |
|
||
| Technology Manufacturing | 1 | $35B |
|
||
Price history
+179.7% since first listed14 events — show timeline
- 2025-11-25 Listed $839,000 Stellar MLS as Distributed by MLS Grid
- 2025-10-01 Listing Removed — Stellar MLS as Distributed by MLS Grid
- 2025-09-25 Relisted — Stellar MLS as Distributed by MLS Grid
- 2025-03-11 Listed $849,000 Stellar MLS as Distributed by MLS Grid
- 2024-09-13 Listing Removed — Stellar MLS as Distributed by MLS Grid
- 2024-05-05 Price Changed $849,000 Stellar MLS as Distributed by MLS Grid
- 2023-09-20 Relisted — Stellar MLS as Distributed by MLS Grid
- 2023-08-25 Pending — Stellar MLS as Distributed by MLS Grid
- 2023-08-14 Relisted — Stellar MLS as Distributed by MLS Grid
- 2023-07-31 Pending — Stellar MLS as Distributed by MLS Grid
- 2023-07-27 Listed $839,000 Stellar MLS as Distributed by MLS Grid
- 2021-04-05 Listing Removed — Stellar MLS as Distributed by MLS Grid
- 2021-02-18 Listed $699,000 Stellar MLS as Distributed by MLS Grid
- 2018-01-26 Sold (Public Records) $300,000 Public Records
Property tax history
+7.0%/yrLatest (2025): $6,673 · +7.9% YoY. Source: county tax records.
Cash-flow waterfall
monthlySold comps — $/sqft
last 12 mo · ≤1 miLoading sold comps…