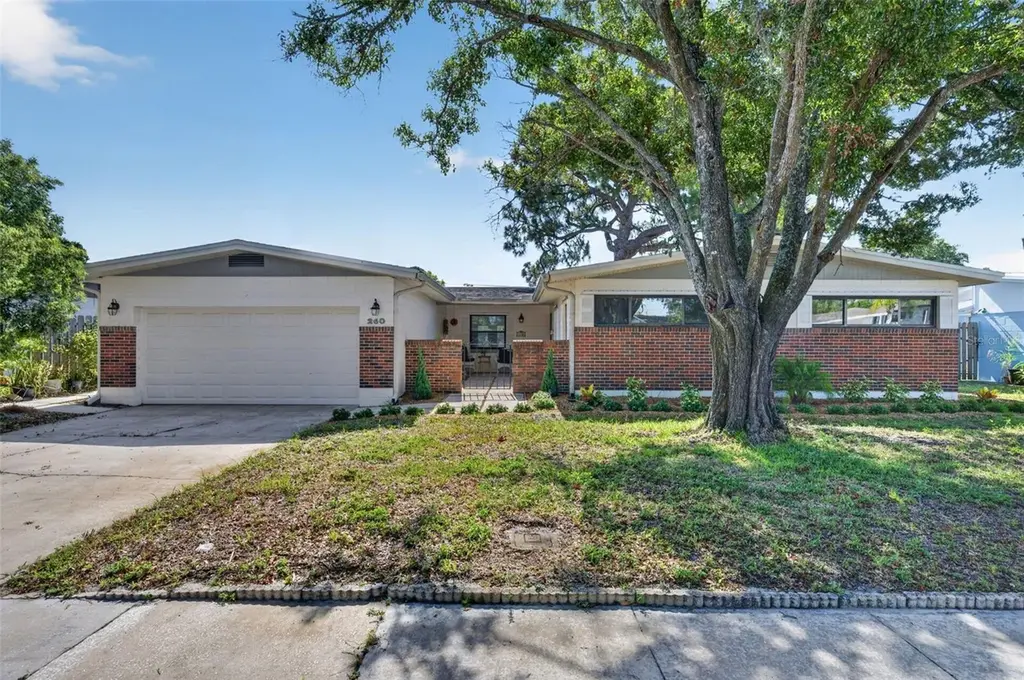
260 E Lauren Ct · Merritt Island, FL
Flood risk 7/10 · Major
- FEMA flood zone
- X (unshaded)
- Chance of flooding over 30 yrs
- 0.75%
- Est. flood insurance / yr
- $507 – $1,088
Fire risk 1/10 · Minimal
- Est. fire insurance / yr
- $947 – $1,759
Heat risk 10/10 · Severe
- Hot days now (above 105°F)
- 7 days/yr
- Hot days in 30 yrs
- 23 days/yr
Wind risk 10/10 · Severe
- Chance of severe wind over 30 yrs
- 99.0%
Air-quality risk 1/10 · Minimal
- Unhealthy air days now
- 0 days/yr
- Unhealthy air days in 30 yrs
- 0 days/yr
Risk factors via First Street. Map © Google.
Why this score? — see what drove the B- grade
The composite is a weighted blend of 9 inputs, each scored 0–100. Each bar is that input's sub-score; the figure is the points it added to the 100-point composite (weight × sub-score).
- Cash flow +27.5/30.0
- DSCR +9.6/10.0
- ARV discount +7.5/15.0
- 1% rule +6.5/10.0
- Schools +4.7/10.0
- Rent growth +4.1/5.0
- Livability +3.5/5.0
- Condition / age +2.5/5.0
- Appreciation +0.0/10.0
$250,000
🖨 Deal sheet 📄 Offer letter ✓ Due diligence
Listing remarks
Island living meets investment opportunity! Welcome to this charming 3-bedroom, 2-bathroom home nestled in the heart of Merritt Island, perfectly positioned between the scenic Indian River and Banana River. This prime location offers the best of Florida’s Space Coast lifestyle, with easy access to boating, fishing, kayaking, and breathtaking waterfront sunsets. Just minutes from the world-famous beaches of Cocoa Beach, Port Canaveral, and the exciting attractions of Cape Canaveral, this property is ideal as a primary residence, vacation home, or income-producing investment. With its desirable location near cruise terminals, Kennedy Space Center launches, and year-round tourism, the
Key facts
- Waterfront sunsets
- Prime location
- 7,405 sq ft lot
Tags
Property features AI
Finance
- Other: Zoned RU19; Lot approximately 0.17 acre (about 74 x 100); Living area reported as 1,950 (per public records); total building area 2,480; Property listed by Fannie Hillman & Associates
- HOA & community: No HOA/association indicated; Pets allowed
Exterior
- Parking: Driveway; Attached 2-car garage with workshop space
- Utilities: Public water; Public sewer; Electricity connected; Natural gas available and connected; Cable available; Broadband/high-speed internet available; Water connected
- Home design: Single family residence; One story; Facing west; Homestead property
- Construction: Concrete construction; Shingle roof; Slab foundation; Built on one level
- Exterior features: Deck; Hurricane shutters; Rain gutters; Sidewalk; Sliding doors; Vinyl and wood fencing; Paved lot with asphalt road frontage
Interior
- Kitchen: Dishwasher; Refrigerator; Gas water heater
- Bedrooms: 3 bedrooms
- Flooring: Carpet; Ceramic tile; Terrazzo
- Bathrooms: 2 full bathrooms
- Heating & cooling: Central heating; Central air conditioning
- Interior features: Solid wood cabinets; Thermostat; Formal living room (separate); Decorative free-standing wood-burning fireplace; Exhaust fan
- Laundry & utility: Washer hookup; Gas dryer hookup; Laundry located inside
Neighborhood map
What this means for you Summary
Snapshot
- This is a 3-bed/2.0-bath single-family listed at $250k.
Deal economics
- At list price, monthly cash flow is $672 ($8k/yr) — positive.
- The deal already cash-flows at list — no discount required.
- Meets the 1% rule at list price ($3k rent vs $250k).
Location & tenants
- Location reads 70/100 on livability (#441 in FL) — a middle-class / working-renter tenant base. Strengths: crime A+, housing A+, employment A-; Watch: amenities F, commute F, health & safety D-.
- Brevard (suburban): math 53% / reading 57% proficiency, ranked #19 of 73 in FL (top 26%) — acceptable for families but not a draw, mixed tenant base, ~2y average lease.
- Market conditions: Rents rising fast (+6.5%/yr); 227 active listings in the ZIP; 16 comparable units currently listed for rent nearby; rentals at typical pace (median 24d on market — plan ~3-4 weeks tenant-placement turnaround); solid renter incomes; 4,602 units permitted in Brevard County in 2024 (702 in 5+ unit buildings).
- This rent runs 33% of the median local income ($103k/yr) — at the standard rent-burdened threshold; future hikes will face affordability resistance.
Forward outlook
- Local home prices are declining (-3.0%/yr); year-one equity from $2k of loan paydown is wiped out by about $8k of value loss. Plan a longer hold.
- Brevard County population projected at +15% by 2050 — modest demand growth; plan on rents tracking national, not racing it.
- At projected returns (-3.0% appreciation + 6.5% rent growth), your $70k cash investment doubles in ~8 years — after that, you're playing with house money.
Negotiation context
- Only 1 days on market — expect competitive offers; lowballing is unlikely to land.
Risks & watch-outs
- Watch-outs: flood insurance adds $66/mo.
- Climate carrying-cost: major flood risk; severe wind risk, 99% chance of damaging wind over 30y; extreme-heat days projected 7→23/yr by 2055 (HVAC capex compounding) — expect insurance premiums to compound above CPI over the hold.
Questions for the listing agent
- Built in 1963 — when were the roof, HVAC, electrical panel, plumbing, and water heater last replaced?
- What's the actual annual flood-insurance premium (NFIP or private), and is the property in a SFHA with mandatory coverage?
- Is there a deadline driving the sale (1031 exchange, divorce, estate, relocation)? That informs how much negotiation room exists.
- Schools are B-rated — typically a magnet for longer-tenancy family renters. What's the average tenant stay here, and is there a school-zone premium baked into asking?
- What's the average days-on-market for RENTAL listings here right now (not sales)? A rising rental-DOM trend means longer vacancies and softer asking-rent achievability than the comps imply.
- What's the recent tenant-quality profile in this submarket — average credit score on applications, eviction rate, late-payment / NSF rate, and stable-employment percentage? A property-management company in the area should have these aggregated.
- How much new for-sale + rental construction is in the pipeline within 1–3 miles? Heavy new supply typically softens prices + rents 12–24 months out; constrained supply supports both.
Investment metrics
- 1% rule
- 1.15% ✓
- Cap rate
- 9.84%
- Cash-on-cash
- 12.67%
- DSCR
- 1.56
- GRM
- 7.3
CMA / ARV
No comps found within radius.
Projected returns pro-forma
-3.0% appreciation · 6.53% rent growth · sell at horizon
- IRR
- 4.6%
- Equity multiple
- 1.18×
- Total profit
- $12,805
- Equity at exit
- $37,276
- IRR
- 16.9%
- Equity multiple
- 2.61×
- Total profit
- $112,586
- Equity at exit
- $21,615
Cash invested: $70,000 (down + closing). Projections, not guarantees.
Landlord ↔ Tenant lean methodology
- Overall (STATE)
- 87 Strongly Landlord-Friendly
- State Florida
- 87 Strongly Landlord-Friendly · R+3
- County
- — inherits STATE
- City
- — inherits STATE
ZIP-level market 32952
- Rents YoY
- 6.5%
- Active inventory
- 227
- Price-to-rent
- 7.3×
Monthly cashflow live
- Estimated rent
- $2,863 high interval (Pro) →
- Mortgage (P&I)
- −$1,311
- Tax from tax record
- −$107 /mo · $1,289/yr
- Insurance
- −$104
- Flood insurance flood zone
- −$66 /mo · $798/yr
- HOA
- −$0
- Vacancy / Maint / Mgmt
- −$601
- Net cashflow
- $672
Break-even live
UW: 25.0% down · 7.5% · 30yr · 1.5% tax · 5.0% vac · 8.0% maint · 8.0% mgmt
Financing live
Cash to close
- Down payment
- $62,500
- Closing costs
- $7,500
- Reserves months
- —
- Total cash needed
- —
Loan-product check · same deal, 3 products live
Conventional
25% down · 7.5% · 30yr
- Down + closing
- —
- Monthly P&I
- —
- Monthly cashflow
- —
- DSCR
- —
- Eligible?
- —
Personal DTI + credit; lowest rate.
DSCR
20% down · 8.5% · 30yr
- Down + closing
- —
- Monthly P&I
- —
- Monthly cashflow
- —
- DSCR
- —
- Eligible?
- —
No personal income docs; deal must DSCR.
Hard money
10% down · 12.0% · 12mo
- Down + closing
- —
- Monthly P&I
- —
- Monthly cashflow
- —
- DSCR
- —
- Eligible?
- —
Short-term bridge; refi at stabilization.
Rent comps 16 comps
| Address | Beds | Baths | Sqft | Rent | $/sqft | DOM | Units | Dist |
|---|---|---|---|---|---|---|---|---|
| 410 S Tropical Trl Merritt Island, FL | 3.0 | 2.0 | 1573 | $2,295 | $1.46 | 23d | 1 | 0.44mi |
| 140 McLeod St Unit 1513829P Merritt Island, FL | 3.0 | 2.0 | 1323 | $3,291 | $2.49 | 19d | 1 | 0.50mi |
| 735 Pilot Ln #503 Merritt Island, FL | 2.0 | 2.0 | 1334 | $2,700 | $2.02 | 23d | 1 | 0.72mi |
| 735 Pilot Ln #414 Merritt Island, FL | 3.0 | 3.5 | 1715 | $3,300 | $1.92 | 23d | 1 | 0.73mi |
| 735 Pilot Ln #1009 Merritt Island, FL | 2.0 | 2.0 | 1334 | $2,850 | $2.14 | 23d | 1 | 0.75mi |
| 735 Pilot Ln #507 Merritt Island, FL | 2.0 | 2.0 | 1711 | $2,800 | $1.64 | 14d | 1 | 0.75mi |
| 701 Pilot Ln Unit 1499904P Merritt Island, FL | 2.0 | 2.0 | 1323 | $3,978 | $3.01 | 21d | 1 | 0.76mi |
| 820 Del Rio Way #401 Merritt Island, FL | 3.0 | 2.0 | 1862 | $2,600 | $1.40 | 23d | 1 | 0.76mi |
| 200 S Sykes Creek Pkwy #702 Merritt Island, FL | 2.0 | 2.0 | 1307 | $2,390 | $1.83 | 23d | 1 | 0.81mi |
| 250 S Sykes Creek Pkwy Unit B510 Merritt Island, FL | 2.0 | 2.0 | 1660 | $2,600 | $1.57 | 23d | 1 | 0.83mi |
| 480 Sail Ln #204 Merritt Island, FL | 3.0 | 2.0 | 2122 | $2,950 | $1.39 | 14d | 1 | 0.85mi |
| 145 Needle Blvd Merritt Island, FL | 4.0 | 2.0 | 1314 | $3,250 | $2.47 | 23d | 1 | 0.86mi |
| 390 Needle Blvd Merritt Island, FL | 4.0 | 2.0 | 1828 | $3,450 | $1.89 | 23d | 1 | 0.91mi |
| 800 1st St Merritt Island, FL | 3.0 | 2.0 | 1529 | $2,800 | $1.83 | 23d | 1 | 1.22mi |
| 1276 Gary Dr Merritt Island, FL | 3.0 | 2.0 | 1248 | $2,200 | $1.76 | 23d | 1 | 1.30mi |
| 165 Tiki Dr Merritt Island, FL | 3.0 | 2.0 | 1795 | $2,875 | $1.60 | 23d | 1 | 1.40mi |
Listing history 2 events
-
2026-06-18remarks 693-char remark
-
2026-06-18$250,000 Active 1 DOM
ⓘ Source: listings_history table (triggers on properties + properties_extension) + one-shot
backfill from property_details.listing_events for pre-trigger history.
Tax reassessment forecast FL · Resets to sale price
- Current annual tax
- $1,289 · $107/mo
- Projected year-2 tax
- $2,075 · $173/mo
- Expected delta
- +$786/yr (+$66/mo · 61.0%)
ⓘ Screening estimate from a state-policy table — verify with the county assessor before closing.
Climate risk First Street
- Flood 7/10 Severe FEMA zone X (unshaded) · 75% chance over 30 yrs
- Wildfire 1/10 Low
- Heat 10/10 Extreme 7 d/yr ≥105°F today · 23 d/yr by 30 yrs out
- Wind 10/10 Extreme 99% chance of damaging wind over 30 yrs
- Air quality 1/10 Low 0 unhealthy d/yr today · 0 by 30 yrs out
Nearby sold comps map
Loading sold comps map…
Walkable amenities ~0.75 mi
Loading nearby amenities…
Taxation est. · year 1
- Rental income
- $34,352
- − Mortgage interest
- −$14,004
- − Property taxes
- −$1,289
- − Insurance
- −$2,048
- − Repairs & maintenance
- −$2,748
- − Management
- −$2,748
- − Depreciation
- −$7,273
- Taxable income
- $4,243
- Est. tax owed @ 24.0%
- −$1,018
- After-tax cash flow
- $7,051/yr
For passive investors: Depreciation is non-cash, so a rental often shows a tax loss while cash-flowing — sheltering income. Rental losses are passive: they offset passive income freely, and up to $25,000/yr can offset ordinary (W-2) income if you actively participate and your MAGI is under $100k (phasing out to $0 by $150k); unused losses carry forward. On sale, claimed depreciation is recaptured at up to 25%, and gains may owe capital-gains tax (a 1031 exchange can defer both). Figures are a year-1 estimate at your 24.0% rate — not tax advice; consult a CPA.
Schools (NCES district)
- District
- Brevard
- NCES district ID
- 1200150
- Math proficiency
- 53% ▼ -9.00%
- Reading proficiency
- 57% ▼ -4.00%
- Median HH income
- $49,426
- Composite
- 46.86/100
- National rank
- #2370
- State rank
- #19 of 73 in FL
Livability — Merritt Island
- Score
- 70/100
- State rank
- #441
- US rank
- #7878
Category grades
Schools grade is shown separately in the Schools card above.
Census & demographics
- Census place
- Merritt Island, FL
- County
- Brevard County · 602,871 people
- City population
- 46,372
- Metro
- Palm Bay-Melbourne-Titusville, FL
- Population (ZIP)
- 21,613
- Household income
- $102,726
- Rent vs Own
- Severe rent burden
- 199.0
Population outlook (Brevard County) Hauer SSP2
- Today (2025)
- 623,254 people
- By 2030
- 648,420 · +4.0%
- By 2040
- 690,009 · +10.7%
- By 2050
- 715,669 · +14.8%
- By 2075
- 775,744 · +24.5%
- By 2100
- 776,687 · +24.6%
Race, ethnicity, and origin ACS 2023
- Neighborhood character
- Predominantly White (85%)
- Race & ethnicity
- White 85% Hispanic / Latino 6% Two or more races 6% Asian 2% Black 2%
- Hispanic origin (detail)
- Puerto Rican 4% Cuban 1%
- Common ancestry
- Romanian 3% Slovak 2% Lithuanian 1%
- Foreign-born
- 5% · Canada, China
- Languages at home
- 92% English-only · Spanish 4% Other Indo-European 1%
Political lean MEDSL · Brevard
- 2024 margin
- Strong R (+20.8) · D 39.1% · R 59.9% · Other 1.0%
- 2008→2024 swing
- -10.4pp toward R · 2008: -10.4pp · 2024: -20.8pp
- All cycles
- 2024: R+20.8 2020: R+16.4 2016: R+19.8 2012: R+12.7 2008: R+10.4
Not yet ingested
- Civics
- —
Market trends
- HPI YoY
- ▼ -177.56%
- Current HPI
- 323.6021
- Rent YoY
- ▲ 6.53%
- Metro
- Palm Bay-Melbourne-Titusville, FL
- State GDP YoY
- ▲ 3.28%
- F500 in state
- 36
Industry mix (Fortune 500 HQ in FL)
| Industry | F500 HQs | Revenue |
|---|---|---|
| Industrial Technology | 2 | $29B |
|
||
| Insurance | 2 | $17B |
|
||
| Retail | 1 | $60B |
|
||
| Technology Distribution | 1 | $58B |
|
||
| Homebuilding | 1 | $35B |
|
||
| Technology Manufacturing | 1 | $35B |
|
||
Price history
1 event — show timeline
- 2026-06-18 Listed $250,000 Stellar MLS as Distributed by MLS Grid
Property tax history
+2.9%/yrLatest (2025): $1,289 · +13.5% YoY. Source: county tax records.
Cash-flow waterfall
monthlySold comps — $/sqft
last 12 mo · ≤1 miLoading sold comps…