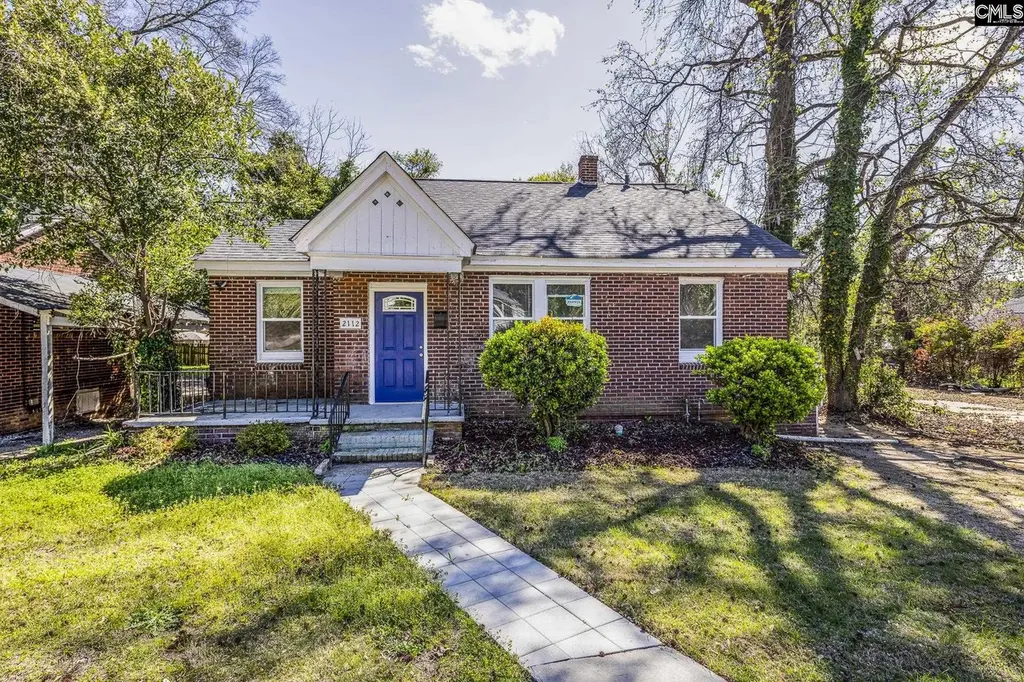
2112 Academy St · Columbia, SC
Flood risk 1/10 · Minimal
- FEMA flood zone
- X (unshaded)
- Chance of flooding over 30 yrs
- 0.0%
- Est. flood insurance / yr
- $507 – $1,088
Fire risk 1/10 · Minimal
- Est. fire insurance / yr
- $783 – $1,453
Heat risk 6/10 · Moderate
- Hot days now (above 108°F)
- 7 days/yr
- Hot days in 30 yrs
- 16 days/yr
Wind risk 6/10 · Moderate
- Chance of severe wind over 30 yrs
- 64.0%
Air-quality risk 3/10 · Minor
- Unhealthy air days now
- 2 days/yr
- Unhealthy air days in 30 yrs
- 2 days/yr
Risk factors via First Street. Map © Google.
Why this score? — see what drove the C- grade
The composite is a weighted blend of 9 inputs, each scored 0–100. Each bar is that input's sub-score; the figure is the points it added to the 100-point composite (weight × sub-score).
- Cash flow +20.1/30.0
- ARV discount +7.5/15.0
- DSCR +6.4/10.0
- 1% rule +4.4/10.0
- Livability +3.9/5.0
- Rent growth +3.1/5.0
- Schools +2.6/10.0
- Condition / age +2.5/5.0
- Appreciation +0.0/10.0
$124,000
🖨 Deal sheet 📄 Offer letter ✓ Due diligence
Listing remarks
Completely renovated and move-in ready, this charming all-brick bungalow is the perfect place to call home or a fantastic investment opportunity! Featuring 3 bedrooms, 1 bath, and just under 1,000 square feet, this home blends classic character with modern updates, including all new windows, a new roof, and new window units installed in 2025. Start your mornings on the inviting front porch, perfect for enjoying a cup of coffee. Inside, you’ll find a spacious living room with durable LVP flooring, abundant natural light, and a welcoming archway that leads into the beautifully updated eat-in kitchen. The kitchen shines with granite countertops, stainless steel appliances, ample cabinetr
Key facts
- Granite countertops
- All brick bungalow
- New roof
Tags
Property features AI
Exterior
- Parking: 3 parking spaces
- Utilities: Public water; Public sewer
- Home design: Single-story property
- Construction: Brick exterior above foundation; Crawlspace foundation
- Exterior features: Front porch (covered and uncovered areas); Rear chain-link fencing
Interior
- Kitchen: Eat-in kitchen with granite countertops and luxury vinyl plank flooring; Free-standing smooth-surface range; Dishwasher
- Bedrooms: Master bedroom on main level with private closet, ceiling fan, carpeted floors, tub/shower (shared bath); Second bedroom on main level with private closet, ceiling fan, carpeted floors, tub/shower (shared bath); Third bedroom on main level with ceiling fan and carpeted floors, tub/shower (shared bath)
- Flooring: Carpet in bedrooms; Luxury vinyl plank in living room and kitchen
- Bathrooms: One full bathroom (main)
- Heating & cooling: Central heating; Window air conditioning units
- Interior features: Ceiling fan in living areas and bedrooms; Living room with luxury vinyl plank flooring
- Laundry & utility: Main-level laundry in a closet
Neighborhood map
What this means for you Summary
Snapshot
- This is a 3-bed/1.0-bath single-family listed at $124k.
Deal economics
- At list price, monthly cash flow is $154 ($2k/yr) — positive.
- The deal already cash-flows at list — no discount required.
- To meet the 1% rule (rent ≥ 1% of price), the offer needs to be $117k (5.9% below list).
- Recommended offer: $117k (5.9% below list) — sets the bar for 1% rule.
- Cap rate 7.8% vs local median 5.0% in Columbia — top-decile yield for the area; either an underpriced asset or a hidden risk that comps aren't pricing in. Stress-test before assuming the spread holds.
Location & tenants
- Location reads 78/100 on livability (#18 in SC, #2,436 nationally) — a middle-class / working-renter tenant base. Strengths: amenities A+, commute A+, cost of living A+; Watch: employment D, crime F.
- Richland 01 (urban): math 26% / reading 36% proficiency, ranked #54 of 80 in SC (top 68%) — families likely to look elsewhere, expect single-tenant / working-renter base with shorter leases; 64% free/reduced lunch — lower-income household profile, screen leases tightly.
- Zoned schools: Watkins-Nance Elementary (math 17% / reading 27%, grade F, #475 of 597 statewide, top 81%, 383 students, 100% FRL); C. A. Johnson High (math 34% / reading 84%, grade C+, #110 of 196 statewide, top 58%, 364 students, 100% FRL) — zoned schools average 100% FRL vs 64% district-wide (36 pts higher); higher-poverty schools than district average — tighter screening recommended.
- Market conditions: Rents rising (+2.5%/yr); 238 active listings in the ZIP; 21 comparable units currently listed for rent nearby; rentals at typical pace (median 24d on market — plan ~3-4 weeks tenant-placement turnaround); 3,472 units permitted in Richland County in 2024 (1,096 in 5+ unit buildings).
- This rent runs 30% of the median local income ($46k/yr) — at the standard rent-burdened threshold; future hikes will face affordability resistance.
Forward outlook
- Local home prices are declining (-3.0%/yr); year-one equity from $857 of loan paydown is wiped out by about $4k of value loss. Plan a longer hold.
- Richland County population projected at +30% by 2050 — long-run rental-demand tailwind backs the buy-and-hold thesis.
Negotiation context
- It's been on market 59 days — a 3% lower offer ($120k) is reasonable based on typical stale-listing flexibility.
- 4 sale attempts with the ask held roughly flat each time — persistent listings suggest the price (not the market) is what's stuck; bring a comps-based counter.
- Current owner paid $58k; list at $124k implies a 114% gain — meaningful room to come down on a strong offer.
Risks & watch-outs
- Watch-outs: built in 1930 — expect roof / HVAC / electrical / plumbing capex.
- Climate carrying-cost: major wind risk, 64% chance of damaging wind over 30y; extreme-heat days projected 7→16/yr by 2055 (HVAC capex compounding) — expect insurance premiums to compound above CPI over the hold.
Questions for the listing agent
- It's been on market 59 days. Have you received any prior offers? Is the seller open to a 6% concession, seller financing, or rate buy-down credit?
- Built in 1930 — when were the roof, HVAC, electrical panel, plumbing, and water heater last replaced?
- Is there a deadline driving the sale (1031 exchange, divorce, estate, relocation)? That informs how much negotiation room exists.
- Schools are D-rated, which usually means shorter tenancies and higher turnover. Who's the typical renter profile here, and what's been the actual vacancy rate?
- Crime grade is F in this area — have there been break-ins, vandalism, or insurance claims at this property in the last 3 years? What carrier currently insures it and at what premium?
- What's the average days-on-market for RENTAL listings here right now (not sales)? A rising rental-DOM trend means longer vacancies and softer asking-rent achievability than the comps imply.
- What's the recent tenant-quality profile in this submarket — average credit score on applications, eviction rate, late-payment / NSF rate, and stable-employment percentage? A property-management company in the area should have these aggregated.
- How much new for-sale + rental construction is in the pipeline within 1–3 miles? Heavy new supply typically softens prices + rents 12–24 months out; constrained supply supports both.
Investment metrics
- 1% rule
- 0.94% ✗
- Cap rate
- 7.78%
- Cash-on-cash
- 5.31%
- DSCR
- 1.24
- GRM
- 8.9
CMA / ARV
No comps found within radius.
Projected returns pro-forma
-3.0% appreciation · 2.5% rent growth · sell at horizon
- IRR
- -8.6%
- Equity multiple
- 0.69×
- Total profit
- $-10,933
- Equity at exit
- $18,489
- IRR
- 0.2%
- Equity multiple
- 1.02×
- Total profit
- $551
- Equity at exit
- $10,721
Cash invested: $34,720 (down + closing). Projections, not guarantees.
Landlord ↔ Tenant lean methodology
- Overall (STATE)
- 90 Strongly Landlord-Friendly
- State South Carolina
- 90 Strongly Landlord-Friendly · R+6
- County
- — inherits STATE
- City
- — inherits STATE
ZIP-level market 29203
- Home prices YoY
- -31.6%
- Rents YoY
- 2.5%
- Active inventory
- 238
- Price-to-rent
- 8.9×
Monthly cashflow live
- Estimated rent
- $1,166 high interval (Pro) →
- Mortgage (P&I)
- −$650
- Tax from tax record
- −$66 /mo · $791/yr
- Insurance
- −$52
- HOA
- −$0
- Vacancy / Maint / Mgmt
- −$245
- Net cashflow
- $154
Break-even live
UW: 25.0% down · 7.5% · 30yr · 1.5% tax · 5.0% vac · 8.0% maint · 8.0% mgmt
Financing live
Cash to close
- Down payment
- $31,000
- Closing costs
- $3,720
- Reserves months
- —
- Total cash needed
- —
Loan-product check · same deal, 3 products live
Conventional
25% down · 7.5% · 30yr
- Down + closing
- —
- Monthly P&I
- —
- Monthly cashflow
- —
- DSCR
- —
- Eligible?
- —
Personal DTI + credit; lowest rate.
DSCR
20% down · 8.5% · 30yr
- Down + closing
- —
- Monthly P&I
- —
- Monthly cashflow
- —
- DSCR
- —
- Eligible?
- —
No personal income docs; deal must DSCR.
Hard money
10% down · 12.0% · 12mo
- Down + closing
- —
- Monthly P&I
- —
- Monthly cashflow
- —
- DSCR
- —
- Eligible?
- —
Short-term bridge; refi at stabilization.
Rent comps 21 comps
| Address | Beds | Baths | Sqft | Rent | $/sqft | DOM | Units | Dist |
|---|---|---|---|---|---|---|---|---|
| 2105 Grove St Columbia, SC | 2.0 | 1.0 | 800 | $850 | $1.06 | 23d | 1 | 0.06mi |
| 2710 Howell Ct Columbia, SC | 2.0 | 1.0 | 700 | $825 | $1.18 | 14d | 1 | 0.23mi |
| 2719 Howell Ct Columbia, SC | 2.0 | 1.0 | 675 | $850 | $1.26 | 11d | 1 | 0.25mi |
| 3415 Piedmont Ave Unit A Columbia, SC | 2.0 | 1.0 | 650 | $1,000 | $1.54 | 23d | 1 | 0.34mi |
| 3419 Piedmont Ave Columbia, SC | 3.0 | 1.0 | 1100 | $1,195 | $1.09 | 23d | 1 | 0.34mi |
| 3700 West Ave Columbia, SC | 1.0–2.0 | 1.0 | 750 | $850 | $1.13 | 14d | 1 | 0.36mi |
| 3540 White St Columbia, SC | 2.0 | 1.0 | 725 | $1,300 | $1.79 | 23d | 1 | 0.38mi |
| 3606 Medical Dr Unit B Columbia, SC | 2.0 | 1.5 | 864 | $1,100 | $1.27 | 23d | 1 | 0.54mi |
| 2308 Manse St Columbia, SC | 3.0 | 1.0 | 999 | $1,300 | $1.30 | 14d | 1 | 0.55mi |
| 1319 Hendrix St Columbia, SC | 2.0 | 1.0 | 900 | $1,050 | $1.17 | 23d | 1 | 0.77mi |
| 2225 Waites Rd Unit 2225A Columbia, SC | 2.0 | 1.0 | 714 | $1,100 | $1.54 | 23d | 1 | 0.84mi |
| 1612 Ogden St Columbia, SC | 2.0 | 1.0 | 680 | $1,100 | $1.62 | 14d | 2 | 0.97mi |
| 2511 Chestnut St Columbia, SC | 2.0 | 1.0 | 928 | $1,300 | $1.40 | 14d | 1 | 0.99mi |
| 2413 Laurel St Unit C Columbia, SC | 2.0 | 1.0 | 800 | $900 | $1.12 | 23d | 1 | 1.13mi |
| 2617 River Dr Columbia, SC | 2.0–3.0 | 1.0–2.0 | 1038 | $993 | $0.96 | 14d | 2 | 1.15mi |
| 3015 English Ave Columbia, SC | 2.0 | 1.0 | 981 | $1,250 | $1.27 | 11d | 1 | 1.18mi |
| 2508 Laurel St Unit B Columbia, SC | 2.0 | 1.0 | 750 | $950 | $1.27 | 23d | 1 | 1.19mi |
| 1930 Marion St Columbia, SC | 2.0 | 1.0 | 612 | $1,500 | $2.45 | 11d | 31 | 1.27mi |
| 4030 Gonzales Ave Columbia, SC | 2.0 | 2.0 | 840 | $1,375 | $1.64 | 23d | 1 | 1.27mi |
| 1003 Elmwood Ave Columbia, SC | 1.0–2.0 | 1.0–2.0 | 937 | $1,649 | $1.76 | 11d | 4 | 1.45mi |
| 1840 Hampton St Unit 1 Columbia, SC | 4.0 | 2.0 | 1056 | $1,795 | $1.70 | 23d | 1 | 1.49mi |
Listing history 24 events
-
2026-06-18days on market $124,000 Active 59 DOM
-
2026-06-17days on market $124,000 Active 58 DOM
-
2026-06-16days on market $124,000 Active 57 DOM
-
2026-06-15days on market $124,000 Active 56 DOM
-
2026-06-14days on market $124,000 Active 54 DOM
-
2026-06-10days on market $124,000 Active 51 DOM
-
2026-06-09days on market $124,000 Active 50 DOM
-
2026-06-08days on market $124,000 Active 49 DOM
-
2026-06-07days on market $124,000 Active 48 DOM
-
2026-06-03days on market $124,000 Active 44 DOM
-
2026-06-03days on market $124,000 Active 43 DOM
-
2026-06-01days on market $124,000 Active 42 DOM
-
2026-05-31days on market $124,000 Active 41 DOM
-
2026-05-19price $124,000
-
2026-04-20$130,000 Active
-
2026-03-20$130,000 Active
-
2025-04-02soldstatus $58,000
-
2025-03-07price $69,000
-
2025-03-06status Pending
-
2025-02-28status Active
-
2025-02-19status Pending
-
2025-02-15price $69,500
-
2025-02-06$75,000 Active
-
2025-01-27soldstatus $27,500
ⓘ Source: listings_history table (triggers on properties + properties_extension) + one-shot
backfill from property_details.listing_events for pre-trigger history.
Tax reassessment forecast SC · Resets to sale price
- Current annual tax
- $791 · $66/mo
- Projected year-2 tax
- $791 · $66/mo
- Expected delta
- $0/yr ($0/mo · 0.0%)
ⓘ Screening estimate from a state-policy table — verify with the county assessor before closing.
Climate risk First Street
- Flood 1/10 Low FEMA zone X (unshaded) · 0% chance over 30 yrs
- Wildfire 1/10 Low
- Heat 6/10 Major 7 d/yr ≥108°F today · 16 d/yr by 30 yrs out
- Wind 6/10 Major 64% chance of damaging wind over 30 yrs
- Air quality 3/10 Moderate 2 unhealthy d/yr today · 2 by 30 yrs out
Nearby sold comps map
Loading sold comps map…
Walkable amenities ~0.75 mi
Loading nearby amenities…
Taxation est. · year 1
- Rental income
- $13,996
- − Mortgage interest
- −$6,946
- − Property taxes
- −$791
- − Insurance
- −$620
- − Repairs & maintenance
- −$1,120
- − Management
- −$1,120
- − Depreciation
- −$3,607
- Taxable loss
- −$207
- Est. tax savings @ 24.0%
- +$50
- After-tax cash flow
- $1,893/yr
For passive investors: Depreciation is non-cash, so a rental often shows a tax loss while cash-flowing — sheltering income. Rental losses are passive: they offset passive income freely, and up to $25,000/yr can offset ordinary (W-2) income if you actively participate and your MAGI is under $100k (phasing out to $0 by $150k); unused losses carry forward. On sale, claimed depreciation is recaptured at up to 25%, and gains may owe capital-gains tax (a 1031 exchange can defer both). Figures are a year-1 estimate at your 24.0% rate — not tax advice; consult a CPA.
Schools (NCES district)
- District
- Richland 01
- NCES district ID
- 4503360
- Math proficiency
- 26% ▼ -7.00%
- Reading proficiency
- 36% ▼ -5.00%
- Median HH income
- $38,931
- Composite
- 25.94/100
- National rank
- #7335
- State rank
- #54 of 80 in SC
Livability — Columbia
- Score
- 78/100
- State rank
- #18
- US rank
- #2436
Category grades
Schools grade is shown separately in the Schools card above.
Census & demographics
- Census place
- Columbia, SC
- County
- Richland County · 389,530 people
- City population
- 335,994
- Metro
- Columbia, SC
- Population (ZIP)
- 40,653
- Household income
- $46,054
- Rent vs Own
- Severe rent burden
- 1980.0
Population outlook (Richland County) Hauer SSP2
- Today (2025)
- 459,667 people
- By 2030
- 487,524 · +6.1%
- By 2040
- 542,035 · +17.9%
- By 2050
- 595,371 · +29.5%
- By 2075
- 732,998 · +59.5%
- By 2100
- 820,415 · +78.5%
Race, ethnicity, and origin ACS 2023
- Neighborhood character
- Predominantly Black (80%)
- Race & ethnicity
- Black 80% White 13% Hispanic / Latino 5% Two or more races 2%
- Common ancestry
- Serbian 1%
- Foreign-born
- 3% · Canada
- Languages at home
- 93% English-only · Spanish 5%
Political lean MEDSL · Richland
- 2024 margin
- Solid D (+34.6) · D 66.4% · R 31.8% · Other 1.8%
- 2008→2024 swing
- +5.7pp toward D · 2008: 28.9pp · 2024: 34.6pp
- All cycles
- 2024: D+34.6 2020: D+38.3 2016: D+32.9 2012: D+33.3 2008: D+28.9
Not yet ingested
- Civics
- —
Market trends
- HPI YoY
- ▼ -77.52%
- Current HPI
- 168.2114
- Rent YoY
- ▲ 2.50%
- Metro
- Columbia, SC
- State GDP YoY
- ▲ 4.51%
- F500 in state
- 2
Industry mix (Fortune 500 HQ in SC)
| Industry | F500 HQs | Revenue |
|---|---|---|
| Packaging | 1 | $7B |
|
||
Price history
+350.9% since first listed11 events — show timeline
- 2026-05-19 Price Changed $124,000 Consolidated MLS
- 2026-04-20 Listed $130,000 Consolidated MLS
- 2026-03-20 Listed $130,000 Consolidated MLS
- 2025-04-02 Sold (Public Records) $58,000 Public Records
- 2025-03-07 Price Changed $69,000 Consolidated MLS
- 2025-03-06 Pending — Consolidated MLS
- 2025-02-28 Relisted — Consolidated MLS
- 2025-02-19 Pending — Consolidated MLS
- 2025-02-15 Price Changed $69,500 Consolidated MLS
- 2025-02-06 Listed $75,000 Consolidated MLS
- 2025-01-27 Sold (Public Records) $27,500 Public Records
Property tax history
-1.8%/yrLatest (2025): $791 · +2.1% YoY. Source: county tax records.
Cash-flow waterfall
monthlySold comps — $/sqft
last 12 mo · ≤1 miLoading sold comps…