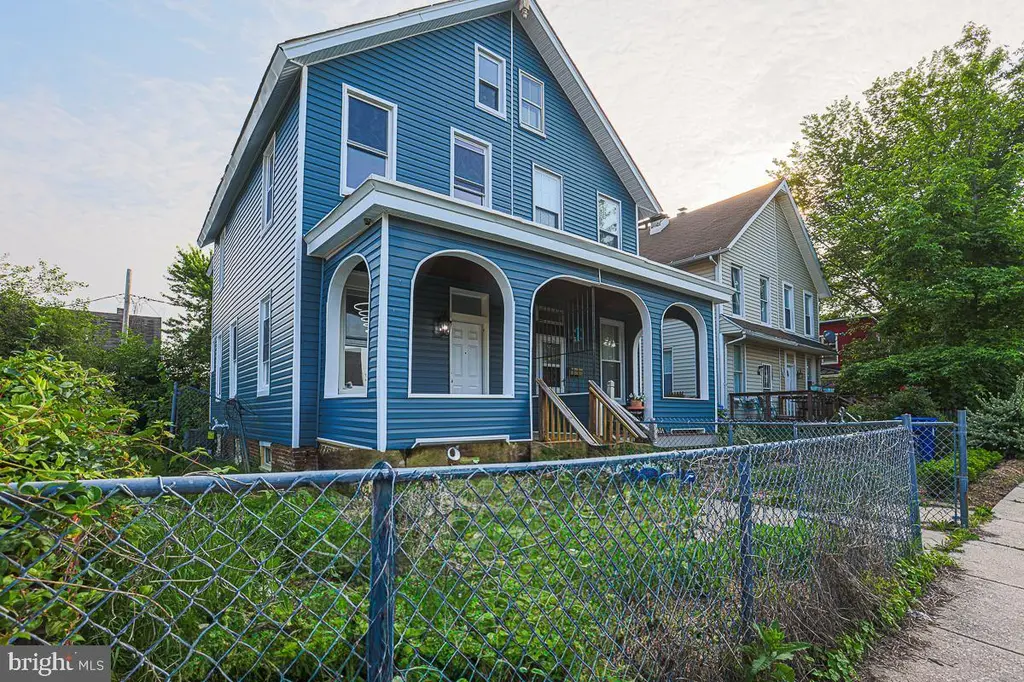
604 E 31st St · Baltimore, MD
Flood risk 1/10 · Minimal
- FEMA flood zone
- X (unshaded)
- Chance of flooding over 30 yrs
- 0.0%
- Est. flood insurance / yr
- $473 – $860
Fire risk 1/10 · Minimal
- Est. fire insurance / yr
- $755 – $1,403
Heat risk 7/10 · Major
- Hot days now (above 103°F)
- 7 days/yr
- Hot days in 30 yrs
- 15 days/yr
Wind risk 6/10 · Moderate
- Chance of severe wind over 30 yrs
- 27.0%
Air-quality risk 4/10 · Minor
- Unhealthy air days now
- 6 days/yr
- Unhealthy air days in 30 yrs
- 7 days/yr
Risk factors via First Street. Map © Google.
Why this score? — see what drove the B- grade
The composite is a weighted blend of 9 inputs, each scored 0–100. Each bar is that input's sub-score; the figure is the points it added to the 100-point composite (weight × sub-score).
- Cash flow +28.6/30.0
- ARV discount +12.0/15.0
- DSCR +10.0/10.0
- 1% rule +7.4/10.0
- Livability +3.8/5.0
- Rent growth +2.9/5.0
- Condition / age +2.5/5.0
- Schools +1.0/10.0
- Appreciation +0.0/10.0
$215,000
🖨 Deal sheet (PDF) 📄 Offer letter ✓ Due diligence
Listing remarks MLS
Location Location Location! 5 rooms and 2 bathrooms Fully renovated including New Roof. Upper level has an additional approx 350 SF finished sq ft not included in the tax record. Attractive location. Quiet dead-end street Excellent neighbors. Close to everything you need. All offers are welcome!
Key facts
- Fully renovated
- New roof
- Attractive location
Tags
Neighborhood map
What this means for you Summary
Snapshot
- This is a 5-bed/2.0-bath townhouse listed at $215k.
Deal economics
- At list price, monthly cash flow is $709 ($9k/yr) — positive.
- The deal already cash-flows at list — no discount required.
- Meets the 1% rule at list price ($3k rent vs $215k).
- Recommended offer: $189k (12.0% below list) — sets the bar for market timing.
- Cap rate 10.3% vs local median 6.0% in Baltimore — top-decile yield for the area; either an underpriced asset or a hidden risk that comps aren't pricing in. Stress-test before assuming the spread holds.
Location & tenants
- Location reads 76/100 on livability (#90 in MD, #3,396 nationally) — a middle-class / working-renter tenant base. Strengths: amenities A+, commute A+, housing A+; Watch: schools D, crime F.
- Baltimore City Public Schools (urban): math 7% / reading 16% proficiency, ranked #24 of 24 in MD (top 100%) — low school quality limits family demand, transient renter base, plan for 1-2y turnover; 79% free/reduced lunch — lower-income household profile, screen leases tightly.
- Market conditions: Rents rising (+1.6%/yr); 325 active listings in the ZIP; 20 comparable units currently listed for rent nearby; rentals at typical pace (median 25d on market — plan ~3-4 weeks tenant-placement turnaround); 1,273 units permitted in Baltimore city in 2024 (1,104 in 5+ unit buildings).
- At $2,667/mo this rent would consume 51% of the median local household income ($62k/yr) (locally 2564% of renters already pay >50% of income on rent) — very limited rent-growth headroom before tenants either downsize or default.
Forward outlook
- Local home prices are declining (-3.0%/yr); year-one equity from $1k of loan paydown is wiped out by about $6k of value loss. Plan a longer hold.
- Baltimore County population projected to shrink 4% by 2050 — rents likely to lag national; underwrite the cash flow, not the appreciation.
- At projected returns (-3.0% appreciation + 1.6% rent growth), your $60k cash investment doubles in ~10 years — after that, you're playing with house money.
Negotiation context
- It's been on market 155 days — a 12% lower offer ($189k) is reasonable based on typical stale-listing flexibility.
- 4 sale attempts since 31y ago with the ask held roughly flat each time — persistent listings suggest the price (not the market) is what's stuck; bring a comps-based counter.
- Current owner paid $62k; list at $215k implies a 247% gain — meaningful room to come down on a strong offer.
Risks & watch-outs
- Watch-outs: built in 1920 — expect roof / HVAC / electrical / plumbing capex.
- Climate carrying-cost: major wind risk, 27% chance of damaging wind over 30y; extreme-heat days projected 7→15/yr by 2055 (HVAC capex compounding) — expect insurance premiums to compound above CPI over the hold.
Questions for the listing agent
- It's been on market 155 days. Have you received any prior offers? Is the seller open to a 12% concession, seller financing, or rate buy-down credit?
- Built in 1920 — when were the roof, HVAC, electrical panel, plumbing, and water heater last replaced?
- Why hasn't it sold? Are there any deal-killer items the seller is aware of (foundation, flood, title, zoning, code violations)?
- Is there a deadline driving the sale (1031 exchange, divorce, estate, relocation)? That informs how much negotiation room exists.
- Schools are D-rated, which usually means shorter tenancies and higher turnover. Who's the typical renter profile here, and what's been the actual vacancy rate?
- Crime grade is F in this area — have there been break-ins, vandalism, or insurance claims at this property in the last 3 years? What carrier currently insures it and at what premium?
- What's the average days-on-market for RENTAL listings here right now (not sales)? A rising rental-DOM trend means longer vacancies and softer asking-rent achievability than the comps imply.
- What's the recent tenant-quality profile in this submarket — average credit score on applications, eviction rate, late-payment / NSF rate, and stable-employment percentage? A property-management company in the area should have these aggregated.
- How much new for-sale + rental construction is in the pipeline within 1–3 miles? Heavy new supply typically softens prices + rents 12–24 months out; constrained supply supports both.
Investment metrics
- 1% rule
- 1.24% ✓
- Cap rate
- 10.25%
- Cash-on-cash
- 14.14%
- DSCR
- 1.63
- GRM
- 6.7
CMA / ARV
- ARV (median comp)
- $238,859
- List price
- $215,000
- Delta
- -9.99%
- Verdict
- FAIR
- Comps
- 20 within 1.0 mi
Show comp detail 12 sales within ~0.75 mi
| Address | Dist | Beds/Ba | Sqft | Sold | Price | $/sf | Match |
|---|---|---|---|---|---|---|---|
| 1004 E 36th St | 0.52mi | 5/2.5 | 1,550 (-5%) | 7mo | $370,000 | $239 | 60 |
| 912 E 36th St | 0.50mi | 4/2.0 (-1) | 1,716 (+6%) | 7mo | $335,000 | $195 | 56 |
| 305 Whitridge Ave | 0.38mi | 4/2.5 (-1) | 1,694 (+4%) | 14mo | $220,000 | $130 | 56 |
| 312 E 25th St | 0.58mi | 4/2.0 (-1) | 1,560 (-4%) | 12mo | $160,000 | $103 | 52 |
| 3314 Ellerslie Ave | 0.35mi | 4/3.5 (-1) | 1,440 (-11%) | 6mo | $339,000 | $235 | 49 |
| 324 E University Pkwy | 0.29mi | 4/2.5 (-1) | 1,809 (+11%) | 14mo | $380,000 | $210 | 49 |
| 761 E 36th St | 0.47mi | 4/2.5 (-1) | 1,765 (+9%) | 13mo | $148,000 | $84 | 46 |
| 711 Venable Ave | 0.27mi | 4/2.0 (-1) | 1,386 (-15%) | 15mo | $255,000 | $184 | 45 |
| 3938 Frisby St | 0.75mi | 4/2.0 (-1) | 1,710 (+5%) | 10mo | $257,000 | $150 | 43 |
| 100 W 27th St | 0.66mi | 4/3.0 (-1) | 1,540 (-5%) | 13mo | $369,900 | $240 | 41 |
| 3812 Kimble Rd | 0.70mi | 4/2.0 (-1) | 1,800 (+11%) | 12mo | $269,900 | $150 | 34 |
| 2430 Barclay St | 0.63mi | 4/3.0 (-1) | 1,800 (+11%) | 15mo | $240,000 | $133 | 31 |
Match score weights: distance 35% · size 25% · config 20% · recency 20%. Top-matched comps best support the ARV.
Projected returns pro-forma
-3.0% appreciation · 1.63% rent growth · sell at horizon
- IRR
- 2.9%
- Equity multiple
- 1.11×
- Total profit
- $6,706
- Equity at exit
- $32,057
- IRR
- 11.2%
- Equity multiple
- 1.82×
- Total profit
- $49,489
- Equity at exit
- $18,589
Cash invested: $60,200 (down + closing). Projections, not guarantees.
Landlord ↔ Tenant lean methodology
- Overall (CITY)
- 12 Strongly Tenant-Friendly
- State Maryland
- 27 Tenant-Leaning · D+14
- County
- — inherits STATE
- City Baltimore
- 12 Strongly Tenant-Friendly · D+58
ZIP-level market 21218
- Rents YoY
- 1.6%
- Active inventory
- 325
- Price-to-rent
- 6.7×
Monthly cashflow live
- Estimated rent
- $2,667 high interval (Pro) →
- Mortgage (P&I)
- −$1,127
- Tax from tax record
- −$180 /mo · $2,166/yr
- Insurance
- −$90
- HOA
- −$0
- Vacancy / Maint / Mgmt
- −$560
- Net cashflow
- $709
Break-even live
Sensitivity live
| Price | -10% $831 | -5% $770 | +0% $709 | +5% $649 | +10% $588 |
|---|---|---|---|---|---|
| Rent | -10% $499 | -5% $604 | +0% $709 | +5% $815 | +10% $920 |
| Rate | -1.0pp $818 | -0.5pp $764 | base $709 | +0.5pp $654 | +1.0pp $597 |
UW: 25.0% down · 7.5% · 30yr · 1.5% tax · 5.0% vac · 8.0% maint · 8.0% mgmt
Financing live
Cash to close
- Down payment
- $53,750
- Closing costs
- $6,450
- Reserves months
- —
- Total cash needed
- —
Loan-product check · same deal, 3 products live
Conventional
25% down · 7.5% · 30yr
- Down + closing
- —
- Monthly P&I
- —
- Monthly cashflow
- —
- DSCR
- —
- Eligible?
- —
Personal DTI + credit; lowest rate.
DSCR
20% down · 8.5% · 30yr
- Down + closing
- —
- Monthly P&I
- —
- Monthly cashflow
- —
- DSCR
- —
- Eligible?
- —
No personal income docs; deal must DSCR.
Hard money
10% down · 12.0% · 12mo
- Down + closing
- —
- Monthly P&I
- —
- Monthly cashflow
- —
- DSCR
- —
- Eligible?
- —
Short-term bridge; refi at stabilization.
Rent comps 20 comps
| Address | Beds | Baths | Sqft | Rent | $/sqft | DOM | Units | Dist |
|---|---|---|---|---|---|---|---|---|
| 348 E University Pkwy Baltimore, MD | 4.0 | 2.0 | 1809 | $2,400 | $1.33 | 44d | 1 | 0.24mi |
| 3010 Guilford Ave Baltimore, MD | 5.0 | 2.5 | 2174 | $3,980 | $1.83 | 11d | 1 | 0.26mi |
| 420 E 28th St Unit 1 Baltimore, MD | 5.0 | 2.5 | 1600 | $2,600 | $1.62 | 5d | 1 | 0.26mi |
| 3222 Ellerslie Ave Baltimore, MD | 4.0 | 1.5 | 1550 | $1,950 | $1.26 | 44d | 1 | 0.30mi |
| 3421 University Pl Baltimore, MD | 5.0 | 2.0 | 1960 | $3,500 | $1.79 | 24d | 1 | 0.33mi |
| 312 E 25th St Baltimore, MD | 4.0 | 3.5 | 1960 | $2,800 | $1.43 | 44d | 1 | 0.57mi |
| 2641 N Howard St Baltimore, MD | 4.0 | 3.5 | 1344 | $2,800 | $2.08 | 24d | 1 | 0.70mi |
| 7 W 24th St Unit 1 Baltimore, MD | 5.0 | 2.5 | 1443 | $2,395 | $1.66 | 21d | 1 | 0.81mi |
| 305 W 31st St Baltimore, MD | 4.0 | 2.0 | 1500 | $2,499 | $1.67 | 44d | 1 | 0.82mi |
| 513 E 41st St Baltimore, MD | 4.0 | 1.5 | 1620 | $1,900 | $1.17 | 44d | 1 | 0.92mi |
| 719 E 20th St Baltimore, MD | 5.0 | 3.0 | 2060 | $2,400 | $1.17 | 2d | 1 | 0.94mi |
| 719 E 20th St Baltimore, MD | 5.0 | 3.5 | 2060 | $3,000 | $1.46 | 24d | 1 | 0.94mi |
| 1333 E North Ave Baltimore, MD | 4.0 | 2.5 | 1860 | $2,200 | $1.18 | 24d | 1 | 1.10mi |
| 3348 Chestnut Ave Baltimore, MD | 4.0 | 3.5 | 1702 | $3,200 | $1.88 | 24d | 1 | 1.11mi |
| 706 E 43rd St Baltimore, MD | 4.0 | 1.5 | 1596 | $1,899 | $1.19 | 2d | 1 | 1.12mi |
| 2045 E 31st St Baltimore, MD | 5.0 | 3.0 | 2200 | $895 | $0.41 | 24d | 1 | 1.22mi |
| 1511 E Lafayette Ave Baltimore, MD | 4.0 | 3.5 | 1988 | $2,650 | $1.33 | 5d | 1 | 1.24mi |
| 531 Willow Ave Unit Na Baltimore, MD | 4.0 | 1.0 | 1300 | $1,800 | $1.38 | 21d | 1 | 1.29mi |
| 1814 E Lafayette Ave Baltimore, MD | 4.0 | 2.0 | 1200 | $1,995 | $1.66 | 24d | 1 | 1.37mi |
| 1617 Argonne Dr Baltimore, MD | 4.0 | 2.0 | 1200 | $2,550 | $2.12 | 44d | 1 | 1.38mi |
Listing history 24 events
-
2026-06-18days on market $215,000 Active 155 DOM
-
2026-06-17days on market $215,000 Active 154 DOM
-
2026-06-16days on market $215,000 Active 153 DOM
-
2026-06-15days on market $215,000 Active 152 DOM
-
2026-06-13days on market $215,000 Active 150 DOM
-
2026-06-09days on market $215,000 Active 146 DOM
-
2026-06-08days on market $215,000 Active 145 DOM
-
2026-06-07days on market $215,000 Active 144 DOM
-
2026-06-04days on market $215,000 Active 141 DOM
-
2026-06-03days on market $215,000 Active 140 DOM
-
2026-06-02days on market $215,000 Active 139 DOM
-
2026-06-01days on market $215,000 Active 138 DOM
-
2026-05-31days on market $215,000 Active 137 DOM
-
2026-01-14$215,000 Active 296-char remark
Show marketing remark (296 chars)
Location Location Location! 5 rooms and 2 bathrooms Fully renovated including New Roof. Upper level has an additional approx 350 SF finished sq ft not included in the tax record. Attractive location. Quiet dead-end street Excellent neighbors. Close to everything you need. All offers are welcome!
-
2026-01-14historical
Show marketing remark (296 chars)
Location Location Location! 5 rooms and 2 bathrooms Fully renovated including New Roof. Upper level has an additional approx 350 SF finished sq ft not included in the tax record. Attractive location. Quiet dead-end street Excellent neighbors. Close to everything you need. All offers are welcome!
-
2026-01-12status Active
-
2025-12-27historical Active Under Contract
-
2025-11-14price $215,000
-
2025-10-29$219,000 Active
-
2024-01-31soldstatus $62,000
-
1995-08-25soldstatus $40,000
-
1995-07-14soldstatus $40,000
-
1995-05-10historical
-
1995-04-11$40,000
ⓘ Source: listings_history table (triggers on properties + properties_extension) + one-shot
backfill from property_details.listing_events for pre-trigger history.
Tax reassessment forecast MD · Partial reset (capped growth)
- Current annual tax
- $2,166 · $180/mo
- Projected year-2 tax
- $2,255 · $188/mo
- Expected delta
- +$89/yr (+$7/mo · 4.1%)
ⓘ Screening estimate from a state-policy table — verify with the county assessor before closing.
Climate risk First Street
- Flood 1/10 Low FEMA zone X (unshaded) · 0% chance over 30 yrs
- Wildfire 1/10 Low
- Heat 7/10 Severe 7 d/yr ≥103°F today · 15 d/yr by 30 yrs out
- Wind 6/10 Major 27% chance of damaging wind over 30 yrs
- Air quality 4/10 Moderate 6 unhealthy d/yr today · 7 by 30 yrs out
Nearby sold comps map
Loading sold comps map…
Walkable amenities ~0.75 mi
Loading nearby amenities…
Taxation est. · year 1
- Rental income
- $32,005
- − Mortgage interest
- −$12,043
- − Property taxes
- −$2,166
- − Insurance
- −$1,075
- − Repairs & maintenance
- −$2,560
- − Management
- −$2,560
- − Depreciation
- −$6,255
- Taxable income
- $5,346
- Est. tax owed @ 24.0%
- −$1,283
- After-tax cash flow
- $7,231/yr
For passive investors: Depreciation is non-cash, so a rental often shows a tax loss while cash-flowing — sheltering income. Rental losses are passive: they offset passive income freely, and up to $25,000/yr can offset ordinary (W-2) income if you actively participate and your MAGI is under $100k (phasing out to $0 by $150k); unused losses carry forward. On sale, claimed depreciation is recaptured at up to 25%, and gains may owe capital-gains tax (a 1031 exchange can defer both). Figures are a year-1 estimate at your 24.0% rate — not tax advice; consult a CPA.
Schools (NCES district)
- District
- Baltimore City Public Schools
- NCES district ID
- 2400090
- Math proficiency
- 7% ▼ -9.00%
- Reading proficiency
- 16% ▼ -5.00%
- Median HH income
- $42,108
- Composite
- 10.08/100
- National rank
- #9805
- State rank
- #24 of 24 in MD
Livability — Baltimore
- Score
- 76/100
- State rank
- #90
- US rank
- #3396
Category grades
Schools grade is shown separately in the Schools card above.
Census & demographics
- Census place
- Baltimore, MD
- County
- Baltimore City · 558,601 people
- City population
- 588,727
- Metro
- Baltimore-Columbia-Towson, MD
- Population (ZIP)
- 44,014
- Household income
- $62,488
- Rent vs Own
- Severe rent burden
- 2564.0
Population outlook (Baltimore County) Hauer SSP2
- Today (2025)
- 624,249 people
- By 2030
- 621,541 · -0.4%
- By 2040
- 609,756 · -2.3%
- By 2050
- 597,249 · -4.3%
- By 2075
- 552,236 · -11.5%
- By 2100
- 513,934 · -17.7%
Race, ethnicity, and origin ACS 2023
- Neighborhood character
- Diverse neighborhood (Simpson 0.58)
- Race & ethnicity
- Black 60% White 26% Two or more races 6% Hispanic / Latino 5% Asian 5%
- Hispanic origin (detail)
- Common ancestry
- Romanian 2% Italian 1% Scotch-Irish 1%
- Foreign-born
- 10% · Canada, China, South Korea
- Languages at home
- 87% English-only · Spanish 4% French/Haitian/Cajun 2% Chinese 2%
Political lean MEDSL · Baltimore
- 2024 margin
- Solid D (+73.0) · D 85.2% · R 12.2% · Other 2.6%
- 2008→2024 swing
- -2.5pp toward R · 2008: 75.5pp · 2024: 73.0pp
- All cycles
- 2024: D+73.0 2020: D+76.6 2016: D+74.6 2012: D+76.4 2008: D+75.5
Not yet ingested
- Civics
- —
Market trends
- HPI YoY
- ▼ -463.14%
- Current HPI
- 292.3986
- Rent YoY
- ▲ 1.63%
- Metro
- Baltimore-Columbia-Towson, MD
- State GDP YoY
- ▲ 2.97%
- F500 in state
- 12
Industry mix (Fortune 500 HQ in MD)
| Industry | F500 HQs | Revenue |
|---|---|---|
| Aerospace / Defense | 1 | $71B |
|
||
| Utilities | 1 | $25B |
|
||
| Hotels | 1 | $24B |
|
||
| Consumer Goods | 1 | $7B |
|
||
| Real Estate | 1 | $6B |
|
||
| Chemicals | 1 | $2B |
|
||
Price history
+437.5% since first listed11 events — show timeline
- 2026-01-14 Listing Removed — BRIGHT MLS
- 2026-01-14 Listed $215,000 BRIGHT MLS
- 2026-01-12 Relisted — BRIGHT MLS
- 2025-12-27 Contingent — BRIGHT MLS
- 2025-11-14 Price Changed $215,000 BRIGHT MLS
- 2025-10-29 Listed $219,000 BRIGHT MLS
- 2024-01-31 Sold (Public Records) $62,000 Public Records
- 1995-08-25 Sold (Public Records) $40,000 Public Records
- 1995-07-14 Sold (MLS) $40,000 MRIS
- 1995-05-10 Delisted — MRIS
- 1995-04-11 Listed $40,000 MRIS
Property tax history
+2.2%/yrLatest (2025): $2,166 · +6.3% YoY. Source: county tax records.
Cash-flow waterfall
monthlySold comps — $/sqft
last 12 mo · ≤1 miLoading sold comps…