607 Waterwood Dr · Hanahan, SC
Flood risk 1/10 · Minimal
- FEMA flood zone
- X (unshaded)
- Chance of flooding over 30 yrs
- 0.0%
- Est. flood insurance / yr
- $507 – $1,088
Fire risk 3/10 · Minor
- Est. fire insurance / yr
- $783 – $1,453
Heat risk 9/10 · Severe
- Hot days now (above 106°F)
- 7 days/yr
- Hot days in 30 yrs
- 17 days/yr
Wind risk 8/10 · Major
- Chance of severe wind over 30 yrs
- 99.0%
Air-quality risk 2/10 · Minimal
- Unhealthy air days now
- 2 days/yr
- Unhealthy air days in 30 yrs
- 2 days/yr
Risk factors via First Street. Map © Google.
Why this score? — see what drove the D- grade
The composite is a weighted blend of 9 inputs, each scored 0–100. Each bar is that input's sub-score; the figure is the points it added to the 100-point composite (weight × sub-score).
- Cash flow +10.1/30.0
- ARV discount +7.5/15.0
- 1% rule +5.0/10.0
- Rent growth +3.6/5.0
- Schools +3.6/10.0
- Livability +3.6/5.0
- DSCR +2.9/10.0
- Condition / age +2.5/5.0
- Appreciation +0.0/10.0
$169,000
🖨 Deal sheet (PDF) 📄 Offer letter ✓ Due diligence
Listing remarks
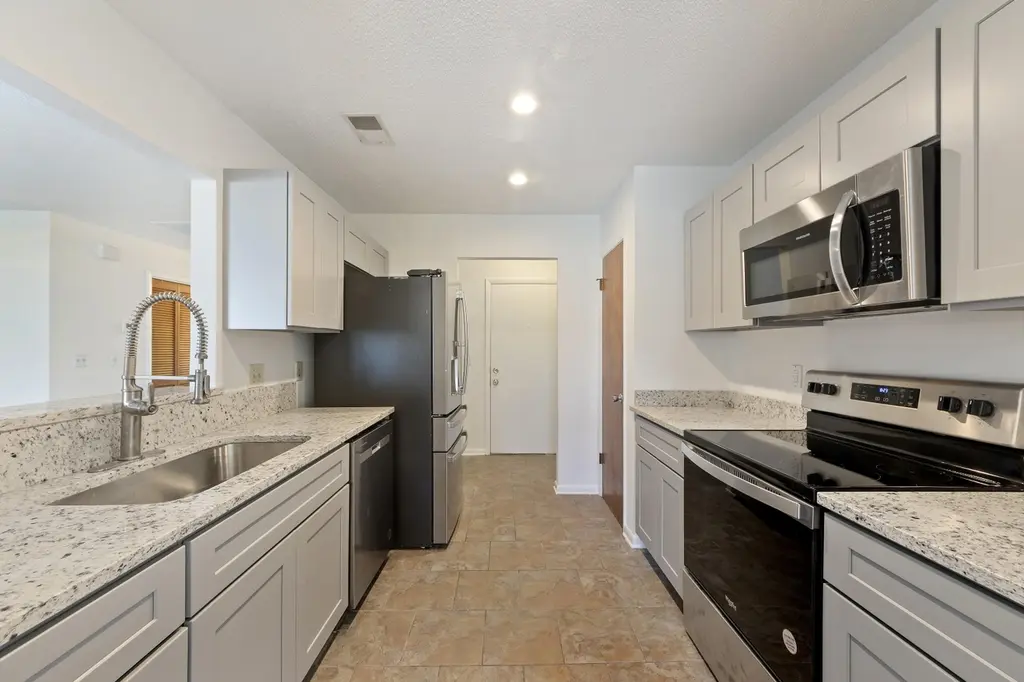
This beautifully updated second-floor condo offers an increasingly rare opportunity for truly low-maintenance, affordable living. Ideally located near the Navy base, the home is completely move-in ready following a recent full renovation by the owner. Updates include brand-new kitchen cabinetry, granite countertops, all-new appliances, and fresh paint throughout, creating a clean and modern feel from the moment you walk in. Hurry up and book your showing today--this one won't last!
Key facts
- Fresh paint
- Second-floor condo
- Full renovation
Tags
Property features AI
Finance
- HOA & community: Monthly association fee
Exterior
- Parking: Off-street parking
- Utilities: Public sewer
- Home design: Single-family attached condominium; One level
- Construction: Asphalt roof; Condominium structure
- Exterior features: Level lot; Community pool
Interior
- Kitchen: Electric range; Pantry
- Bedrooms: 2 bedrooms; Primary bedroom has ceiling fan, garden tub/shower, outside access, and walk-in closet
- Flooring: Luxury vinyl flooring
- Bathrooms: 2 bathrooms
- Heating & cooling: Central heating (electric); Central air conditioning; Wood-burning fireplace in living room (one)
- Interior features: Blown ceiling insulation; Walk-in closets; Family room; Pantry; Separate dining area; Utility room
- Laundry & utility: Washer hookup; Electric dryer hookup; Utility room
Neighborhood map
What this means for you Summary
Snapshot
- This is a 2-bed/2.0-bath condo listed at $169k.
Deal economics
- At list price, monthly cash flow is $-98 ($-1k/yr) — negative.
- The deal already cash-flows at list — no discount required.
- To meet the 1% rule (rent ≥ 1% of price), the offer needs to be $168k (0.4% below list).
- Recommended offer: $159k (6.0% below list) — sets the bar for market timing.
- Cap rate 5.6% vs local median 3.6% in Hanahan — top-decile yield for the area; either an underpriced asset or a hidden risk that comps aren't pricing in. Stress-test before assuming the spread holds.
Location & tenants
- Location reads 72/100 on livability (#45 in SC) — a middle-class / working-renter tenant base. Strengths: housing A+, employment A-, health & safety A-; Watch: amenities F, commute F.
- Berkeley 01 (suburban): math 35% / reading 48% proficiency, ranked #30 of 80 in SC (top 38%) — families likely to look elsewhere, expect single-tenant / working-renter base with shorter leases.
- Zoned schools: Bowen'S Corner Elementary (math 52% / reading 53%, grade C-, #143 of 597 statewide, top 24%, 779 students, 27% FRL); Sedgefield Middle (math 13% / reading 26%, grade F, #182 of 229 statewide, top 80%, 986 students, 100% FRL); Goose Creek High (math 33% / reading 68%, grade D+, #150 of 196 statewide, top 76%, 1,981 students, 52% FRL).
- Market conditions: Rents rising fast (+4.5%/yr); 264 active listings in the ZIP; 8 comparable units currently listed for rent nearby; rentals at typical pace (median 25d on market — plan ~3-4 weeks tenant-placement turnaround); solid renter incomes; 3,183 units permitted in Berkeley County in 2024 (580 in 5+ unit buildings).
Forward outlook
- Local home prices are declining (-3.0%/yr); year-one equity from $1k of loan paydown is wiped out by about $5k of value loss. Plan a longer hold.
- Berkeley County population projected at +48% by 2050 — long-run rental-demand tailwind backs the buy-and-hold thesis.
Negotiation context
- It's been on market 66 days — a 6% lower offer ($159k) is reasonable based on typical stale-listing flexibility.
- 12 sale attempts since 18y ago with the ask held roughly flat each time — persistent listings suggest the price (not the market) is what's stuck; bring a comps-based counter.
- Current owner paid $66k; list at $169k implies a 154% gain — meaningful room to come down on a strong offer.
Risks & watch-outs
- Climate carrying-cost: severe wind risk, 99% chance of damaging wind over 30y; extreme-heat days projected 7→17/yr by 2055 (HVAC capex compounding) — expect insurance premiums to compound above CPI over the hold.
Questions for the listing agent
- What do current leases actually rent for vs. the listed asking? Can we see a recent rent roll and the last 12 months of T-12 income?
- It's been on market 66 days. Have you received any prior offers? Is the seller open to a 6% concession, seller financing, or rate buy-down credit?
- What does the HOA fee cover, when was the last increase, and are there any pending special assessments or reserve-fund shortfalls?
- Any open or pending special assessments — roof, HVAC, plumbing, elevator, façade? What's the per-unit balance and payoff schedule, and is the seller paying it off at close or rolling it to the buyer?
- Why hasn't it sold? Are there any deal-killer items the seller is aware of (foundation, flood, title, zoning, code violations)?
- Is there a deadline driving the sale (1031 exchange, divorce, estate, relocation)? That informs how much negotiation room exists.
- The area grade is low — what's the realistic commute time and amenity access for the typical tenant pool here? Any planned neighborhood developments (good or bad) we should know about?
- What's the average days-on-market for RENTAL listings here right now (not sales)? A rising rental-DOM trend means longer vacancies and softer asking-rent achievability than the comps imply.
- What's the recent tenant-quality profile in this submarket — average credit score on applications, eviction rate, late-payment / NSF rate, and stable-employment percentage? A property-management company in the area should have these aggregated.
- How much new apartment / multifamily construction is in the pipeline within 1–3 miles? Heavy new supply (>2% of stock underway) typically softens rents 12–24 months out; light construction supports rent growth.
Investment metrics
- 1% rule
- 1.00% ✗
- Cap rate
- 5.59%
- Cash-on-cash
- -2.49%
- DSCR
- 0.89
- GRM
- 8.4
CMA / ARV
No comps found within radius.
Projected returns pro-forma
-3.0% appreciation · 4.52% rent growth · sell at horizon
- IRR
- -18.2%
- Equity multiple
- 0.35×
- Total profit
- $-30,849
- Equity at exit
- $25,198
- IRR
- -7.1%
- Equity multiple
- 0.51×
- Total profit
- $-23,112
- Equity at exit
- $14,612
Cash invested: $47,320 (down + closing). Projections, not guarantees.
Landlord ↔ Tenant lean methodology
- Overall (STATE)
- 90 Strongly Landlord-Friendly
- State South Carolina
- 90 Strongly Landlord-Friendly · R+6
- County
- — inherits STATE
- City
- — inherits STATE
ZIP-level market 29445
- Home prices YoY
- -18.0%
- Rents YoY
- 4.5%
- Active inventory
- 264
- Price-to-rent
- 8.4×
Monthly cashflow live
- Estimated rent
- $1,683 high interval (Pro) →
- Mortgage (P&I)
- −$886
- Tax from tax record
- −$216 /mo · $2,597/yr
- Insurance
- −$70
- HOA est. from 3 same-building comps
- −$255
- Vacancy / Maint / Mgmt
- −$353
- Net cashflow
- $-98
Break-even live
Sensitivity live
| Price | -10% $-3 | -5% $-50 | +0% $-98 | +5% $-146 | +10% $-194 |
|---|---|---|---|---|---|
| Rent | -10% $-231 | -5% $-165 | +0% $-98 | +5% $-32 | +10% $35 |
| Rate | -1.0pp $-13 | -0.5pp $-55 | base $-98 | +0.5pp $-142 | +1.0pp $-187 |
UW: 25.0% down · 7.5% · 30yr · 1.5% tax · 5.0% vac · 8.0% maint · 8.0% mgmt
Financing live
Cash to close
- Down payment
- $42,250
- Closing costs
- $5,070
- Reserves months
- —
- Total cash needed
- —
Loan-product check · same deal, 3 products live
Conventional
25% down · 7.5% · 30yr
- Down + closing
- —
- Monthly P&I
- —
- Monthly cashflow
- —
- DSCR
- —
- Eligible?
- —
Personal DTI + credit; lowest rate.
DSCR
20% down · 8.5% · 30yr
- Down + closing
- —
- Monthly P&I
- —
- Monthly cashflow
- —
- DSCR
- —
- Eligible?
- —
No personal income docs; deal must DSCR.
Hard money
10% down · 12.0% · 12mo
- Down + closing
- —
- Monthly P&I
- —
- Monthly cashflow
- —
- DSCR
- —
- Eligible?
- —
Short-term bridge; refi at stabilization.
Rent comps 8 comps
| Address | Beds | Baths | Sqft | Rent | $/sqft | DOM | Units | Dist |
|---|---|---|---|---|---|---|---|---|
| 100 Swift Blvd Goose Creek, SC | 1.0–3.0 | 1.0–2.0 | 1015 | $1,485 | $1.46 | 4d | 1 | 0.18mi |
| 5055 Harbour Lake Dr Goose Creek, SC | 2.0 | 1.0 | 877 | $1,425 | $1.62 | 25d | 1 | 0.64mi |
| 4255 Harbour Lake Dr Goose Creek, SC | 2.0 | 2.0 | 950 | $1,425 | $1.50 | 25d | 1 | 0.74mi |
| 3000 Harbour Lake Dr Goose Creek, SC | 2.0 | 1.0 | 962 | $1,548 | $1.61 | 4d | 56 | 0.74mi |
| 120 S Cranford Rd Goose Creek, SC | 2.0 | 1.5–2.0 | 1059 | $1,610 | $1.52 | 4d | 6 | 0.79mi |
| 1841 Sundancer Ln Goose Creek, SC | 3.0 | 2.0 | 1204 | $2,200 | $1.83 | 25d | 1 | 0.85mi |
| 169 Pine Shadow Dr Goose Creek, SC | 3.0 | 2.5 | 1200 | $1,800 | $1.50 | 25d | 1 | 1.10mi |
| 1000 Channel Marker Way Hanahan, SC | 1.0–3.0 | 1.0–2.0 | 960 | $1,766 | $1.84 | 4d | 20 | 1.49mi |
HOA detail condo
- Monthly dues
- $0 · $0/yr
- Assessments
- None detected in remarks — confirm with the listing agent.
Listing history 50 events
-
2026-06-21days on market $169,000 Active 66 DOM
-
2026-06-18days on market $169,000 Active 63 DOM
-
2026-06-17days on market $169,000 Active 62 DOM
-
2026-06-16days on market $169,000 Active 61 DOM
-
2026-06-15days on market $169,000 Active 60 DOM
-
2026-06-13days on market $169,000 Active 58 DOM
-
2026-06-13days on market $169,000 Active 57 DOM
-
2026-06-10days on market $169,000 Active 55 DOM
-
2026-06-09days on market $169,000 Active 54 DOM
-
2026-06-08days on market $169,000 Active 53 DOM
-
2026-06-07days on market $169,000 Active 52 DOM
-
2026-06-05days on market $169,000 Active 49 DOM
-
2026-06-03days on market $169,000 Active 48 DOM
-
2026-06-03days on market $169,000 Active 47 DOM
-
2026-06-01days on market $169,000 Active 46 DOM
-
2026-05-31days on market $169,000 Active 45 DOM
-
2026-04-16$175,000 Active
-
2026-03-23historical
-
2026-02-04$179,500 Active
-
2026-01-01historical
-
2025-09-19price $184,900
-
2025-08-18price $185,000
-
2025-06-20price $187,000
-
2025-05-27price $187,500
-
2025-05-01status Active
-
2025-05-01historical
-
2025-04-25price $189,500
-
2025-03-25price $168,500
-
2024-10-15$169,000 Active
-
2024-10-01historical
-
2024-08-15price $183,000
-
2024-07-06status Active
-
2024-05-05historical Active Under Contract
-
2024-04-20$185,000 Active
-
2018-05-08soldstatus $66,500
-
2018-05-04soldstatus $66,500 Closed
-
2018-03-28historical Active Contingent
-
2018-03-22$67,000 Active
-
2016-05-04soldstatus $60,925
-
2016-04-28soldstatus $60,925 Closed
-
2016-02-27historical Active Contingent
-
2016-02-03status Active
-
2016-01-27historical Active Contingent
-
2016-01-07$64,900 Active
-
2015-02-06historical
-
2015-02-06historical
-
2014-06-13soldstatus $45,000
-
2014-05-22soldstatus $45,000
-
2012-08-20$54,900
-
2010-08-11$99,500
ⓘ Source: listings_history table (triggers on properties + properties_extension) + one-shot
backfill from property_details.listing_events for pre-trigger history.
Tax reassessment forecast SC · Resets to sale price
- Current annual tax
- $2,597 · $216/mo
- Projected year-2 tax
- $2,597 · $216/mo
- Expected delta
- $0/yr ($0/mo · 0.0%)
ⓘ Screening estimate from a state-policy table — verify with the county assessor before closing.
Climate risk First Street
- Flood 1/10 Low FEMA zone X (unshaded) · 0% chance over 30 yrs
- Wildfire 3/10 Moderate
- Heat 9/10 Extreme 7 d/yr ≥106°F today · 17 d/yr by 30 yrs out
- Wind 8/10 Severe 99% chance of damaging wind over 30 yrs
- Air quality 2/10 Low 2 unhealthy d/yr today · 2 by 30 yrs out
Nearby sold comps map
Loading sold comps map…
Walkable amenities ~0.75 mi
Loading nearby amenities…
Taxation est. · year 1
- Rental income
- $20,199
- − Mortgage interest
- −$9,467
- − Property taxes
- −$2,597
- − Insurance
- −$845
- − Repairs & maintenance
- −$1,616
- − Management
- −$1,616
- − HOA
- −$3,060
- − Depreciation
- −$4,916
- Taxable loss
- −$3,918
- Est. tax savings @ 24.0%
- +$940
- After-tax cash flow
- $-240/yr
For passive investors: Depreciation is non-cash, so a rental often shows a tax loss while cash-flowing — sheltering income. Rental losses are passive: they offset passive income freely, and up to $25,000/yr can offset ordinary (W-2) income if you actively participate and your MAGI is under $100k (phasing out to $0 by $150k); unused losses carry forward. On sale, claimed depreciation is recaptured at up to 25%, and gains may owe capital-gains tax (a 1031 exchange can defer both). Figures are a year-1 estimate at your 24.0% rate — not tax advice; consult a CPA.
Schools (NCES district)
- District
- Berkeley 01
- NCES district ID
- 4501170
- Math proficiency
- 35% ▼ -8.00%
- Reading proficiency
- 48% ▼ -2.00%
- Median HH income
- $52,724
- Composite
- 35.95/100
- National rank
- #4799
- State rank
- #30 of 80 in SC
Livability — Hanahan
- Score
- 72/100
- State rank
- #45
- US rank
- #6201
Category grades
Schools grade is shown separately in the Schools card above.
Census & demographics
- County
- Berkeley County · 198,768 people
- City population
- 21,314
- Metro
- Charleston-North Charleston, SC
- Population (ZIP)
- 59,227
- Household income
- $81,594
- Rent vs Own
- Severe rent burden
- 1308.0
Population outlook (Berkeley County) Hauer SSP2
- Today (2025)
- 254,184 people
- By 2030
- 279,677 · +10.0%
- By 2040
- 329,379 · +29.6%
- By 2050
- 375,557 · +47.8%
- By 2075
- 476,740 · +87.6%
- By 2100
- 535,945 · +110.8%
Race, ethnicity, and origin ACS 2023
- Neighborhood character
- Diverse neighborhood (Simpson 0.63)
- Race & ethnicity
- White 55% Black 23% Hispanic / Latino 11% Two or more races 9% Asian 3%
- Hispanic origin (detail)
- Mexican 4% Puerto Rican 3%
- Common ancestry
- Slovak 2% Lithuanian 2% Italian 1%
- Foreign-born
- 9% · Canada, Jamaica, Vietnam
- Languages at home
- 86% English-only · Spanish 8% Other Indo-European 2% Tagalog/Filipino 2%
Political lean MEDSL · Berkeley
- 2024 margin
- R (+16.3) · D 41.1% · R 57.4% · Other 1.4%
- 2008→2024 swing
- -3.2pp toward R · 2008: -13.1pp · 2024: -16.3pp
- All cycles
- 2024: R+16.3 2020: R+11.7 2016: R+17.4 2012: R+18.9 2008: R+13.1
Not yet ingested
- Civics
- —
Market trends
- HPI YoY
- ▼ -66.40%
- Current HPI
- 301.8653
- Rent YoY
- ▲ 4.52%
- Metro
- Charleston-North Charleston, SC
- State GDP YoY
- ▲ 4.51%
- F500 in state
- 2
Industry mix (Fortune 500 HQ in SC)
| Industry | F500 HQs | Revenue |
|---|---|---|
| Packaging | 1 | $7B |
|
||
Price history
+233.3% since first listed36 events — show timeline
- 2026-04-16 Listed $175,000 Charleston Trident MLS
- 2026-03-23 Listing Removed — Charleston Trident MLS
- 2026-02-04 Listed $179,500 Charleston Trident MLS
- 2026-01-01 Listing Removed — Charleston Trident MLS
- 2025-09-19 Price Changed $184,900 Charleston Trident MLS
- 2025-08-18 Price Changed $185,000 Charleston Trident MLS
- 2025-06-20 Price Changed $187,000 Charleston Trident MLS
- 2025-05-27 Price Changed $187,500 Charleston Trident MLS
- 2025-05-01 Relisted — Charleston Trident MLS
- 2025-05-01 Listing Removed — Charleston Trident MLS
- 2025-04-25 Price Changed $189,500 Charleston Trident MLS
- 2025-03-25 Price Changed $168,500 Charleston Trident MLS
- 2024-10-15 Listed $169,000 Charleston Trident MLS
- 2024-10-01 Listing Removed — Charleston Trident MLS
- 2024-08-15 Price Changed $183,000 Charleston Trident MLS
- 2024-07-06 Relisted — Charleston Trident MLS
- 2024-05-05 Contingent — Charleston Trident MLS
- 2024-04-20 Listed $185,000 Charleston Trident MLS
- 2018-05-08 Sold (Public Records) $66,500 Public Records
- 2018-05-04 Sold (MLS) $66,500 Charleston Trident MLS
- 2018-03-28 Contingent — Charleston Trident MLS
- 2018-03-22 Listed $67,000 Charleston Trident MLS
- 2016-05-04 Sold (Public Records) $60,925 Public Records
- 2016-04-28 Sold (MLS) $60,925 Charleston Trident MLS
- 2016-02-27 Contingent — Charleston Trident MLS
- 2016-02-03 Relisted — Charleston Trident MLS
- 2016-01-27 Contingent — Charleston Trident MLS
- 2016-01-07 Listed $64,900 Charleston Trident MLS
- 2015-02-06 Listing Removed — Charleston Trident MLS
- 2015-02-06 Listing Removed — Charleston Trident MLS
- 2014-06-13 Sold (Public Records) $45,000 Public Records
- 2014-05-22 Sold (MLS) $45,000 Charleston Trident MLS
- 2012-08-20 Listed $54,900 Charleston Trident MLS
- 2010-08-11 Listed $99,500 Charleston Trident MLS
- 2008-06-23 Listed $99,500 Charleston Trident MLS
- 1985-08-09 Sold (Public Records) $52,500 Public Records
Property tax history
+11.0%/yrLatest (2025): $2,597 · +104.0% YoY. Source: county tax records.
Cash-flow waterfall
monthlySold comps — $/sqft
last 12 mo · ≤1 miLoading sold comps…