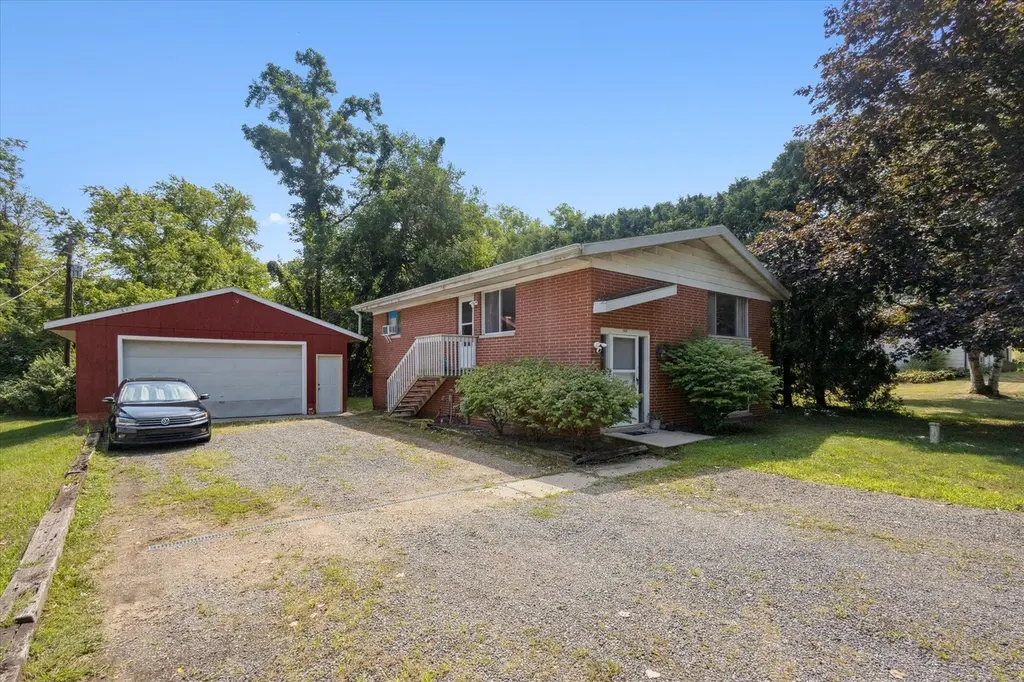
7039 Curtis Dr · Coloma, MI
Flood risk 1/10 · Minimal
- FEMA flood zone
- X (unshaded)
- Chance of flooding over 30 yrs
- 0.0%
- Est. flood insurance / yr
- $507 – $1,088
Fire risk 1/10 · Minimal
- Est. fire insurance / yr
- $784 – $1,456
Heat risk 2/10 · Minimal
- Hot days now (above 99°F)
- 7 days/yr
- Hot days in 30 yrs
- 15 days/yr
Wind risk 2/10 · Minimal
- Chance of severe wind over 30 yrs
- —
Air-quality risk 4/10 · Minor
- Unhealthy air days now
- 4 days/yr
- Unhealthy air days in 30 yrs
- 7 days/yr
Risk factors via First Street. Map © Google.
Why this score? — see what drove the D+ grade
The composite is a weighted blend of 9 inputs, each scored 0–100. Each bar is that input's sub-score; the figure is the points it added to the 100-point composite (weight × sub-score).
- Cash flow +13.9/30.0
- ARV discount +13.2/15.0
- DSCR +4.2/10.0
- Livability +3.7/5.0
- 1% rule +3.6/10.0
- Rent growth +2.5/5.0
- Condition / age +2.5/5.0
- Schools +2.4/10.0
- Appreciation +0.0/10.0
$249,995
🖨 Deal sheet (PDF) 📄 Offer letter ✓ Due diligence
Listing remarks MLS
Opportunity knocks with this well-cared-for brick duplex offering flexibility for living, investing, or both. Each unit includes 2 bedrooms, 1 bathroom, onsite laundry, garage access, and a private backyard setting perfect for relaxing or entertaining. Currently tenant-occupied with rents well below market value, this property presents immediate upside potential for investors seeking increased cash flow. Whether you choose to maintain reliable long-term tenants, adjust rents over time, or explore alternative rental strategies, the income possibilities are strong. Enjoy deeded access to beautiful Paw Paw Lake along with a nearby boat launch, adding lifestyle appeal and rental demand. Coloma's flexible short-term rental environment makes this an excellent candidate for vacation rental or hybrid income potential. Now offered at a lower price than before, this is a great opportunity to secure a versatile income-producing property just minutes Lake Michigan. Schedule your showing now!
Key facts
- Onsite laundry
- Private backyard
- Brick duplex
Tags
Neighborhood map
What this means for you Summary
Snapshot
- This is a 3-bed/2.0-bath single-family listed at $250k.
Deal economics
- At list price, monthly cash flow is $26 ($311/yr) — positive.
- The deal already cash-flows at list — no discount required.
- To meet the 1% rule (rent ≥ 1% of price), the offer needs to be $214k (14.2% below list).
- Recommended offer: $214k (14.2% below list) — sets the bar for 1% rule.
Location & tenants
- Location reads 73/100 on livability (#218 in MI) — a middle-class / working-renter tenant base. Strengths: cost of living A+, housing A+, health & safety A+; Watch: schools D+, amenities F, commute F.
- Coloma Community Schools (town): math 17% / reading 39% proficiency, ranked #384 of 540 in MI (top 71%) — low school quality limits family demand, transient renter base, plan for 1-2y turnover.
- Market conditions: 43 active listings in the ZIP; 4 comparable units currently listed for rent nearby; rentals lingering (median 45d on market — plan ~5-8 weeks vacancy on turnover, expect pricing pressure); 100% of comp listings sitting > 30 days — soft ceiling on asking rent; 397 units permitted in Berrien County in 2024 (40 in 5+ unit buildings).
Forward outlook
- Local home prices are declining (-3.0%/yr); year-one equity from $2k of loan paydown is wiped out by about $8k of value loss. Plan a longer hold.
- Berrien County population projected at -16% by 2050 — secular population decline; favor cash flow + early exit over multi-decade hold.
Negotiation context
- It's been on market 120 days — a 9% lower offer ($227k) is reasonable based on typical stale-listing flexibility.
- 9 sale attempts since 34y ago with the ask held roughly flat each time — persistent listings suggest the price (not the market) is what's stuck; bring a comps-based counter.
- Current owner paid $123k; list at $250k implies a 103% gain — meaningful room to come down on a strong offer.
Questions for the listing agent
- It's been on market 120 days. Have you received any prior offers? Is the seller open to a 14% concession, seller financing, or rate buy-down credit?
- Built in 1965 — when were the roof, HVAC, electrical panel, plumbing, and water heater last replaced?
- Why hasn't it sold? Are there any deal-killer items the seller is aware of (foundation, flood, title, zoning, code violations)?
- Is there a deadline driving the sale (1031 exchange, divorce, estate, relocation)? That informs how much negotiation room exists.
- Schools are D-rated, which usually means shorter tenancies and higher turnover. Who's the typical renter profile here, and what's been the actual vacancy rate?
- The area grade is low — what's the realistic commute time and amenity access for the typical tenant pool here? Any planned neighborhood developments (good or bad) we should know about?
- What's the average days-on-market for RENTAL listings here right now (not sales)? A rising rental-DOM trend means longer vacancies and softer asking-rent achievability than the comps imply.
- What's the recent tenant-quality profile in this submarket — average credit score on applications, eviction rate, late-payment / NSF rate, and stable-employment percentage? A property-management company in the area should have these aggregated.
- How much new for-sale + rental construction is in the pipeline within 1–3 miles? Heavy new supply typically softens prices + rents 12–24 months out; constrained supply supports both.
Investment metrics
- 1% rule
- 0.86% ✗
- Cap rate
- 6.42%
- Cash-on-cash
- 0.44%
- DSCR
- 1.02
- GRM
- 9.7
CMA / ARV
- ARV (median comp)
- $285,908
- List price
- $249,995
- Delta
- -12.56%
- Verdict
- UNDERPRICED
- Comps
- 2 within 1.0 mi
Show comp detail 10 sales within ~0.75 mi
| Address | Dist | Beds/Ba | Sqft | Sold | Price | $/sf | Match |
|---|---|---|---|---|---|---|---|
| 4557 Douglas Ter | 0.08mi | 3/2.5 | 1,624 (-10%) | 8mo | $240,000 | $148 | 72 |
| 4759 Paw Paw Lake Rd | 0.54mi | 3/1.5 | 1,816 (+1%) | 5mo | $250,000 | $138 | 67 |
| 4749 Wil-o-paw Dr | 0.44mi | 3/2.0 | 1,620 (-10%) | 2mo | $243,500 | $150 | 61 |
| 6772 Paw Paw Ave | 0.23mi | 2/2.0 (-1) | 1,876 (+4%) | 20mo | $270,000 | $144 | 60 |
| 4549 Forest Beach Rd | 0.62mi | 3/2.0 | 1,765 (-2%) | 11mo | $355,000 | $201 | 59 |
| 7285 Paw Paw Ave | 0.33mi | 3/2.5 | 2,056 (+14%) | 1mo | $380,000 | $185 | 58 |
| 4801 Wil-o-paw Dr | 0.48mi | 2/1.0 (-1) | 1,924 (+7%) | 3mo | $164,900 | $86 | 54 |
| 6828 First Ave | 0.46mi | 4/2.5 (+1) | 1,630 (-9%) | 9mo | $359,900 | $221 | 48 |
| 7580 Paw Paw Ave | 0.71mi | 3/2.0 | 1,872 (+4%) | 20mo | $219,900 | $117 | 44 |
| 7476 Beechwood Cir | 0.72mi | 4/1.5 (+1) | 1,970 (+10%) | 24mo | $220,000 | $112 | 24 |
Match score weights: distance 35% · size 25% · config 20% · recency 20%. Top-matched comps best support the ARV.
Projected returns pro-forma
-3.0% appreciation · 3.0% rent growth · sell at horizon
- IRR
- -15.6%
- Equity multiple
- 0.44×
- Total profit
- $-38,862
- Equity at exit
- $37,275
- IRR
- -7.1%
- Equity multiple
- 0.55×
- Total profit
- $-31,729
- Equity at exit
- $21,615
Cash invested: $69,999 (down + closing). Projections, not guarantees.
Landlord ↔ Tenant lean methodology
- Overall (STATE)
- 62 Landlord-Friendly
- State Michigan
- 62 Landlord-Friendly · EVEN
- County
- — inherits STATE
- City
- — inherits STATE
ZIP-level market 49038
- Active inventory
- 43
- Price-to-rent
- 9.7×
Monthly cashflow live
- Estimated rent
- $2,144 medium interval (Pro) →
- Mortgage (P&I)
- −$1,311
- Tax from tax record
- −$253 /mo · $3,034/yr
- Insurance
- −$104
- HOA
- −$0
- Vacancy / Maint / Mgmt
- −$450
- Net cashflow
- $26
Break-even live
Sensitivity live
| Price | -10% $167 | -5% $97 | +0% $26 | +5% $-45 | +10% $-116 |
|---|---|---|---|---|---|
| Rent | -10% $-143 | -5% $-59 | +0% $26 | +5% $111 | +10% $195 |
| Rate | -1.0pp $152 | -0.5pp $90 | base $26 | +0.5pp $-39 | +1.0pp $-105 |
UW: 25.0% down · 7.5% · 30yr · 1.5% tax · 5.0% vac · 8.0% maint · 8.0% mgmt
Financing live
Cash to close
- Down payment
- $62,499
- Closing costs
- $7,500
- Reserves months
- —
- Total cash needed
- —
Loan-product check · same deal, 3 products live
Conventional
25% down · 7.5% · 30yr
- Down + closing
- —
- Monthly P&I
- —
- Monthly cashflow
- —
- DSCR
- —
- Eligible?
- —
Personal DTI + credit; lowest rate.
DSCR
20% down · 8.5% · 30yr
- Down + closing
- —
- Monthly P&I
- —
- Monthly cashflow
- —
- DSCR
- —
- Eligible?
- —
No personal income docs; deal must DSCR.
Hard money
10% down · 12.0% · 12mo
- Down + closing
- —
- Monthly P&I
- —
- Monthly cashflow
- —
- DSCR
- —
- Eligible?
- —
Short-term bridge; refi at stabilization.
Rent comps 4 comps
| Address | Beds | Baths | Sqft | Rent | $/sqft | DOM | Units | Dist |
|---|---|---|---|---|---|---|---|---|
| 7604 Red Arrow Hwy Watervliet, MI | 2.0–3.0 | 2.0 | 1078 | $1,319 | $1.22 | 44d | 1 | 1.05mi |
| 4020 Sumner Dr Watervliet, MI | 4.0 | 2.0 | 1750 | $2,395 | $1.37 | 44d | 1 | 1.17mi |
| 3882 Watertown Dr Watervliet, MI | 4.0 | 2.0 | 1750 | $2,195 | $1.25 | 44d | 1 | 1.33mi |
| 3866 Watertown Dr Watervliet, MI | 4.0 | 2.0 | 2060 | $2,495 | $1.21 | 44d | 1 | 1.34mi |
Listing history 28 events
-
2026-06-16days on market $249,995 Active 120 DOM
-
2026-06-15days on market $249,995 Active 119 DOM
-
2026-06-13days on market $249,995 Active 117 DOM
-
2026-06-12days on market $249,995 Active 116 DOM
-
2026-06-09days on market $249,995 Active 113 DOM
-
2026-06-08days on market $249,995 Active 112 DOM
-
2026-06-07days on market $249,995 Active 111 DOM
-
2026-06-07days on market $249,995 Active 110 DOM
-
2026-06-04days on market $249,995 Active 107 DOM
-
2026-06-02days on market $249,995 Active 106 DOM
-
2026-06-01days on market $249,995 Active 105 DOM
-
2026-05-31days on market $249,995 Active 104 DOM
-
2026-05-31days on market $249,995 Active 103 DOM
-
2026-02-16$249,995 Active 994-char remark
Show marketing remark (994 chars)
Opportunity knocks with this well-cared-for brick duplex offering flexibility for living, investing, or both. Each unit includes 2 bedrooms, 1 bathroom, onsite laundry, garage access, and a private backyard setting perfect for relaxing or entertaining. Currently tenant-occupied with rents well below market value, this property presents immediate upside potential for investors seeking increased cash flow. Whether you choose to maintain reliable long-term tenants, adjust rents over time, or explore alternative rental strategies, the income possibilities are strong. Enjoy deeded access to beautiful Paw Paw Lake along with a nearby boat launch, adding lifestyle appeal and rental demand. Coloma's flexible short-term rental environment makes this an excellent candidate for vacation rental or hybrid income potential. Now offered at a lower price than before, this is a great opportunity to secure a versatile income-producing property just minutes Lake Michigan. Schedule your showing now!
-
2025-11-19historical
-
2025-10-31status Active
-
2025-10-31status Active
-
2025-10-28status Pending
-
2025-10-28status Pending
-
2025-08-26status Active
-
2025-08-25historical
-
2025-08-18$265,000 Active
-
2025-08-18$265,000 Active
-
2004-11-30soldstatus $123,255
-
2004-10-01$130,000
-
1993-02-04soldstatus $69,000
-
1992-05-07$75,900
ⓘ Source: listings_history table (triggers on properties + properties_extension) + one-shot
backfill from property_details.listing_events for pre-trigger history.
Tax reassessment forecast MI · Partial reset (capped growth)
- Current annual tax
- $3,034 · $253/mo
- Projected year-2 tax
- $3,442 · $287/mo
- Expected delta
- +$408/yr (+$34/mo · 13.4%)
ⓘ Screening estimate from a state-policy table — verify with the county assessor before closing.
Climate risk First Street
- Flood 1/10 Low FEMA zone X (unshaded) · 0% chance over 30 yrs
- Wildfire 1/10 Low
- Heat 2/10 Low 7 d/yr ≥99°F today · 15 d/yr by 30 yrs out
- Wind 2/10 Low
- Air quality 4/10 Moderate 4 unhealthy d/yr today · 7 by 30 yrs out
Nearby sold comps map
Loading sold comps map…
Walkable amenities ~0.75 mi
Loading nearby amenities…
Taxation est. · year 1
- Rental income
- $25,731
- − Mortgage interest
- −$14,004
- − Property taxes
- −$3,034
- − Insurance
- −$1,250
- − Repairs & maintenance
- −$2,058
- − Management
- −$2,058
- − Depreciation
- −$7,273
- Taxable loss
- −$3,946
- Est. tax savings @ 24.0%
- +$947
- After-tax cash flow
- $1,258/yr
For passive investors: Depreciation is non-cash, so a rental often shows a tax loss while cash-flowing — sheltering income. Rental losses are passive: they offset passive income freely, and up to $25,000/yr can offset ordinary (W-2) income if you actively participate and your MAGI is under $100k (phasing out to $0 by $150k); unused losses carry forward. On sale, claimed depreciation is recaptured at up to 25%, and gains may owe capital-gains tax (a 1031 exchange can defer both). Figures are a year-1 estimate at your 24.0% rate — not tax advice; consult a CPA.
Schools (NCES district)
- District
- Coloma Community Schools
- NCES district ID
- 2610380
- Math proficiency
- 17% ▼ -5.00%
- Reading proficiency
- 39% ▲ 2.00%
- Median HH income
- $48,135
- Composite
- 24.28/100
- National rank
- #7715
- State rank
- #384 of 540 in MI
Livability — Coloma
- Score
- 73/100
- State rank
- #218
- US rank
- #5399
Category grades
Schools grade is shown separately in the Schools card above.
Census & demographics
- Census place
- Paw Paw Lake, MI
- Population (ZIP)
- 8,577
Population outlook (Berrien County) Hauer SSP2
- Today (2025)
- 149,273 people
- By 2030
- 145,211 · -2.7%
- By 2040
- 135,435 · -9.3%
- By 2050
- 125,543 · -15.9%
- By 2075
- 103,986 · -30.3%
- By 2100
- 82,256 · -44.9%
Race, ethnicity, and origin ACS 2023
- Neighborhood character
- Predominantly White (82%)
- Race & ethnicity
- White 82% Two or more races 9% Black 6% Hispanic / Latino 4%
- Common ancestry
- Italian 4% Romanian 4% Iranian 3%
- Foreign-born
- 3% · Canada
- Languages at home
- 96% English-only · Spanish 2% Other Indo-European 1% German/W. Germanic 1%
Political lean MEDSL · Berrien
- 2024 margin
- Lean R (+7.9) · D 45.4% · R 53.2% · Other 1.4%
- 2008→2024 swing
- -13.3pp toward R · 2008: 5.5pp · 2024: -7.9pp
- All cycles
- 2024: R+7.9 2020: R+7.4 2016: R+12.7 2012: R+6.6 2008: D+5.5
Not yet ingested
- Civics
- —
Market trends
- HPI YoY
- ▼ -149.33%
- Current HPI
- 237.5873
- Rent YoY
- —
- Metro
- —
- State GDP YoY
- ▲ 1.37%
- F500 in state
- 28
Industry mix (Fortune 500 HQ in MI)
| Industry | F500 HQs | Revenue |
|---|---|---|
| Automotive Parts | 3 | $48B |
|
||
| Automotive | 2 | $372B |
|
||
| Chemicals | 1 | $45B |
|
||
| Automotive Retail | 1 | $29B |
|
||
| Healthcare / Medical Devices | 1 | $23B |
|
||
| Automotive Technology | 1 | $20B |
|
||
Price history
+229.4% since first listed15 events — show timeline
- 2026-02-16 Listed $249,995 REALCOMP
- 2026-02-16 Listed $249,995 MiRealSource-MiMLS
- 2025-11-19 Listing Removed — MiRealSource-MiMLS
- 2025-10-31 Relisted — REALCOMP
- 2025-10-31 Relisted — MiRealSource-MiMLS
- 2025-10-28 Pending — REALCOMP
- 2025-10-28 Pending — MiRealSource-MiMLS
- 2025-08-26 Relisted — REALCOMP
- 2025-08-25 Listing Removed — REALCOMP
- 2025-08-18 Listed $265,000 REALCOMP
- 2025-08-18 Listed $265,000 MiRealSource-MiMLS
- 2004-11-30 Sold (MLS) $123,255 SW Michigan MLS
- 2004-10-01 Listed $130,000 SW Michigan MLS
- 1993-02-04 Sold (MLS) $69,000 SW Michigan MLS
- 1992-05-07 Listed $75,900 SW Michigan MLS
Property tax history
-0.1%/yrLatest (2024): $3,034 · +9.3% YoY. Source: county tax records.
Cash-flow waterfall
monthlySold comps — $/sqft
last 12 mo · ≤1 miLoading sold comps…