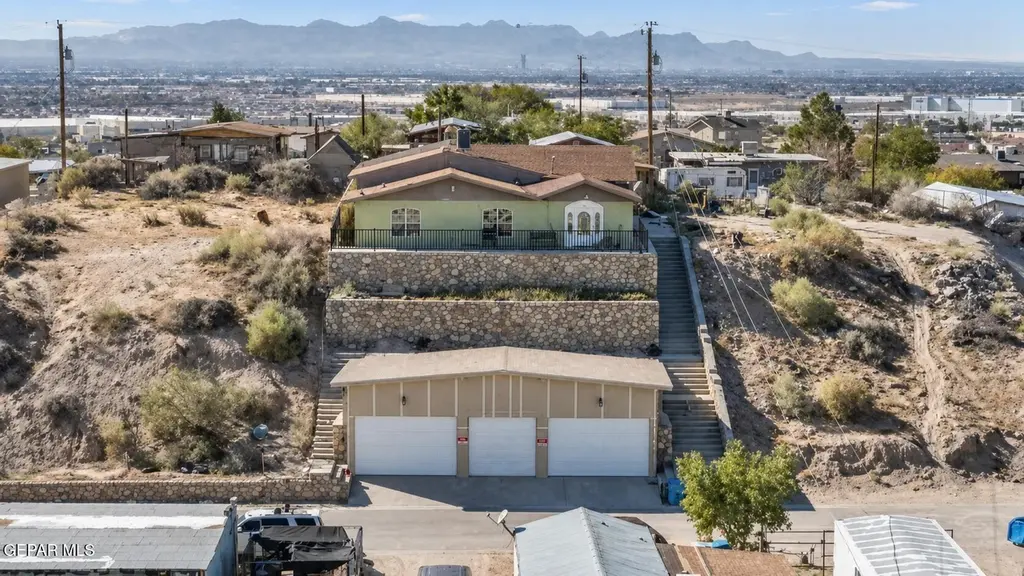
167 Loyola Ln · Sparks, TX
Flood risk 1/10 · Minimal
- FEMA flood zone
- X
- Chance of flooding over 30 yrs
- 0.0%
- Est. flood insurance / yr
- $507 – $1,088
Fire risk 3/10 · Minor
- Est. fire insurance / yr
- $1,222 – $2,270
Heat risk 6/10 · Moderate
- Hot days now (above 101°F)
- 6 days/yr
- Hot days in 30 yrs
- 22 days/yr
Wind risk 1/10 · Minimal
- Chance of severe wind over 30 yrs
- —
Air-quality risk 3/10 · Minor
- Unhealthy air days now
- 2 days/yr
- Unhealthy air days in 30 yrs
- 2 days/yr
Risk factors via First Street. Map © Google.
Why this score? — see what drove the C+ grade
The composite is a weighted blend of 9 inputs, each scored 0–100. Each bar is that input's sub-score; the figure is the points it added to the 100-point composite (weight × sub-score).
- Cash flow +23.4/30.0
- ARV discount +15.0/15.0
- DSCR +7.5/10.0
- 1% rule +6.4/10.0
- Rent growth +3.2/5.0
- Livability +2.8/5.0
- Schools +2.6/10.0
- Condition / age +2.5/5.0
- Appreciation +0.0/10.0
$194,900
🖨 Deal sheet 📄 Offer letter ✓ Due diligence
Listing remarks
This unique hillside home features 3 bedrooms and 2 bathrooms, offering privacy, character, and breathtaking scenic views. Perched on a hill, the property provides a peaceful atmosphere and beautiful surroundings that make the climb worthwhile. Access to the home requires climbing 42 stairs, adding to its elevated charm and panoramic vantage point. Perfect for those who appreciate privacy, tranquility, and a one-of-a-kind setting.
Key facts
- Hillside home
- 6,600 sq ft lot
- 4 garage spots
Tags
Property features AI
Finance
- HOA & community: No HOA fees
Exterior
- Utilities: Sewer: See remarks (refer to listing for details)
- Home design: Single family residence
- Construction: Concrete and stone construction; Shingle roof; Total building area approximately 2,625
- Exterior features: See remarks (refer to listing for details)
Interior
- Kitchen: Appliances: See remarks (refer to listing for specifics)
- Flooring: Tile flooring
- Bathrooms: 2 full bathrooms
- Heating & cooling: Natural gas heating; Refrigerated cooling (central)
- Interior features: See remarks (refer to listing for details)
Neighborhood map
What this means for you Summary
Snapshot
- This is a 3-bed/1.0-bath single-family listed at $195k.
Deal economics
- At list price, monthly cash flow is $362 ($4k/yr) — positive.
- The deal already cash-flows at list — no discount required.
- Meets the 1% rule at list price ($2k rent vs $195k).
- Recommended offer: $189k (3.0% below list) — sets the bar for market timing.
Location & tenants
- Location reads 55/100 on livability (#1,377 in TX) — a working-class tenant base; expect higher turnover. Strengths: cost of living A+, housing A+; Watch: amenities F, commute F, employment F.
- Socorro ISD (urban): math 23% / reading 36% proficiency, ranked #624 of 826 in TX (top 76%) — low school quality limits family demand, transient renter base, plan for 1-2y turnover; 66% free/reduced lunch — lower-income household profile, screen leases tightly.
- Zoned schools: Mission Ridge (math 14% / reading 25%, grade F, #3,583 of 4,322 statewide, top 86%, 962 students, 81% FRL); Col John O Ensor Middle (math 30% / reading 38%, grade F, #892 of 1,662 statewide, top 55%, 1,173 students, 70% FRL); Eastlake H S (math 28% / reading 47%, grade F, #888 of 1,632 statewide, top 55%, 2,851 students, 73% FRL).
- Market conditions: Rents rising (+2.9%/yr); 2088 active listings in the ZIP; 15 comparable units currently listed for rent nearby; rentals lingering (median 44d on market — plan ~5-8 weeks vacancy on turnover, expect pricing pressure); 53% of comp listings sitting > 30 days — soft ceiling on asking rent; solid renter incomes; 2,196 units permitted in El Paso County in 2024 (143 in 5+ unit buildings).
- This rent runs 35% of the median local income ($77k/yr) — at the standard rent-burdened threshold; future hikes will face affordability resistance.
Forward outlook
- Local home prices are declining (-3.0%/yr); year-one equity from $1k of loan paydown is wiped out by about $6k of value loss. Plan a longer hold.
- El Paso County population projected at +10% by 2050 — modest demand growth; plan on rents tracking national, not racing it.
Negotiation context
- It's been on market 41 days — a 3% lower offer ($189k) is reasonable based on typical stale-listing flexibility.
- 2 sale attempts; this cycle's ask has dropped $15k (7%) from the opening price — seller is motivated, your offer sets the floor, not the list.
Risks & watch-outs
- Climate carrying-cost: extreme-heat days projected 6→22/yr by 2055 (HVAC capex compounding) — expect insurance premiums to compound above CPI over the hold.
Questions for the listing agent
- It's been on market 41 days. Have you received any prior offers? Is the seller open to a 3% concession, seller financing, or rate buy-down credit?
- Is there a deadline driving the sale (1031 exchange, divorce, estate, relocation)? That informs how much negotiation room exists.
- Schools are F-rated, which usually means shorter tenancies and higher turnover. Who's the typical renter profile here, and what's been the actual vacancy rate?
- What's the average days-on-market for RENTAL listings here right now (not sales)? A rising rental-DOM trend means longer vacancies and softer asking-rent achievability than the comps imply.
- What's the recent tenant-quality profile in this submarket — average credit score on applications, eviction rate, late-payment / NSF rate, and stable-employment percentage? A property-management company in the area should have these aggregated.
- How much new for-sale + rental construction is in the pipeline within 1–3 miles? Heavy new supply typically softens prices + rents 12–24 months out; constrained supply supports both.
Investment metrics
- 1% rule
- 1.14% ✓
- Cap rate
- 8.52%
- Cash-on-cash
- 7.95%
- DSCR
- 1.35
- GRM
- 7.3
CMA / ARV
- ARV (median comp)
- $275,000
- List price
- $194,900
- Delta
- -29.13%
- Verdict
- UNDERPRICED
- Comps
- 1 within 2.0 mi
Projected returns pro-forma
-3.0% appreciation · 2.93% rent growth · sell at horizon
- IRR
- -4.2%
- Equity multiple
- 0.84×
- Total profit
- $-8,647
- Equity at exit
- $29,060
- IRR
- 5.4%
- Equity multiple
- 1.40×
- Total profit
- $21,734
- Equity at exit
- $16,851
Cash invested: $54,572 (down + closing). Projections, not guarantees.
Landlord ↔ Tenant lean methodology
- Overall (STATE)
- 87 Strongly Landlord-Friendly
- State Texas
- 87 Strongly Landlord-Friendly · R+5
- County
- — inherits STATE
- City
- — inherits STATE
ZIP-level market 79928
- Home prices YoY
- -16.9%
- Rents YoY
- 2.9%
- Active inventory
- 2088
- Price-to-rent
- 7.3×
Monthly cashflow live
- Estimated rent
- $2,220 high interval (Pro) →
- Mortgage (P&I)
- −$1,022
- Tax from tax record
- −$289 /mo · $3,463/yr
- Insurance
- −$81
- HOA
- −$0
- Vacancy / Maint / Mgmt
- −$466
- Net cashflow
- $362
Break-even live
UW: 25.0% down · 7.5% · 30yr · 1.5% tax · 5.0% vac · 8.0% maint · 8.0% mgmt
Financing live
Cash to close
- Down payment
- $48,725
- Closing costs
- $5,847
- Reserves months
- —
- Total cash needed
- —
Loan-product check · same deal, 3 products live
Conventional
25% down · 7.5% · 30yr
- Down + closing
- —
- Monthly P&I
- —
- Monthly cashflow
- —
- DSCR
- —
- Eligible?
- —
Personal DTI + credit; lowest rate.
DSCR
20% down · 8.5% · 30yr
- Down + closing
- —
- Monthly P&I
- —
- Monthly cashflow
- —
- DSCR
- —
- Eligible?
- —
No personal income docs; deal must DSCR.
Hard money
10% down · 12.0% · 12mo
- Down + closing
- —
- Monthly P&I
- —
- Monthly cashflow
- —
- DSCR
- —
- Eligible?
- —
Short-term bridge; refi at stabilization.
Rent comps 15 comps
| Address | Beds | Baths | Sqft | Rent | $/sqft | DOM | Units | Dist |
|---|---|---|---|---|---|---|---|---|
| 12911 Aberdare Dr El Paso, TX | 4.0 | 2.5 | 1838 | $2,200 | $1.20 | 14d | 1 | 0.40mi |
| 253 Farnborough St El Paso, TX | 3.0 | 2.0 | 1960 | $2,400 | $1.22 | 14d | 1 | 0.47mi |
| 12874 Woolstone Dr El Paso, TX | 4.0 | 2.5 | 1771 | $1,995 | $1.13 | 43d | 1 | 0.56mi |
| 13082 Oakhampton Ave El Paso, TX | 3.0 | 2.5 | 2572 | $2,600 | $1.01 | 2d | 1 | 0.62mi |
| 12878 Clevedon St El Paso, TX | 4.0 | 2.5 | 1872 | $2,250 | $1.20 | 43d | 1 | 0.69mi |
| 393 Frodsham St El Paso, TX | 4.0 | 2.0 | 1788 | $2,000 | $1.12 | 11d | 1 | 0.81mi |
| 392 Frodsham St El Paso, TX | 4.0 | 2.5 | 1801 | $2,075 | $1.15 | 43d | 1 | 0.82mi |
| 13146 Cleethorpes St El Paso, TX | 3.0 | 2.5 | 2085 | $2,075 | $1.00 | 43d | 1 | 0.85mi |
| 369 Emerald Acres Horizon City, TX | 4.0 | 3.0 | 2471 | $2,350 | $0.95 | 3d | 1 | 0.95mi |
| 212 S Manzanita Dr El Paso, TX | 4.0 | 3.5 | 3308 | $2,700 | $0.82 | 43d | 1 | 0.96mi |
| 416 Quiet Prairie Dr Horizon City, TX | 3.0 | 2.5 | 2365 | $1,950 | $0.82 | 43d | 1 | 0.96mi |
| 300 Saltford Dr Horizon City, TX | 4.0 | 2.5 | 2033 | $2,000 | $0.98 | 14d | 1 | 1.11mi |
| 454 Claiborne St Horizon City, TX | 3.0 | 2.0 | 2018 | $1,775 | $0.88 | 43d | 1 | 1.18mi |
| 452 Emerald Pass Ave Horizon City, TX | 4.0 | 2.5 | 2135 | $1,800 | $0.84 | 43d | 1 | 1.43mi |
| 13483 Halifax St Horizon City, TX | 3.0 | 2.5 | 2061 | $2,250 | $1.09 | 2d | 1 | 1.46mi |
Listing history 21 events
-
2026-06-18days on market $194,900 Active 41 DOM
-
2026-06-17days on market $194,900 Active 40 DOM
-
2026-06-16days on market $194,900 Active 39 DOM
-
2026-06-15days on market $194,900 Active 38 DOM
-
2026-06-13days on market $194,900 Active 36 DOM
-
2026-06-10days on market $194,900 Active 33 DOM
-
2026-06-09days on market $194,900 Active 32 DOM
-
2026-06-08days on market $194,900 Active 31 DOM
-
2026-06-07days on market $194,900 Active 30 DOM
-
2026-06-05days on market $194,900 Active 27 DOM
-
2026-06-03days on market $194,900 Active 26 DOM
-
2026-06-03days on market $194,900 Active 25 DOM
-
2026-06-01days on market $194,900 Active 24 DOM
-
2026-05-31days on market $194,900 Active 23 DOM
-
2026-05-07$209,900 Active 434-char remark
-
2025-11-30status Pending
-
2025-11-25historical Active Under Contract
-
2025-11-21historical
-
2025-11-13$179,900 Active
-
1994-06-23soldstatus
-
1991-07-17soldstatus
ⓘ Source: listings_history table (triggers on properties + properties_extension) + one-shot
backfill from property_details.listing_events for pre-trigger history.
Tax reassessment forecast TX · Resets to sale price
- Current annual tax
- $3,463 · $289/mo
- Projected year-2 tax
- $3,567 · $297/mo
- Expected delta
- +$104/yr (+$9/mo · 3.0%)
ⓘ Screening estimate from a state-policy table — verify with the county assessor before closing.
Climate risk First Street
- Flood 1/10 Low FEMA zone X · 0% chance over 30 yrs
- Wildfire 3/10 Moderate
- Heat 6/10 Major 6 d/yr ≥101°F today · 22 d/yr by 30 yrs out
- Wind 1/10 Low
- Air quality 3/10 Moderate 2 unhealthy d/yr today · 2 by 30 yrs out
Nearby sold comps map
Loading sold comps map…
Walkable amenities ~0.75 mi
Loading nearby amenities…
Taxation est. · year 1
- Rental income
- $26,635
- − Mortgage interest
- −$10,917
- − Property taxes
- −$3,463
- − Insurance
- −$974
- − Repairs & maintenance
- −$2,131
- − Management
- −$2,131
- − Depreciation
- −$5,670
- Taxable income
- $1,349
- Est. tax owed @ 24.0%
- −$324
- After-tax cash flow
- $4,016/yr
For passive investors: Depreciation is non-cash, so a rental often shows a tax loss while cash-flowing — sheltering income. Rental losses are passive: they offset passive income freely, and up to $25,000/yr can offset ordinary (W-2) income if you actively participate and your MAGI is under $100k (phasing out to $0 by $150k); unused losses carry forward. On sale, claimed depreciation is recaptured at up to 25%, and gains may owe capital-gains tax (a 1031 exchange can defer both). Figures are a year-1 estimate at your 24.0% rate — not tax advice; consult a CPA.
Schools (NCES district)
- District
- Socorro ISD
- NCES district ID
- 4840710
- Math proficiency
- 23% ▼ -34.00%
- Reading proficiency
- 36% ▼ -14.00%
- Median HH income
- $49,318
- Composite
- 25.67/100
- National rank
- #7396
- State rank
- #624 of 826 in TX
Livability — Sparks
- Score
- 55/100
- State rank
- #1377
- US rank
- #23702
Category grades
Schools grade is shown separately in the Schools card above.
Census & demographics
- Census place
- Sparks, TX
- County
- El Paso County · 761,266 people
- Metro
- El Paso, TX
- Population (ZIP)
- 86,599
- Household income
- $76,643
- Rent vs Own
- Severe rent burden
- 838.0
Population outlook (El Paso County) Hauer SSP2
- Today (2025)
- 897,899 people
- By 2030
- 922,694 · +2.8%
- By 2040
- 960,492 · +7.0%
- By 2050
- 982,919 · +9.5%
- By 2075
- 997,266 · +11.1%
- By 2100
- 900,630 · +0.3%
Race, ethnicity, and origin ACS 2023
- Neighborhood character
- Predominantly Hispanic (89%)
- Race & ethnicity
- Hispanic / Latino 89% Two or more races 39% White 7% Black 2% Native American 2%
- Hispanic origin (detail)
- Mexican 84%
- Foreign-born
- 23% · Canada
- Languages at home
- 25% English-only · Spanish 74% Other Asian/Pacific 1%
Political lean MEDSL · El Paso
- 2024 margin
- D (+15.1) · D 57.0% · R 41.8% · Other 1.2%
- 2008→2024 swing
- -17.4pp toward R · 2008: 32.5pp · 2024: 15.1pp
- All cycles
- 2024: D+15.1 2020: D+35.1 2016: D+43.2 2012: D+32.6 2008: D+32.5
Not yet ingested
- Civics
- —
Market trends
- HPI YoY
- ▼ -40.72%
- Current HPI
- 200.6454
- Rent YoY
- ▲ 2.93%
- Metro
- El Paso, TX
- State GDP YoY
- ▲ 3.95%
- F500 in state
- 110
Industry mix (Fortune 500 HQ in TX)
| Industry | F500 HQs | Revenue |
|---|---|---|
| Energy | 16 | $1,198B |
|
||
| Technology | 5 | $198B |
|
||
| Engineering / Construction | 4 | $72B |
|
||
| Energy Services | 3 | $60B |
|
||
| Utilities | 3 | $41B |
|
||
| Healthcare | 2 | $330B |
|
||
Price history
+8.3% since first listed8 events — show timeline
- 2026-05-28 Price Changed $194,900 GEPARMLS
- 2026-05-07 Listed $209,900 GEPARMLS
- 2025-11-30 Pending — GEPARMLS
- 2025-11-25 Contingent — GEPARMLS
- 2025-11-21 Listing Removed — GEPARMLS
- 2025-11-13 Listed $179,900 GEPARMLS
- 1994-06-23 Sold (Public Records) — Public Records
- 1991-07-17 Sold (Public Records) — Public Records
Property tax history
+7.2%/yrLatest (2025): $3,463 · +8.0% YoY. Source: county tax records.
Cash-flow waterfall
monthlySold comps — $/sqft
last 12 mo · ≤1 miLoading sold comps…