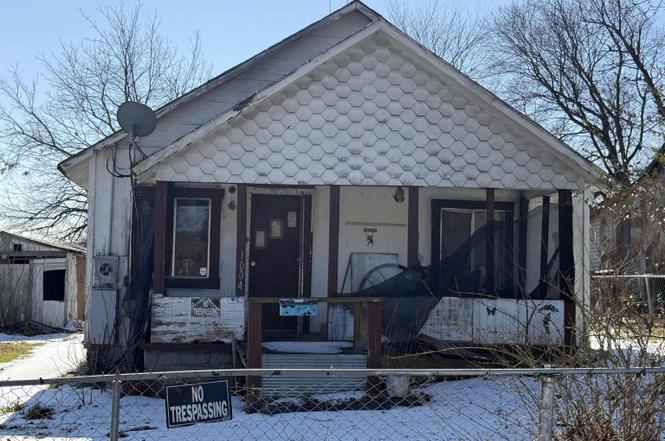
1004 Reeves Ave · Mena, AR
Flood risk 1/10 · Minimal
- FEMA flood zone
- —
- Chance of flooding over 30 yrs
- 0.0%
- Est. flood insurance / yr
- —
Fire risk 4/10 · Minor
- Est. fire insurance / yr
- $1,499 – $2,785
Heat risk 5/10 · Moderate
- Hot days now (above 108°F)
- 7 days/yr
- Hot days in 30 yrs
- 22 days/yr
Wind risk 2/10 · Minimal
- Chance of severe wind over 30 yrs
- 4.0%
Air-quality risk 2/10 · Minimal
- Unhealthy air days now
- 1 days/yr
- Unhealthy air days in 30 yrs
- 1 days/yr
Risk factors via First Street. Map © Google.
Why this score? — see what drove the B grade
The composite is a weighted blend of 9 inputs, each scored 0–100. Each bar is that input's sub-score; the figure is the points it added to the 100-point composite (weight × sub-score).
- Cash flow +30.0/30.0
- 1% rule +10.0/10.0
- DSCR +10.0/10.0
- ARV discount +7.5/15.0
- Appreciation +4.4/10.0
- Schools +3.3/10.0
- Livability +3.2/5.0
- Rent growth +2.5/5.0
- Condition / age +2.5/5.0
$25,000
🖨 Deal sheet 📄 Offer letter ✓ Due diligence
Listing remarks
No value given for the home. Value is in the land. Sale includes the lot behind that is approximately . 15 acres for a total of . 32.
Key facts
- 0.32 acre lot
- Parking
- Built 1900
Property features AI
Finance
- Other: Approx lot size 50x150 (about 0.32 acres)
- Financial info: Annual taxes reported (2025)
- HOA & community: HOA frequency: Other (see remarks)
Exterior
- Parking: 1-car parking
- Utilities: Public sewer; Public water; Electric serviced by cooperative
- Home design: Single-family property; Inside city limits; Subdivision: HORNBECK PLACE
- Construction: Metal/Vinyl siding exterior; Architectural shingle roof; Piers foundation; Built area recorded at 1,188 (per tax records)
- Exterior features: Paved road access; Level lot
Interior
- Flooring: Other flooring (see remarks)
- Bathrooms: 1 full bathroom
- Heating & cooling: No heating; No cooling
- Interior features: Other flooring (see remarks)
Neighborhood map
What this means for you Summary
Snapshot
- This is a 2-bed/1.0-bath single-family listed at $25k.
Deal economics
- At list price, monthly cash flow is $616 ($7k/yr) — positive.
- The deal already cash-flows at list — no discount required.
- Meets the 1% rule at list price ($988 rent vs $25k).
- Recommended offer: $22k (12.0% below list) — sets the bar for market timing.
- Cap rate 35.8% vs local median 3.1% in Mena — top-decile yield for the area; either an underpriced asset or a hidden risk that comps aren't pricing in. Stress-test before assuming the spread holds.
Location & tenants
- Location reads 65/100 on livability (#142 in AR) — a middle-class / working-renter tenant base. Strengths: cost of living A+, housing A+, health & safety A+; Watch: schools D, crime D, amenities F.
- Mena School District (rural): math 42% / reading 38% proficiency, ranked #70 of 238 in AR (top 29%) — families likely to look elsewhere, expect single-tenant / working-renter base with shorter leases.
- Market conditions: 204 active listings in the ZIP; 2 comparable units currently listed for rent nearby; 4 units permitted in Polk County in 2024 (0 in 5+ unit buildings).
Forward outlook
- Local home prices are declining (-1.2%/yr); year-one equity from $173 of loan paydown is wiped out by about $296 of value loss. Plan a longer hold.
- Polk County population projected at -15% by 2050 — secular population decline; favor cash flow + early exit over multi-decade hold.
- At projected returns (-1.2% appreciation + 3.0% rent growth), your $7k cash investment doubles in ~1 year — after that, you're playing with house money.
Negotiation context
- It's been on market 128 days — a 12% lower offer ($22k) is reasonable based on typical stale-listing flexibility.
Risks & watch-outs
- Watch-outs: built in 1900 — expect roof / HVAC / electrical / plumbing capex.
- Climate carrying-cost: extreme-heat days projected 7→22/yr by 2055 (HVAC capex compounding) — expect insurance premiums to compound above CPI over the hold.
Questions for the listing agent
- It's been on market 128 days. Have you received any prior offers? Is the seller open to a 12% concession, seller financing, or rate buy-down credit?
- Built in 1900 — when were the roof, HVAC, electrical panel, plumbing, and water heater last replaced?
- Why hasn't it sold? Are there any deal-killer items the seller is aware of (foundation, flood, title, zoning, code violations)?
- Is there a deadline driving the sale (1031 exchange, divorce, estate, relocation)? That informs how much negotiation room exists.
- Schools are D-rated, which usually means shorter tenancies and higher turnover. Who's the typical renter profile here, and what's been the actual vacancy rate?
- Crime grade is D in this area — have there been break-ins, vandalism, or insurance claims at this property in the last 3 years? What carrier currently insures it and at what premium?
- What's the average days-on-market for RENTAL listings here right now (not sales)? A rising rental-DOM trend means longer vacancies and softer asking-rent achievability than the comps imply.
- What's the recent tenant-quality profile in this submarket — average credit score on applications, eviction rate, late-payment / NSF rate, and stable-employment percentage? A property-management company in the area should have these aggregated.
- How much new for-sale + rental construction is in the pipeline within 1–3 miles? Heavy new supply typically softens prices + rents 12–24 months out; constrained supply supports both.
Investment metrics
- 1% rule
- 3.95% ✓
- Cap rate
- 35.84%
- Cash-on-cash
- 105.54%
- DSCR
- 5.70
- GRM
- 2.1
CMA / ARV
- ARV (on-the-fly)
- $103,356
- Comps found
- 12
Show comp detail 12 sales within ~0.75 mi
| Address | Dist | Beds/Ba | Sqft | Sold | Price | $/sf | Match |
|---|---|---|---|---|---|---|---|
| 1111 Averitt Ave | 0.16mi | 3/2.0 (+1) | 1,216 (+2%) | 3mo | $135,000 | $111 | 77 |
| 1105 Oak Grv | 0.30mi | 3/1.0 (+1) | 1,214 (+2%) | 9mo | $100,000 | $82 | 70 |
| 805 Reine St | 0.51mi | 2/1.0 | 1,250 (+5%) | 4mo | $40,000 | $32 | 64 |
| 705 Twelfth St | 0.28mi | 3/2.0 (+1) | 1,254 (+6%) | 7mo | $174,500 | $139 | 63 |
| 1000 Third St | 0.56mi | 3/— (+1) | 1,190 (+0%) | 9mo | $25,000 | $21 | 61 |
| 1105 S 2nd St | 0.63mi | 2/2.0 | 1,200 (+1%) | 5mo | $29,000 | $24 | 61 |
| 1412 Hamilton Ave | 0.42mi | 3/1.0 (+1) | 1,266 (+7%) | 5mo | $110,000 | $87 | 60 |
| 710 Pine Ave | 0.36mi | 3/1.0 (+1) | 1,020 (-14%) | 2mo | $60,000 | $59 | 53 |
| 1107 Second St | 0.63mi | 1/1.0 (-1) | 1,107 (-7%) | 1mo | $22,500 | $20 | 53 |
| 600 Fourth St | 0.51mi | 3/1.5 (+1) | 1,356 (+14%) | 2mo | $131,500 | $97 | 44 |
| 200 Ridge St | 0.69mi | 2/2.0 | 1,318 (+11%) | 5mo | $135,000 | $102 | 41 |
| 1407 Mena St | 0.70mi | 3/2.0 (+1) | 1,363 (+15%) | 4mo | $175,000 | $128 | 30 |
Match score weights: distance 35% · size 25% · config 20% · recency 20%. Top-matched comps best support the ARV.
Projected returns pro-forma
-1.18% appreciation · 3.0% rent growth · sell at horizon
- IRR
- —
- Equity multiple
- 6.30×
- Total profit
- $37,130
- Equity at exit
- $5,813
- IRR
- —
- Equity multiple
- 13.10×
- Total profit
- $84,687
- Equity at exit
- $5,918
Cash invested: $7,000 (down + closing). Projections, not guarantees.
Landlord ↔ Tenant lean methodology
- Overall (STATE)
- 92 Strongly Landlord-Friendly
- State Arkansas
- 92 Strongly Landlord-Friendly · R+14
- County
- — inherits STATE
- City
- — inherits STATE
ZIP-level market 71953
- Home prices YoY
- -0.4%
- Active inventory
- 204
- Price-to-rent
- 2.1×
Monthly cashflow live
- Estimated rent
- $988 medium interval (Pro) →
- Mortgage (P&I)
- −$131
- Tax from tax record
- −$23 /mo · $280/yr
- Insurance
- −$10
- HOA
- −$0
- Vacancy / Maint / Mgmt
- −$207
- Net cashflow
- $616
Break-even live
UW: 25.0% down · 7.5% · 30yr · 1.5% tax · 5.0% vac · 8.0% maint · 8.0% mgmt
Financing live
Cash to close
- Down payment
- $6,250
- Closing costs
- $750
- Reserves months
- —
- Total cash needed
- —
Loan-product check · same deal, 3 products live
Conventional
25% down · 7.5% · 30yr
- Down + closing
- —
- Monthly P&I
- —
- Monthly cashflow
- —
- DSCR
- —
- Eligible?
- —
Personal DTI + credit; lowest rate.
DSCR
20% down · 8.5% · 30yr
- Down + closing
- —
- Monthly P&I
- —
- Monthly cashflow
- —
- DSCR
- —
- Eligible?
- —
No personal income docs; deal must DSCR.
Hard money
10% down · 12.0% · 12mo
- Down + closing
- —
- Monthly P&I
- —
- Monthly cashflow
- —
- DSCR
- —
- Eligible?
- —
Short-term bridge; refi at stabilization.
Rent comps 2 comps
| Address | Beds | Baths | Sqft | Rent | $/sqft | DOM | Units | Dist |
|---|---|---|---|---|---|---|---|---|
| 99 Pine Ave Mena, AR | 2.0 | 1.0 | 750 | $875 | $1.17 | 43d | 1 | 0.76mi |
| 306 Hornbeck Ave Mena, AR | 3.0 | 2.0 | 776 | $1,100 | $1.42 | 43d | 1 | 0.78mi |
Listing history 16 events
-
2026-06-19days on market $25,000 Active 128 DOM
-
2026-06-18days on market $25,000 Active 127 DOM
-
2026-06-17days on market $25,000 Active 126 DOM
-
2026-06-16days on market $25,000 Active 125 DOM
-
2026-06-15days on market $25,000 Active 124 DOM
-
2026-06-14days on market $25,000 Active 122 DOM
-
2026-06-12days on market $25,000 Active 121 DOM
-
2026-06-09days on market $25,000 Active 118 DOM
-
2026-06-08days on market $25,000 Active 117 DOM
-
2026-06-07days on market $25,000 Active 116 DOM
-
2026-06-04days on market $25,000 Active 112 DOM
-
2026-06-02days on market $25,000 Active 111 DOM
-
2026-06-01days on market $25,000 Active 110 DOM
-
2026-05-31days on market $25,000 Active 109 DOM
-
2026-05-31days on market $25,000 Active 108 DOM
-
2026-02-11$25,000 New Listing
ⓘ Source: listings_history table (triggers on properties + properties_extension) + one-shot
backfill from property_details.listing_events for pre-trigger history.
Tax reassessment forecast AR · Resets to sale price
- Current annual tax
- $280 · $23/mo
- Projected year-2 tax
- $280 · $23/mo
- Expected delta
- $0/yr ($0/mo · 0.0%)
ⓘ Screening estimate from a state-policy table — verify with the county assessor before closing.
Climate risk First Street
- Flood 1/10 Low 0% chance over 30 yrs
- Wildfire 4/10 Moderate
- Heat 5/10 Major 7 d/yr ≥108°F today · 22 d/yr by 30 yrs out
- Wind 2/10 Low 4% chance of damaging wind over 30 yrs
- Air quality 2/10 Low 1 unhealthy d/yr today · 1 by 30 yrs out
Nearby sold comps map
Loading sold comps map…
Walkable amenities ~0.75 mi
Loading nearby amenities…
Taxation est. · year 1
- Rental income
- $11,855
- − Mortgage interest
- −$1,400
- − Property taxes
- −$280
- − Insurance
- −$125
- − Repairs & maintenance
- −$948
- − Management
- −$948
- − Depreciation
- −$727
- Taxable income
- $7,426
- Est. tax owed @ 24.0%
- −$1,782
- After-tax cash flow
- $5,605/yr
For passive investors: Depreciation is non-cash, so a rental often shows a tax loss while cash-flowing — sheltering income. Rental losses are passive: they offset passive income freely, and up to $25,000/yr can offset ordinary (W-2) income if you actively participate and your MAGI is under $100k (phasing out to $0 by $150k); unused losses carry forward. On sale, claimed depreciation is recaptured at up to 25%, and gains may owe capital-gains tax (a 1031 exchange can defer both). Figures are a year-1 estimate at your 24.0% rate — not tax advice; consult a CPA.
Schools (NCES district)
- District
- Mena School District
- NCES district ID
- 0509750
- Math proficiency
- 42% ▼ -9.00%
- Reading proficiency
- 38% ▼ -9.00%
- Median HH income
- $32,941
- Composite
- 32.88/100
- National rank
- #5607
- State rank
- #70 of 238 in AR
Livability — Mena
- Score
- 65/100
- State rank
- #142
- US rank
- #12615
Category grades
Schools grade is shown separately in the Schools card above.
Census & demographics
- Census place
- Mena, AR
- Population (ZIP)
- 13,412
Population outlook (Polk County) Hauer SSP2
- Today (2025)
- 19,065 people
- By 2030
- 18,369 · -3.7%
- By 2040
- 17,156 · -10.0%
- By 2050
- 16,177 · -15.1%
- By 2075
- 14,642 · -23.2%
- By 2100
- 13,020 · -31.7%
Race, ethnicity, and origin ACS 2023
- Neighborhood character
- Predominantly White (91%)
- Race & ethnicity
- White 91% Two or more races 5% Hispanic / Latino 3% Native American 1%
- Common ancestry
- Lithuanian 3% Slovak 2% Iranian 1%
- Foreign-born
- 2% · Canada
- Languages at home
- 98% English-only · Spanish 1% German/W. Germanic 1%
Political lean MEDSL · Polk
- 2024 margin
- Solid R (+70.5) · D 13.8% · R 84.3% · Other 1.9%
- 2008→2024 swing
- -24.7pp toward R · 2008: -45.8pp · 2024: -70.5pp
- All cycles
- 2024: R+70.5 2020: R+68.2 2016: R+66.4 2012: R+56.9 2008: R+45.8
Not yet ingested
- Civics
- —
Market trends
- HPI YoY
- ▼ -1.18%
- Current HPI
- 278.2854
- Rent YoY
- —
- Metro
- —
- State GDP YoY
- ▲ 3.80%
- F500 in state
- 10
Industry mix (Fortune 500 HQ in AR)
| Industry | F500 HQs | Revenue |
|---|---|---|
| Retail | 1 | $681B |
|
||
| Food / Agriculture | 1 | $53B |
|
||
| Retail / Energy | 1 | $22B |
|
||
| Transportation / Logistics | 1 | $12B |
|
||
| Energy | 1 | $4B |
|
||
Price history
1 event — show timeline
- 2026-02-11 Listed $25,000 CARMLS
Property tax history
+7.4%/yrLatest (2025): $280 · +8.3% YoY. Source: county tax records.
Cash-flow waterfall
monthlySold comps — $/sqft
last 12 mo · ≤1 miLoading sold comps…