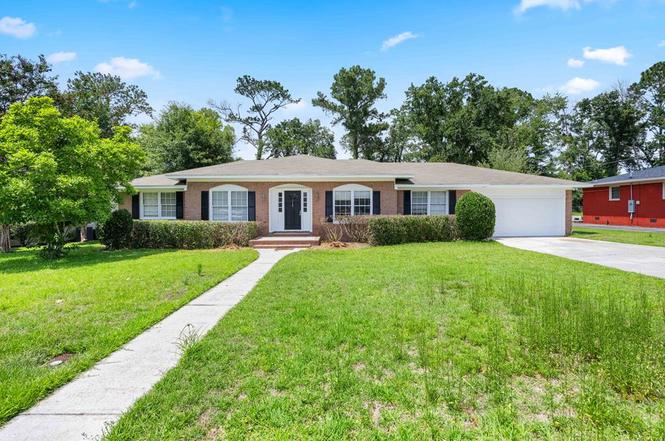
112 Breckenridge Dr · Valdosta, GA
Flood risk 1/10 · Minimal
- FEMA flood zone
- X (unshaded)
- Chance of flooding over 30 yrs
- 0.0%
- Est. flood insurance / yr
- $507 – $1,088
Fire risk 6/10 · Moderate
- Est. fire insurance / yr
- $963 – $1,789
Heat risk 8/10 · Major
- Hot days now (above 108°F)
- 7 days/yr
- Hot days in 30 yrs
- 19 days/yr
Wind risk 8/10 · Major
- Chance of severe wind over 30 yrs
- 99.0%
Air-quality risk 6/10 · Moderate
- Unhealthy air days now
- 10 days/yr
- Unhealthy air days in 30 yrs
- 11 days/yr
Risk factors via First Street. Map © Google.
Why this score? — see what drove the B- grade
The composite is a weighted blend of 9 inputs, each scored 0–100. Each bar is that input's sub-score; the figure is the points it added to the 100-point composite (weight × sub-score).
- Cash flow +26.8/30.0
- ARV discount +15.0/15.0
- DSCR +9.2/10.0
- 1% rule +7.0/10.0
- Rent growth +3.5/5.0
- Livability +3.0/5.0
- Condition / age +2.5/5.0
- Schools +1.5/10.0
- Appreciation +0.0/10.0
$180,000
🖨 Deal sheet 📄 Offer letter ✓ Due diligence
Listing remarks
Situated in Windsor Park, this 3-bedroom, 2-bath brick home offers plenty of potential for a buyer looking to make a home their own. The property could use some updating, but its location, layout, and all-brick construction make it a worthwhile investment. Priced accordingly and ready for its next owner, this is a great opportunity to purchase in one of Valdosta's established in-town neighborhoods.
Key facts
- 0.34 acre lot
- Built 1991
- Listed 3 days
Tags
Property features AI
Exterior
- Utilities: Public water; Public sewer
- Home design: Single-family residence; One story
- Construction: Brick veneer exterior; Shingle roof
- Exterior features: Fenced yard
Interior
- Bathrooms: 2 full bathrooms
- Interior features: Refrigerator
Neighborhood map
What this means for you Summary
Snapshot
- This is a 3-bed/2.0-bath single-family listed at $180k.
Deal economics
- At list price, monthly cash flow is $493 ($6k/yr) — positive.
- The deal already cash-flows at list — no discount required.
- Meets the 1% rule at list price ($2k rent vs $180k).
- Cap rate 9.6% vs local median 4.3% in Valdosta — top-decile yield for the area; either an underpriced asset or a hidden risk that comps aren't pricing in. Stress-test before assuming the spread holds.
Location & tenants
- Location reads 60/100 on livability (#392 in GA) — a middle-class / working-renter tenant base. Strengths: cost of living A+, health & safety A+, housing A-; Watch: schools F, crime F, amenities F.
- Valdosta City (urban): math 15% / reading 22% proficiency, ranked #149 of 174 in GA (top 86%) — low school quality limits family demand, transient renter base, plan for 1-2y turnover; 74% free/reduced lunch — lower-income household profile, screen leases tightly.
- Market conditions: Rents rising fast (+4.2%/yr); 267 active listings in the ZIP; 5 comparable units currently listed for rent nearby; rentals lingering (median 44d on market — plan ~5-8 weeks vacancy on turnover, expect pricing pressure); 60% of comp listings sitting > 30 days — soft ceiling on asking rent; 896 units permitted in Lowndes County in 2024 (0 in 5+ unit buildings).
- At $2,161/mo this rent would consume 46% of the median local household income ($57k/yr) (locally 2034% of renters already pay >50% of income on rent) — very limited rent-growth headroom before tenants either downsize or default.
Forward outlook
- Local home prices are declining (-3.0%/yr); year-one equity from $1k of loan paydown is wiped out by about $5k of value loss. Plan a longer hold.
- Lowndes County population projected at +10% by 2050 — modest demand growth; plan on rents tracking national, not racing it.
- At projected returns (-3.0% appreciation + 4.2% rent growth), your $50k cash investment doubles in ~9 years — after that, you're playing with house money.
Negotiation context
- Only 3 days on market — expect competitive offers; lowballing is unlikely to land.
- Current owner paid $151k; 19% above their basis — modest negotiation headroom, anchor on the comps not their cost.
Risks & watch-outs
- Climate carrying-cost: severe wind risk, 99% chance of damaging wind over 30y; major wildfire risk; extreme-heat days projected 7→19/yr by 2055 (HVAC capex compounding) — expect insurance premiums to compound above CPI over the hold.
Questions for the listing agent
- Is there a deadline driving the sale (1031 exchange, divorce, estate, relocation)? That informs how much negotiation room exists.
- Schools are F-rated, which usually means shorter tenancies and higher turnover. Who's the typical renter profile here, and what's been the actual vacancy rate?
- Crime grade is F in this area — have there been break-ins, vandalism, or insurance claims at this property in the last 3 years? What carrier currently insures it and at what premium?
- What's the average days-on-market for RENTAL listings here right now (not sales)? A rising rental-DOM trend means longer vacancies and softer asking-rent achievability than the comps imply.
- What's the recent tenant-quality profile in this submarket — average credit score on applications, eviction rate, late-payment / NSF rate, and stable-employment percentage? A property-management company in the area should have these aggregated.
- How much new for-sale + rental construction is in the pipeline within 1–3 miles? Heavy new supply typically softens prices + rents 12–24 months out; constrained supply supports both.
Investment metrics
- 1% rule
- 1.20% ✓
- Cap rate
- 9.58%
- Cash-on-cash
- 11.75%
- DSCR
- 1.52
- GRM
- 6.9
CMA / ARV
- ARV (on-the-fly)
- $293,355
- Comps found
- 12
Show comp detail 12 sales within ~0.75 mi
| Address | Dist | Beds/Ba | Sqft | Sold | Price | $/sf | Match |
|---|---|---|---|---|---|---|---|
| 111 Fairway Dr | 0.10mi | 3/2.0 | 2,056 (-5%) | 4mo | $262,000 | $127 | 83 |
| 117 Breckenridge Dr | 0.05mi | 3/2.0 | 2,358 (+8%) | 4mo | $300,000 | $127 | 80 |
| 100 Sunnymeade Dr | 0.13mi | 4/2.5 (+1) | 2,274 (+5%) | 8mo | $164,800 | $72 | 72 |
| 3504 Breckland Dr | 0.38mi | 3/2.0 | 2,088 (-4%) | 7mo | $282,450 | $135 | 70 |
| 3557 Victoria Dr | 0.30mi | 3/2.0 | 2,020 (-7%) | 6mo | $308,000 | $152 | 69 |
| 529 Shirley Pl | 0.47mi | 4/2.0 (+1) | 2,246 (+3%) | 2mo | $345,000 | $154 | 66 |
| 115 Brookview Ter | 0.23mi | 3/3.0 | 2,371 (+9%) | 6mo | $259,900 | $110 | 65 |
| 3332 Britain Dr | 0.46mi | 3/2.5 | 2,050 (-6%) | 4mo | $299,900 | $146 | 64 |
| 3573 Victoria Dr | 0.26mi | 4/2.0 (+1) | 2,319 (+7%) | 10mo | $329,500 | $142 | 64 |
| 3692 Arbor Run Dr | 0.34mi | 4/2.5 (+1) | 2,397 (+10%) | 1mo | $385,000 | $161 | 59 |
| 3261 Jordan Way | 0.56mi | 3/2.0 | 1,985 (-9%) | 10mo | $250,000 | $126 | 51 |
| 324 Jennifer Cir | 0.36mi | 3/2.5 | 1,849 (-15%) | 6mo | $240,000 | $130 | 51 |
Match score weights: distance 35% · size 25% · config 20% · recency 20%. Top-matched comps best support the ARV.
Projected returns pro-forma
-3.0% appreciation · 4.19% rent growth · sell at horizon
- IRR
- 2.5%
- Equity multiple
- 1.10×
- Total profit
- $4,894
- Equity at exit
- $26,839
- IRR
- 13.2%
- Equity multiple
- 2.11×
- Total profit
- $55,797
- Equity at exit
- $15,563
Cash invested: $50,400 (down + closing). Projections, not guarantees.
Landlord ↔ Tenant lean methodology
- Overall (STATE)
- 90 Strongly Landlord-Friendly
- State Georgia
- 90 Strongly Landlord-Friendly · R+3
- County
- — inherits STATE
- City
- — inherits STATE
ZIP-level market 31602
- Rents YoY
- 4.2%
- Active inventory
- 267
- Price-to-rent
- 6.9×
Monthly cashflow live
- Estimated rent
- $2,161 high interval (Pro) →
- Mortgage (P&I)
- −$944
- Tax from tax record
- −$195 /mo · $2,339/yr
- Insurance
- −$75
- HOA
- −$0
- Vacancy / Maint / Mgmt
- −$454
- Net cashflow
- $493
Break-even live
UW: 25.0% down · 7.5% · 30yr · 1.5% tax · 5.0% vac · 8.0% maint · 8.0% mgmt
Financing live
Cash to close
- Down payment
- $45,000
- Closing costs
- $5,400
- Reserves months
- —
- Total cash needed
- —
Loan-product check · same deal, 3 products live
Conventional
25% down · 7.5% · 30yr
- Down + closing
- —
- Monthly P&I
- —
- Monthly cashflow
- —
- DSCR
- —
- Eligible?
- —
Personal DTI + credit; lowest rate.
DSCR
20% down · 8.5% · 30yr
- Down + closing
- —
- Monthly P&I
- —
- Monthly cashflow
- —
- DSCR
- —
- Eligible?
- —
No personal income docs; deal must DSCR.
Hard money
10% down · 12.0% · 12mo
- Down + closing
- —
- Monthly P&I
- —
- Monthly cashflow
- —
- DSCR
- —
- Eligible?
- —
Short-term bridge; refi at stabilization.
Rent comps 5 comps
| Address | Beds | Baths | Sqft | Rent | $/sqft | DOM | Units | Dist |
|---|---|---|---|---|---|---|---|---|
| 3650 Victoria Dr Valdosta, GA | 4.0 | 2.5 | 2434 | $2,895 | $1.19 | 21d | 1 | 0.29mi |
| 3261 Jordan Way Valdosta, GA | 3.0 | 2.0 | 1985 | $2,100 | $1.06 | 43d | 1 | 0.58mi |
| 407 Northfield Rd Valdosta, GA | 3.0 | 2.0 | 1505 | $1,395 | $0.93 | 21d | 1 | 1.20mi |
| 302 Hartsfield Ln Valdosta, GA | 3.0 | 2.0 | 1975 | $1,775 | $0.90 | 43d | 1 | 1.21mi |
| 312 Eager Rd Valdosta, GA | 3.0 | 3.0 | 1959 | $1,895 | $0.97 | 43d | 1 | 1.42mi |
Listing history 5 events
-
2026-06-18status $180,000 Pending 3 DOM
-
2026-06-18days on market $180,000 Active 3 DOM
-
2026-06-17days on market $180,000 Active 2 DOM
-
2026-06-15remarks 401-char remark
-
2026-06-15$180,000 Active 1 DOM
ⓘ Source: listings_history table (triggers on properties + properties_extension) + one-shot
backfill from property_details.listing_events for pre-trigger history.
Tax reassessment forecast GA · Resets to sale price
- Current annual tax
- $2,339 · $195/mo
- Projected year-2 tax
- $2,339 · $195/mo
- Expected delta
- $0/yr ($0/mo · 0.0%)
ⓘ Screening estimate from a state-policy table — verify with the county assessor before closing.
Climate risk First Street
- Flood 1/10 Low FEMA zone X (unshaded) · 0% chance over 30 yrs
- Wildfire 6/10 Major
- Heat 8/10 Severe 7 d/yr ≥108°F today · 19 d/yr by 30 yrs out
- Wind 8/10 Severe 99% chance of damaging wind over 30 yrs
- Air quality 6/10 Major 10 unhealthy d/yr today · 11 by 30 yrs out
Nearby sold comps map
Loading sold comps map…
Walkable amenities ~0.75 mi
Loading nearby amenities…
Taxation est. · year 1
- Rental income
- $25,934
- − Mortgage interest
- −$10,083
- − Property taxes
- −$2,339
- − Insurance
- −$900
- − Repairs & maintenance
- −$2,075
- − Management
- −$2,075
- − Depreciation
- −$5,236
- Taxable income
- $3,226
- Est. tax owed @ 24.0%
- −$774
- After-tax cash flow
- $5,147/yr
For passive investors: Depreciation is non-cash, so a rental often shows a tax loss while cash-flowing — sheltering income. Rental losses are passive: they offset passive income freely, and up to $25,000/yr can offset ordinary (W-2) income if you actively participate and your MAGI is under $100k (phasing out to $0 by $150k); unused losses carry forward. On sale, claimed depreciation is recaptured at up to 25%, and gains may owe capital-gains tax (a 1031 exchange can defer both). Figures are a year-1 estimate at your 24.0% rate — not tax advice; consult a CPA.
Schools (NCES district)
- District
- Valdosta City
- NCES district ID
- 1305310
- Math proficiency
- 15% ▼ -12.00%
- Reading proficiency
- 22% ▼ -7.00%
- Median HH income
- $30,634
- Composite
- 14.79/100
- National rank
- #9388
- State rank
- #149 of 174 in GA
Livability — Valdosta
- Score
- 60/100
- State rank
- #392
- US rank
- #19544
Category grades
Schools grade is shown separately in the Schools card above.
Census & demographics
- Census place
- Valdosta, GA
- County
- Lowndes County · 107,801 people
- City population
- 91,859
- Metro
- Valdosta, GA
- Population (ZIP)
- 35,728
- Household income
- $56,939
- Rent vs Own
- Severe rent burden
- 2034.0
Population outlook (Lowndes County) Hauer SSP2
- Today (2025)
- 120,348 people
- By 2030
- 123,469 · +2.6%
- By 2040
- 128,482 · +6.8%
- By 2050
- 131,907 · +9.6%
- By 2075
- 139,080 · +15.6%
- By 2100
- 133,649 · +11.1%
Race, ethnicity, and origin ACS 2023
- Neighborhood character
- Diverse neighborhood (Simpson 0.61)
- Race & ethnicity
- White 45% Black 42% Hispanic / Latino 7% Two or more races 5% Asian 2%
- Hispanic origin (detail)
- Mexican 3% Puerto Rican 1%
- Common ancestry
- Italian 1% Slovak 1% Lithuanian 1%
- Foreign-born
- 4% · Canada
- Languages at home
- 94% English-only · Spanish 3% Other Indo-European 1% French/Haitian/Cajun 1%
Political lean MEDSL · Lowndes
- 2024 margin
- R (+18.0) · D 40.8% · R 58.8%
- 2008→2024 swing
- -8.6pp toward R · 2008: -9.4pp · 2024: -18.0pp
- All cycles
- 2024: R+18.0 2020: R+12.0 2016: R+18.2 2012: R+10.5 2008: R+9.4
Not yet ingested
- Civics
- —
Market trends
- HPI YoY
- ▼ -150.60%
- Current HPI
- 188.2012
- Rent YoY
- ▲ 4.19%
- Metro
- Valdosta, GA
- State GDP YoY
- ▲ 2.66%
- F500 in state
- 28
Industry mix (Fortune 500 HQ in GA)
| Industry | F500 HQs | Revenue |
|---|---|---|
| Paper / Packaging | 2 | $29B |
|
||
| Retail | 1 | $160B |
|
||
| Transportation / Logistics | 1 | $91B |
|
||
| Airlines | 1 | $62B |
|
||
| Consumer Goods | 1 | $47B |
|
||
| Utilities | 1 | $25B |
|
||
Price history
+74.8% since first listed3 events — show timeline
- 2026-06-15 Listed $180,000 SGMLS
- 2008-01-29 Sold (Public Records) $151,000 Public Records
- 1996-12-27 Sold (Public Records) $103,000 Public Records
Property tax history
+3.6%/yrLatest (2025): $2,339 · +3.8% YoY. Source: county tax records.
Cash-flow waterfall
monthlySold comps — $/sqft
last 12 mo · ≤1 miLoading sold comps…