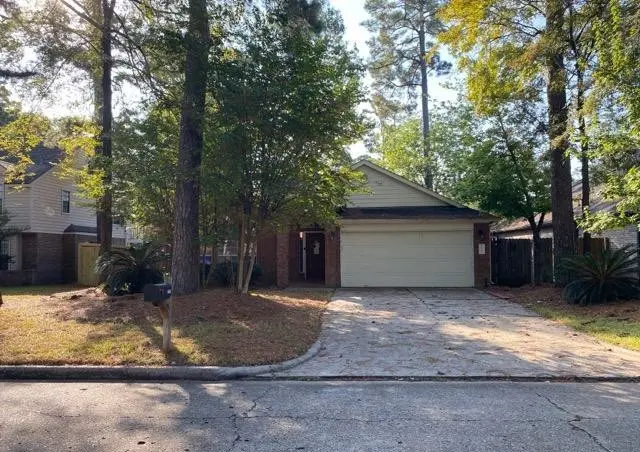
12307 Longfellow Dr · Conroe, TX
Flood risk 1/10 · Minimal
- FEMA flood zone
- X (unshaded)
- Chance of flooding over 30 yrs
- 0.0%
- Est. flood insurance / yr
- $507 – $1,088
Fire risk 1/10 · Minimal
- Est. fire insurance / yr
- $1,222 – $2,270
Heat risk 8/10 · Major
- Hot days now (above 110°F)
- 7 days/yr
- Hot days in 30 yrs
- 24 days/yr
Wind risk 8/10 · Major
- Chance of severe wind over 30 yrs
- 99.0%
Air-quality risk 2/10 · Minimal
- Unhealthy air days now
- 1 days/yr
- Unhealthy air days in 30 yrs
- 1 days/yr
Risk factors via First Street. Map © Google.
Why this score? — see what drove the D- grade
The composite is a weighted blend of 9 inputs, each scored 0–100. Each bar is that input's sub-score; the figure is the points it added to the 100-point composite (weight × sub-score).
- ARV discount +14.6/15.0
- Cash flow +7.4/30.0
- Schools +5.4/10.0
- Livability +3.7/5.0
- 1% rule +3.2/10.0
- Condition / age +2.5/5.0
- Rent growth +1.7/5.0
- DSCR +1.5/10.0
- Appreciation +0.0/10.0
$249,900
🖨 Deal sheet (PDF) 📄 Offer letter ✓ Due diligence
Listing remarks MLS
Balanced living meets everyday convenience in this 3-bed, 2.5-bath home featuring bright interiors, a center-island kitchen, and a 2-car attached garage. Located in Montgomery with access to Lake Conroe’s marinas and waterfront recreation, plus nearby parks like Memory Park and Cedar Brake Park. Close to April Sound Country Club, local dining along Hwy 105, and area trails at the Sam Houston National Forest. A good setting with room to make the home fit your style. Schedule your showing today.
Key facts
- Area trails
- Nearby parks
- Local dining
Tags
Neighborhood map
What this means for you Summary
Snapshot
- This is a 3-bed/2.0-bath single-family listed at $250k.
Deal economics
- At list price, monthly cash flow is $-326 ($-4k/yr) — negative.
- To cash-flow at today's rent, offer at most $192k (23.1% below list).
- To meet the 1% rule (rent ≥ 1% of price), the offer needs to be $204k (18.2% below list).
- Recommended offer: $192k (23.1% below list) — sets the bar for cash-flow.
- Cap rate 4.7% vs local median 3.1% in Conroe — top-decile yield for the area; either an underpriced asset or a hidden risk that comps aren't pricing in. Stress-test before assuming the spread holds.
Location & tenants
- Location reads 74/100 on livability (#169 in TX, #4,447 nationally) — a middle-class / working-renter tenant base. Strengths: cost of living A+, housing A+, amenities B; Watch: schools D+, commute F, health & safety F.
- Montgomery ISD (rural): math 63% / reading 57% proficiency, ranked #49 of 826 in TX (top 6%) — acceptable for families but not a draw, mixed tenant base, ~2y average lease.
- Market conditions: Rents falling (-3.3%/yr); 1069 active listings in the ZIP; 11 comparable units currently listed for rent nearby; rentals at typical pace (median 26d on market — plan ~3-4 weeks tenant-placement turnaround); 45% of comp listings sitting > 30 days — soft ceiling on asking rent; solid renter incomes; 13,259 units permitted in Montgomery County in 2024 (1,402 in 5+ unit buildings).
Forward outlook
- Local home prices are declining (-3.0%/yr); year-one equity from $2k of loan paydown is wiped out by about $7k of value loss. Plan a longer hold.
- Montgomery County population projected at +65% by 2050 — long-run rental-demand tailwind backs the buy-and-hold thesis.
Negotiation context
- It's been on market 228 days — a 12% lower offer ($220k) is reasonable based on typical stale-listing flexibility.
- 5 sale attempts since 2y ago with the ask held roughly flat each time — persistent listings suggest the price (not the market) is what's stuck; bring a comps-based counter.
Risks & watch-outs
- Climate carrying-cost: severe wind risk, 99% chance of damaging wind over 30y; extreme-heat days projected 7→24/yr by 2055 (HVAC capex compounding) — expect insurance premiums to compound above CPI over the hold.
Questions for the listing agent
- What do current leases actually rent for vs. the listed asking? Can we see a recent rent roll and the last 12 months of T-12 income?
- It's been on market 228 days. Have you received any prior offers? Is the seller open to a 23% concession, seller financing, or rate buy-down credit?
- What does the HOA fee cover, when was the last increase, and are there any pending special assessments or reserve-fund shortfalls?
- Why hasn't it sold? Are there any deal-killer items the seller is aware of (foundation, flood, title, zoning, code violations)?
- Is there a deadline driving the sale (1031 exchange, divorce, estate, relocation)? That informs how much negotiation room exists.
- Schools are D-rated, which usually means shorter tenancies and higher turnover. Who's the typical renter profile here, and what's been the actual vacancy rate?
- The area grade is low — what's the realistic commute time and amenity access for the typical tenant pool here? Any planned neighborhood developments (good or bad) we should know about?
- What's the average days-on-market for RENTAL listings here right now (not sales)? A rising rental-DOM trend means longer vacancies and softer asking-rent achievability than the comps imply.
- What's the recent tenant-quality profile in this submarket — average credit score on applications, eviction rate, late-payment / NSF rate, and stable-employment percentage? A property-management company in the area should have these aggregated.
- How much new for-sale + rental construction is in the pipeline within 1–3 miles? Heavy new supply typically softens prices + rents 12–24 months out; constrained supply supports both.
Investment metrics
- 1% rule
- 0.82% ✗
- Cap rate
- 4.73%
- Cash-on-cash
- -5.60%
- DSCR
- 0.75
- GRM
- 10.2
CMA / ARV
- ARV (median comp)
- $296,984
- List price
- $249,900
- Delta
- -15.85%
- Verdict
- UNDERPRICED
- Comps
- 20 within 1.0 mi
Show comp detail 12 sales within ~0.75 mi
| Address | Dist | Beds/Ba | Sqft | Sold | Price | $/sf | Match |
|---|---|---|---|---|---|---|---|
| 3202 Pine Hollow Cir | 0.07mi | 3/2.0 | 1,874 (+4%) | 1mo | $339,999 | $181 | 90 |
| 3226 Woodwind Rd | 0.11mi | 3/2.0 | 1,868 (+4%) | 2mo | $285,000 | $153 | 88 |
| 3310 Woodwick | 0.17mi | 3/2.0 | 1,750 (-3%) | 1mo | $235,000 | $134 | 86 |
| 3322 Willowbend Rd | 0.15mi | 3/2.5 | 1,907 (+6%) | 5mo | $279,000 | $146 | 77 |
| 3218 W Woodchuck Rd W | 0.23mi | 3/2.0 | 1,983 (+10%) | 1mo | $239,900 | $121 | 72 |
| 12807 Oak Village Dr | 0.58mi | 3/2.0 | 1,927 (+7%) | 2mo | $325,000 | $169 | 60 |
| 12710 Lake Shore Dr | 0.49mi | 3/2.5 | 1,929 (+7%) | 5mo | $309,000 | $160 | 59 |
| 11342 Shadyside Ln | 0.72mi | 3/2.5 | 1,820 (+1%) | 5mo | $294,990 | $162 | 59 |
| 12602 Browning Dr | 0.34mi | 4/2.5 (+1) | 2,019 (+12%) | 5mo | $449,000 | $222 | 53 |
| 3062 Poe Dr | 0.49mi | 3/2.0 | 1,537 (-15%) | 2mo | $229,500 | $149 | 51 |
| 11819 Doretta Dr | 0.59mi | 3/2.5 | 1,606 (-11%) | 4mo | $244,900 | $152 | 49 |
| 11705 Marina View Dr | 0.70mi | 4/3.0 (+1) | 2,050 (+14%) | 3mo | $379,990 | $185 | 33 |
Match score weights: distance 35% · size 25% · config 20% · recency 20%. Top-matched comps best support the ARV.
Projected returns pro-forma
-3.0% appreciation · 0.0% rent growth · sell at horizon
- IRR
- -29.7%
- Equity multiple
- 0.04×
- Total profit
- $-67,110
- Equity at exit
- $37,261
- IRR
- -53.3%
- Equity multiple
- -0.54×
- Total profit
- $-107,693
- Equity at exit
- $21,607
Cash invested: $69,972 (down + closing). Projections, not guarantees.
Landlord ↔ Tenant lean methodology
- Overall (STATE)
- 87 Strongly Landlord-Friendly
- State Texas
- 87 Strongly Landlord-Friendly · R+5
- County
- — inherits STATE
- City
- — inherits STATE
ZIP-level market 77356
- Home prices YoY
- -30.3%
- Rents YoY
- -3.3%
- Active inventory
- 1069
- Price-to-rent
- 10.2×
Monthly cashflow live
- Estimated rent
- $2,044 high interval (Pro) →
- Mortgage (P&I)
- −$1,311
- Tax from tax record
- −$456 /mo · $5,475/yr
- Insurance
- −$104
- HOA
- −$70
- Vacancy / Maint / Mgmt
- −$429
- Net cashflow
- $-326
Break-even live
Sensitivity live
| Price | -10% $-185 | -5% $-256 | +0% $-326 | +5% $-397 | +10% $-468 |
|---|---|---|---|---|---|
| Rent | -10% $-488 | -5% $-407 | +0% $-326 | +5% $-246 | +10% $-165 |
| Rate | -1.0pp $-201 | -0.5pp $-263 | base $-326 | +0.5pp $-391 | +1.0pp $-457 |
UW: 25.0% down · 7.5% · 30yr · 1.5% tax · 5.0% vac · 8.0% maint · 8.0% mgmt
Financing live
Cash to close
- Down payment
- $62,475
- Closing costs
- $7,497
- Reserves months
- —
- Total cash needed
- —
Loan-product check · same deal, 3 products live
Conventional
25% down · 7.5% · 30yr
- Down + closing
- —
- Monthly P&I
- —
- Monthly cashflow
- —
- DSCR
- —
- Eligible?
- —
Personal DTI + credit; lowest rate.
DSCR
20% down · 8.5% · 30yr
- Down + closing
- —
- Monthly P&I
- —
- Monthly cashflow
- —
- DSCR
- —
- Eligible?
- —
No personal income docs; deal must DSCR.
Hard money
10% down · 12.0% · 12mo
- Down + closing
- —
- Monthly P&I
- —
- Monthly cashflow
- —
- DSCR
- —
- Eligible?
- —
Short-term bridge; refi at stabilization.
Rent comps 11 comps
| Address | Beds | Baths | Sqft | Rent | $/sqft | DOM | Units | Dist |
|---|---|---|---|---|---|---|---|---|
| 12255 Trail Hollow Dr Montgomery, TX | 3.0 | 2.0 | 1657 | $1,950 | $1.18 | 16d | 1 | 0.56mi |
| 11243 Glenforest Dr Montgomery, TX | 3.0 | 2.0 | 1442 | $1,699 | $1.18 | 6d | 1 | 0.76mi |
| 11231 Glenforest Dr Montgomery, TX | 3.0 | 2.0 | 1479 | $1,499 | $1.01 | 23d | 1 | 0.78mi |
| 124 April Point Dr N Montgomery, TX | 4.0 | 3.0 | 1624 | $2,900 | $1.79 | 45d | 1 | 1.15mi |
| 124 April Point Dr S #124 Montgomery, TX | 2.0 | 1.0 | 1300 | $1,490 | $1.15 | 22d | 1 | 1.16mi |
| 130 April Point Dr N Montgomery, TX | 3.0 | 3.0 | 1680 | $2,250 | $1.34 | 45d | 1 | 1.18mi |
| 135 April Point Dr N Montgomery, TX | 3.0 | 3.0 | 1624 | $1,900 | $1.17 | 45d | 1 | 1.21mi |
| 62 April Point Dr S Montgomery, TX | 2.0 | 2.5 | 2153 | $1,850 | $0.86 | 25d | 1 | 1.27mi |
| 3804 Mystic Cir Montgomery, TX | 3.0 | 2.0 | 1888 | $2,100 | $1.11 | 45d | 1 | 1.33mi |
| 116 Lake View Cir Montgomery, TX | 3.0 | 2.5 | 1751 | $2,250 | $1.28 | 45d | 1 | 1.45mi |
| 3679 Windswept Dr Montgomery, TX | 3.0 | 2.0 | 1842 | $2,000 | $1.09 | 20d | 1 | 1.45mi |
HOA detail
- Monthly dues
- $70 · $840/yr
- Likely covers
- water
Listing history 31 events
-
2026-06-21days on market $249,900 Active 228 DOM
-
2026-06-18days on market $249,900 Active 225 DOM
-
2026-06-17days on market $249,900 Active 224 DOM
-
2026-06-16days on market $249,900 Active 223 DOM
-
2026-06-15days on market $249,900 Active 222 DOM
-
2026-06-13days on market $249,900 Active 220 DOM
-
2026-06-13days on market $249,900 Active 219 DOM
-
2026-06-09days on market $249,900 Active 216 DOM
-
2026-06-08days on market $249,900 Active 215 DOM
-
2026-06-07days on market $249,900 Active 214 DOM
-
2026-06-04days on market $249,900 Active 211 DOM
-
2026-06-03days on market $249,900 Active 210 DOM
-
2026-06-02days on market $249,900 Active 209 DOM
-
2026-06-01days on market $249,900 Active 208 DOM
-
2026-05-31days on market $249,900 Active 207 DOM
-
2025-11-05$249,900 Active 504-char remark
Show marketing remark (504 chars)
Balanced living meets everyday convenience in this 3-bed, 2.5-bath home featuring bright interiors, a center-island kitchen, and a 2-car attached garage. Located in Montgomery with access to Lake Conroe’s marinas and waterfront recreation, plus nearby parks like Memory Park and Cedar Brake Park. Close to April Sound Country Club, local dining along Hwy 105, and area trails at the Sam Houston National Forest. A good setting with room to make the home fit your style. Schedule your showing today.
-
2024-10-09historical
-
2024-10-03price $265,900
-
2024-10-03status Active
-
2024-09-26status Pending
-
2024-09-17status Option Pending
-
2024-09-10price $269,900
-
2024-09-10status Active
-
2024-09-10historical $2,000
-
2024-09-05$2,000
-
2024-09-04historical
-
2024-08-27price $292,000
-
2024-05-14price $326,000
-
2024-05-14$330,000 Active
-
2024-04-23soldstatus
-
2002-10-10soldstatus
ⓘ Source: listings_history table (triggers on properties + properties_extension) + one-shot
backfill from property_details.listing_events for pre-trigger history.
Tax reassessment forecast TX · Resets to sale price
- Current annual tax
- $5,475 · $456/mo
- Projected year-2 tax
- $5,475 · $456/mo
- Expected delta
- $0/yr ($0/mo · 0.0%)
ⓘ Screening estimate from a state-policy table — verify with the county assessor before closing.
Climate risk First Street
- Flood 1/10 Low FEMA zone X (unshaded) · 0% chance over 30 yrs
- Wildfire 1/10 Low
- Heat 8/10 Severe 7 d/yr ≥110°F today · 24 d/yr by 30 yrs out
- Wind 8/10 Severe 99% chance of damaging wind over 30 yrs
- Air quality 2/10 Low 1 unhealthy d/yr today · 1 by 30 yrs out
Nearby sold comps map
Loading sold comps map…
Walkable amenities ~0.75 mi
Loading nearby amenities…
Taxation est. · year 1
- Rental income
- $24,523
- − Mortgage interest
- −$13,998
- − Property taxes
- −$5,475
- − Insurance
- −$1,250
- − Repairs & maintenance
- −$1,962
- − Management
- −$1,962
- − HOA
- −$840
- − Depreciation
- −$7,270
- Taxable loss
- −$8,233
- Est. tax savings @ 24.0%
- +$1,976
- After-tax cash flow
- $-1,941/yr
For passive investors: Depreciation is non-cash, so a rental often shows a tax loss while cash-flowing — sheltering income. Rental losses are passive: they offset passive income freely, and up to $25,000/yr can offset ordinary (W-2) income if you actively participate and your MAGI is under $100k (phasing out to $0 by $150k); unused losses carry forward. On sale, claimed depreciation is recaptured at up to 25%, and gains may owe capital-gains tax (a 1031 exchange can defer both). Figures are a year-1 estimate at your 24.0% rate — not tax advice; consult a CPA.
Schools (NCES district)
- District
- Montgomery ISD
- NCES district ID
- 4831260
- Math proficiency
- 63% ▼ -3.00%
- Reading proficiency
- 57% ▼ -3.00%
- Median HH income
- $75,596
- Composite
- 53.55/100
- National rank
- #1445
- State rank
- #49 of 826 in TX
Livability — Conroe
- Score
- 74/100
- State rank
- #169
- US rank
- #4447
Category grades
Schools grade is shown separately in the Schools card above.
Census & demographics
- County
- Montgomery County · 663,713 people
- City population
- 205,417
- Metro
- Houston-The Woodlands-Sugar Land, TX
- Population (ZIP)
- 32,583
- Household income
- $106,804
- Rent vs Own
- Severe rent burden
- 414.0
Population outlook (Montgomery County) Hauer SSP2
- Today (2025)
- 713,896 people
- By 2030
- 805,263 · +12.8%
- By 2040
- 992,708 · +39.1%
- By 2050
- 1,179,590 · +65.2%
- By 2075
- 1,628,084 · +128.1%
- By 2100
- 1,937,880 · +171.5%
Race, ethnicity, and origin ACS 2023
- Neighborhood character
- Predominantly White (87%)
- Race & ethnicity
- White 87% Two or more races 5% Hispanic / Latino 5% Black 4%
- Common ancestry
- Lithuanian 8% Slovak 2% Romanian 2%
- Foreign-born
- 3% · Canada, China
- Languages at home
- 96% English-only · Spanish 3%
Political lean MEDSL · Montgomery
- 2024 margin
- Solid R (+45.5) · D 26.8% · R 72.3%
- 2008→2024 swing
- +7.2pp toward D · 2008: -52.7pp · 2024: -45.5pp
- All cycles
- 2024: R+45.5 2020: R+43.8 2016: R+51.4 2012: R+60.7 2008: R+52.7
Not yet ingested
- Civics
- —
Market trends
- HPI YoY
- ▼ -101.28%
- Current HPI
- 233.0032
- Rent YoY
- ▼ -3.30%
- Metro
- Houston-The Woodlands-Sugar Land, TX
- State GDP YoY
- ▲ 3.95%
- F500 in state
- 110
Industry mix (Fortune 500 HQ in TX)
| Industry | F500 HQs | Revenue |
|---|---|---|
| Energy | 16 | $1,198B |
|
||
| Technology | 5 | $198B |
|
||
| Engineering / Construction | 4 | $72B |
|
||
| Energy Services | 3 | $60B |
|
||
| Utilities | 3 | $41B |
|
||
| Healthcare | 2 | $330B |
|
||
Price history
-24.3% since first listed16 events — show timeline
- 2025-11-05 Listed $249,900 HARMLS
- 2024-10-09 Listing Removed — HARMLS
- 2024-10-03 Price Changed $265,900 HARMLS
- 2024-10-03 Relisted — HARMLS
- 2024-09-26 Pending — HARMLS
- 2024-09-17 Pending — HARMLS
- 2024-09-10 Price Changed $269,900 HARMLS
- 2024-09-10 Relisted — HARMLS
- 2024-09-10 Rental Removed $2,000 HARMLS
- 2024-09-05 Listed for Rent $2,000 HARMLS
- 2024-09-04 Listing Removed — HARMLS
- 2024-08-27 Price Changed $292,000 HARMLS
- 2024-05-14 Price Changed $326,000 HARMLS
- 2024-05-14 Listed $330,000 HARMLS
- 2024-04-23 Sold (Public Records) — Public Records
- 2002-10-10 Sold (Public Records) — Public Records
Property tax history
+3.7%/yrLatest (2025): $5,475 · +6.7% YoY. Source: county tax records.
Cash-flow waterfall
monthlySold comps — $/sqft
last 12 mo · ≤1 miLoading sold comps…