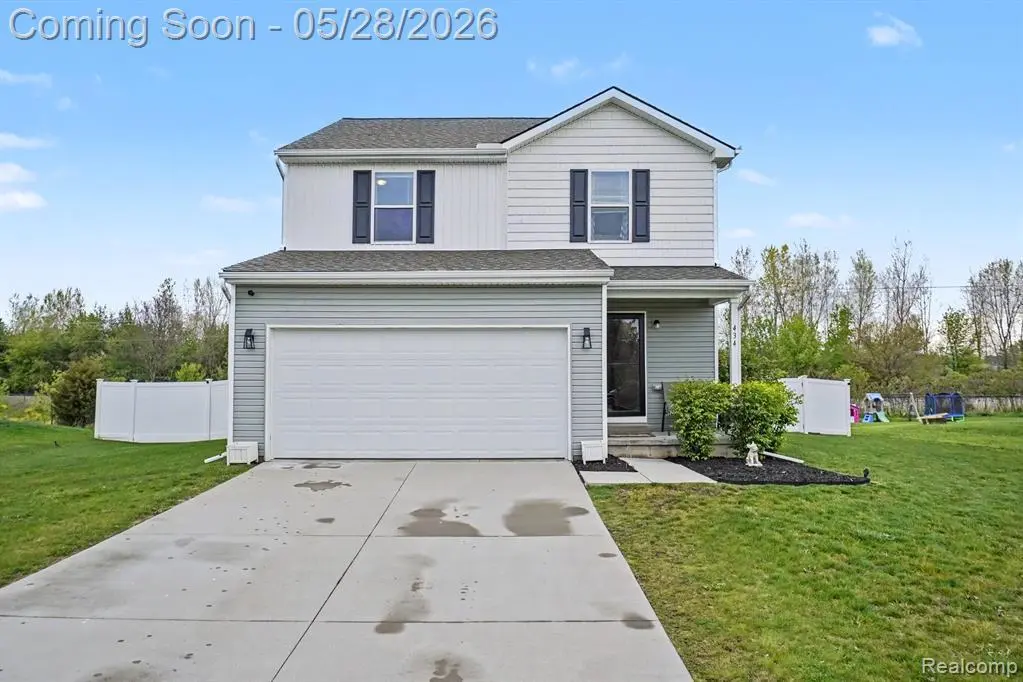
434 Saddlebrook Dr · Linden, MI
Flood risk 1/10 · Minimal
- FEMA flood zone
- X (unshaded)
- Chance of flooding over 30 yrs
- 0.0%
- Est. flood insurance / yr
- $473 – $860
Fire risk 1/10 · Minimal
- Est. fire insurance / yr
- $784 – $1,456
Heat risk 2/10 · Minimal
- Hot days now (above 95°F)
- 7 days/yr
- Hot days in 30 yrs
- 15 days/yr
Wind risk 2/10 · Minimal
- Chance of severe wind over 30 yrs
- —
Air-quality risk 2/10 · Minimal
- Unhealthy air days now
- 1 days/yr
- Unhealthy air days in 30 yrs
- 3 days/yr
Risk factors via First Street. Map © Google.
Why this score? — see what drove the F grade
The composite is a weighted blend of 9 inputs, each scored 0–100. Each bar is that input's sub-score; the figure is the points it added to the 100-point composite (weight × sub-score).
- Cash flow +11.0/30.0
- Schools +4.1/10.0
- Condition / age +4.0/5.0
- Livability +3.7/5.0
- 1% rule +3.2/10.0
- DSCR +3.2/10.0
- Rent growth +2.5/5.0
- ARV discount +1.8/15.0
- Appreciation +0.0/10.0
$339,900
🖨 Deal sheet (PDF) 📄 Offer letter ✓ Due diligence
Listing remarks
Welcome to 434 Saddlebrook Dr — a beautifully maintained 2020-built home with modern upgrades throughout. Enjoy the fully fenced backyard featuring a 6-foot privacy fence, stamped concrete patio, and gazebo — perfect for relaxing or entertaining. Recent updates include new appliances (2026), upgraded roof ridge ventilation and blown-in attic insulation (2026), water softener (2024), whole-home humidifier (2024), and washer/dryer (2020), new interior paint throughout (2026). Move-in ready with modern comfort, energy-efficient improvements, and stylish outdoor living space in a desirable Linden location.
Key facts
- 0.26 acre lot
- 2 garage spots
- Built 2021
Property features AI
Exterior
- Parking: Attached 2-car garage
- Utilities: Public water; Public sewer (assumed by typical hookup); Natural gas for heating
- Home design: Residential property; More than 2 stories; Built in 2021; Frontage approximately 84 feet
- Construction: Vinyl siding construction; Basement foundation; Built in 2021
- Exterior features: Vinyl siding; Paved street frontage
Interior
- Kitchen: Kitchen on entry level, approximately 12 x 17 with vinyl flooring
- Bedrooms: Primary bedroom on second floor, approx. 12 x 14 with carpet; Second bedroom on second floor, approx. 10 x 10 with carpet; Third bedroom on second floor, approx. 10 x ? with carpet; Total of 8 rooms
- Flooring: Carpet in bedrooms and great room; Vinyl flooring in kitchen and bathrooms
- Bathrooms: Two full bathrooms (both on second floor) and one entry-level lavatory; Vinyl flooring in bathrooms and entry-level lavatory
- Heating & cooling: Forced air heating; Natural gas heating fuel
- Interior features: Unfinished basement
- Laundry & utility: Basement (unfinished) for utilities/laundry
Neighborhood map
What this means for you Summary
Snapshot
- This is a 3-bed/2.5-bath single-family listed at $340k. Condition is rated good.
Deal economics
- At list price, monthly cash flow is $-141 ($-2k/yr) — negative.
- To cash-flow at today's rent, offer at most $320k (6.0% below list).
- To meet the 1% rule (rent ≥ 1% of price), the offer needs to be $280k (17.8% below list).
- Recommended offer: $280k (17.8% below list) — sets the bar for 1% rule.
- Cap rate 5.8% vs local median 1.8% in Linden — top-decile yield for the area; either an underpriced asset or a hidden risk that comps aren't pricing in. Stress-test before assuming the spread holds.
Location & tenants
- Location reads 74/100 on livability (#170 in MI, #4,456 nationally) — a middle-class / working-renter tenant base. Strengths: crime A+, cost of living A+, housing A+; Watch: amenities F, commute F, health & safety F.
- Linden Community Schools (suburban): math 38% / reading 54% proficiency, ranked #119 of 540 in MI (top 22%) — families likely to look elsewhere, expect single-tenant / working-renter base with shorter leases.
- Market conditions: 222 active listings in the ZIP; 1 comparable units currently listed for rent nearby; 419 units permitted in Genesee County in 2024 (68 in 5+ unit buildings).
Forward outlook
- Local home prices are declining (-3.0%/yr); year-one equity from $2k of loan paydown is wiped out by about $10k of value loss. Plan a longer hold.
- Genesee County population projected at -27% by 2050 — secular population decline; favor cash flow + early exit over multi-decade hold.
Negotiation context
- Only 5 days on market — expect competitive offers; lowballing is unlikely to land.
Questions for the listing agent
- What do current leases actually rent for vs. the listed asking? Can we see a recent rent roll and the last 12 months of T-12 income?
- Is there a deadline driving the sale (1031 exchange, divorce, estate, relocation)? That informs how much negotiation room exists.
- Schools are B-rated — typically a magnet for longer-tenancy family renters. What's the average tenant stay here, and is there a school-zone premium baked into asking?
- The area grade is low — what's the realistic commute time and amenity access for the typical tenant pool here? Any planned neighborhood developments (good or bad) we should know about?
- What's the average days-on-market for RENTAL listings here right now (not sales)? A rising rental-DOM trend means longer vacancies and softer asking-rent achievability than the comps imply.
- What's the recent tenant-quality profile in this submarket — average credit score on applications, eviction rate, late-payment / NSF rate, and stable-employment percentage? A property-management company in the area should have these aggregated.
- How much new for-sale + rental construction is in the pipeline within 1–3 miles? Heavy new supply typically softens prices + rents 12–24 months out; constrained supply supports both.
Investment metrics
- 1% rule
- 0.82% ✗
- Cap rate
- 5.80%
- Cash-on-cash
- -1.78%
- DSCR
- 0.92
- GRM
- 10.1
CMA / ARV
- ARV (on-the-fly)
- $301,928
- Comps found
- 12
Show comp detail 12 sales within ~0.75 mi
| Address | Dist | Beds/Ba | Sqft | Sold | Price | $/sf | Match |
|---|---|---|---|---|---|---|---|
| 802 Tickner St | 0.25mi | 3/1.5 | 1,642 (+2%) | 7mo | $274,900 | $167 | 75 |
| 710 Grant Cir | 0.32mi | 3/1.0 | 1,518 (-6%) | 13mo | $245,000 | $161 | 59 |
| 214 Willow Ln | 0.48mi | 3/2.0 | 1,403 (-13%) | 2mo | $253,000 | $180 | 53 |
| 684 Haystack Dr | 0.20mi | 3/1.5 | 1,378 (-14%) | 12mo | $247,500 | $180 | 52 |
| 712 Bush St | 0.70mi | 3/1.5 | 1,500 (-7%) | 3mo | $255,000 | $170 | 50 |
| 245 Andrea Ave | 0.59mi | 3/2.0 | 1,450 (-10%) | 8mo | $322,500 | $222 | 48 |
| 185 Laura Ln | 0.66mi | 3/2.5 | 1,805 (+12%) | 1mo | $339,900 | $188 | 47 |
| 595 Rockway Dr | 0.26mi | 4/2.0 (+1) | 1,388 (-14%) | 15mo | $285,000 | $205 | 46 |
| 5202 Amelia Earhart Dr | 0.68mi | 3/2.0 | 1,796 (+12%) | 3mo | $568,000 | $316 | 44 |
| 185 Laura Ln | 0.66mi | 3/2.5 | 1,805 (+12%) | 8mo | $305,000 | $169 | 42 |
| 507 Hickory St | 0.61mi | 4/1.5 (+1) | 1,461 (-9%) | 12mo | $282,000 | $193 | 38 |
| 510 Hickory St St | 0.60mi | 3/1.5 | 1,392 (-13%) | 10mo | $270,000 | $194 | 37 |
Match score weights: distance 35% · size 25% · config 20% · recency 20%. Top-matched comps best support the ARV.
Projected returns pro-forma
-3.0% appreciation · 3.0% rent growth · sell at horizon
- IRR
- -19.2%
- Equity multiple
- 0.33×
- Total profit
- $-64,012
- Equity at exit
- $50,680
- IRR
- -11.8%
- Equity multiple
- 0.29×
- Total profit
- $-67,126
- Equity at exit
- $29,388
Cash invested: $95,172 (down + closing). Projections, not guarantees.
Landlord ↔ Tenant lean methodology
- Overall (STATE)
- 62 Landlord-Friendly
- State Michigan
- 62 Landlord-Friendly · EVEN
- County
- — inherits STATE
- City
- — inherits STATE
ZIP-level market 48451
- Active inventory
- 222
- Price-to-rent
- 10.1×
Monthly cashflow live
- Estimated rent
- $2,795 medium interval (Pro) →
- Mortgage (P&I)
- −$1,782
- Tax est. 1.5%
- −$425 /mo · $5,098/yr
- Insurance
- −$142
- HOA
- −$0
- Vacancy / Maint / Mgmt
- −$587
- Net cashflow
- $-141
Break-even live
Sensitivity live
| Price | -10% $94 | -5% $-23 | +0% $-141 | +5% $-258 | +10% $-376 |
|---|---|---|---|---|---|
| Rent | -10% $-362 | -5% $-251 | +0% $-141 | +5% $-31 | +10% $80 |
| Rate | -1.0pp $30 | -0.5pp $-54 | base $-141 | +0.5pp $-229 | +1.0pp $-319 |
UW: 25.0% down · 7.5% · 30yr · 1.5% tax · 5.0% vac · 8.0% maint · 8.0% mgmt
Financing live
Cash to close
- Down payment
- $84,975
- Closing costs
- $10,197
- Reserves months
- —
- Total cash needed
- —
Loan-product check · same deal, 3 products live
Conventional
25% down · 7.5% · 30yr
- Down + closing
- —
- Monthly P&I
- —
- Monthly cashflow
- —
- DSCR
- —
- Eligible?
- —
Personal DTI + credit; lowest rate.
DSCR
20% down · 8.5% · 30yr
- Down + closing
- —
- Monthly P&I
- —
- Monthly cashflow
- —
- DSCR
- —
- Eligible?
- —
No personal income docs; deal must DSCR.
Hard money
10% down · 12.0% · 12mo
- Down + closing
- —
- Monthly P&I
- —
- Monthly cashflow
- —
- DSCR
- —
- Eligible?
- —
Short-term bridge; refi at stabilization.
Rent comps 1 comps
| Address | Beds | Baths | Sqft | Rent | $/sqft | DOM | Units | Dist |
|---|---|---|---|---|---|---|---|---|
| 334 Saddlebrook Dr Linden, MI | 4.0 | 2.5 | 2003 | $2,795 | $1.40 | 5d | 1 | 0.17mi |
Listing history 5 events
-
2026-06-02status $339,900 Pending 5 DOM
-
2026-06-01days on market $339,900 Active 5 DOM
-
2026-05-31days on market $339,900 Active 4 DOM
-
2026-05-30days on market $339,900 Active 3 DOM
-
2026-05-26historical $339,900
ⓘ Source: listings_history table (triggers on properties + properties_extension) + one-shot
backfill from property_details.listing_events for pre-trigger history.
Climate risk First Street
- Flood 1/10 Low FEMA zone X (unshaded) · 0% chance over 30 yrs
- Wildfire 1/10 Low
- Heat 2/10 Low 7 d/yr ≥95°F today · 15 d/yr by 30 yrs out
- Wind 2/10 Low
- Air quality 2/10 Low 1 unhealthy d/yr today · 3 by 30 yrs out
Nearby sold comps map
Loading sold comps map…
Walkable amenities ~0.75 mi
Loading nearby amenities…
Taxation est. · year 1
- Rental income
- $33,540
- − Mortgage interest
- −$19,040
- − Property taxes
- −$5,098
- − Insurance
- −$1,700
- − Repairs & maintenance
- −$2,683
- − Management
- −$2,683
- − Depreciation
- −$9,888
- Taxable loss
- −$7,552
- Est. tax savings @ 24.0%
- +$1,813
- After-tax cash flow
- $121/yr
For passive investors: Depreciation is non-cash, so a rental often shows a tax loss while cash-flowing — sheltering income. Rental losses are passive: they offset passive income freely, and up to $25,000/yr can offset ordinary (W-2) income if you actively participate and your MAGI is under $100k (phasing out to $0 by $150k); unused losses carry forward. On sale, claimed depreciation is recaptured at up to 25%, and gains may owe capital-gains tax (a 1031 exchange can defer both). Figures are a year-1 estimate at your 24.0% rate — not tax advice; consult a CPA.
Condition & rehab AI · 13 photos
This 2020-built home is move-in ready with modern upgrades and energy-efficient improvements. The fenced backyard and stamped concrete patio provide a great outdoor living space.
Value-add opportunities
- Both landscaping and curb appeal — enhances curb appeal and can increase both resale and rental value
- Both painting exterior — fresh paint can improve curb appeal and increase both resale and rental value
Renovation cost estimate screening
Value-add ROI direction
- Both landscaping and curb appeal — enhances curb appeal and can increase both resale and rental value ↑
- Both painting exterior — fresh paint can improve curb appeal and increase both resale and rental value ↑
ⓘ Cost ranges are severity-bucket heuristics (US national rule-of-thumb). Get contractor quotes + a written scope before underwriting a rehab budget.
Schools (NCES district)
- District
- Linden Community Schools
- NCES district ID
- 2621690
- Math proficiency
- 38% ▼ -18.00%
- Reading proficiency
- 54% ▼ -10.00%
- Median HH income
- $69,129
- Composite
- 41.24/100
- National rank
- #3532
- State rank
- #119 of 540 in MI
Livability — Linden
- Score
- 74/100
- State rank
- #170
- US rank
- #4456
Category grades
Schools grade is shown separately in the Schools card above.
Census & demographics
- Census place
- Linden, MI
- Population (ZIP)
- 15,993
Population outlook (Genesee County) Hauer SSP2
- Today (2025)
- 381,312 people
- By 2030
- 362,731 · -4.9%
- By 2040
- 321,550 · -15.7%
- By 2050
- 279,212 · -26.8%
- By 2075
- 193,336 · -49.3%
- By 2100
- 128,118 · -66.4%
Race, ethnicity, and origin ACS 2023
- Neighborhood character
- Predominantly White (92%)
- Race & ethnicity
- White 92% Two or more races 3% Black 2% Hispanic / Latino 2%
- Common ancestry
- Romanian 6% Lithuanian 4% Slovak 4%
- Foreign-born
- 2% · Canada
- Languages at home
- 97% English-only · Arabic 2% Spanish 1%
Political lean MEDSL · Genesee
- 2024 margin
- Toss-up / Even · D 51.4% · R 47.2% · Other 1.4%
- 2008→2024 swing
- -28.3pp toward R · 2008: 32.5pp · 2024: 4.2pp
- All cycles
- 2024: D+4.2 2020: D+9.3 2016: D+9.5 2012: D+28.2 2008: D+32.5
Not yet ingested
- Civics
- —
Market trends
- HPI YoY
- ▼ -218.03%
- Current HPI
- 260.4332
- Rent YoY
- —
- Metro
- —
- State GDP YoY
- ▲ 1.37%
- F500 in state
- 28
Industry mix (Fortune 500 HQ in MI)
| Industry | F500 HQs | Revenue |
|---|---|---|
| Automotive Parts | 3 | $48B |
|
||
| Automotive | 2 | $372B |
|
||
| Chemicals | 1 | $45B |
|
||
| Automotive Retail | 1 | $29B |
|
||
| Healthcare / Medical Devices | 1 | $23B |
|
||
| Automotive Technology | 1 | $20B |
|
||
Price history
1 event — show timeline
- 2026-05-26 Coming Soon $339,900 MiRealSource-MiMLS
Cash-flow waterfall
monthlySold comps — $/sqft
last 12 mo · ≤1 miLoading sold comps…