 🏷️ Likely Rental
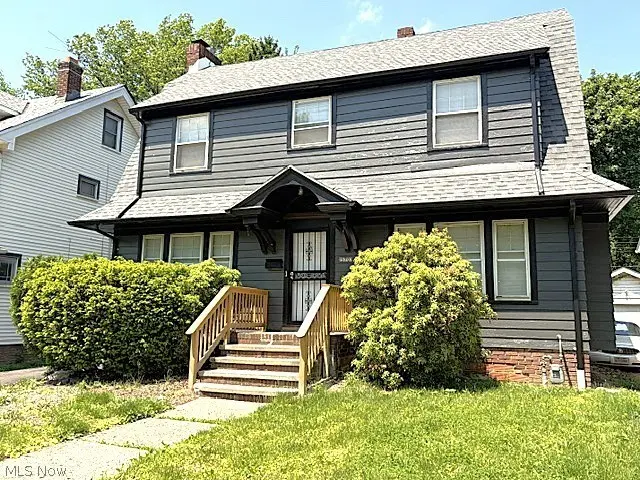
15703 Hazel Rd · East Cleveland, OH
Flood risk 1/10 · Minimal
- FEMA flood zone
- X (unshaded)
- Chance of flooding over 30 yrs
- 0.0%
- Est. flood insurance / yr
- $473 – $860
Fire risk 1/10 · Minimal
- Est. fire insurance / yr
- $713 – $1,323
Heat risk 2/10 · Minimal
- Hot days now (above 95°F)
- 6 days/yr
- Hot days in 30 yrs
- 14 days/yr
Wind risk 1/10 · Minimal
- Chance of severe wind over 30 yrs
- —
Air-quality risk 3/10 · Minor
- Unhealthy air days now
- 3 days/yr
- Unhealthy air days in 30 yrs
- 5 days/yr
Risk factors via First Street. Map © Google.
Why this score? — see what drove the C+ grade
The composite is a weighted blend of 9 inputs, each scored 0–100. Each bar is that input's sub-score; the figure is the points it added to the 100-point composite (weight × sub-score).
- Cash flow +24.1/30.0
- ARV discount +15.0/15.0
- DSCR +7.8/10.0
- 1% rule +6.3/10.0
- Rent growth +3.8/5.0
- Livability +3.3/5.0
- Condition / age +2.5/5.0
- Schools +0.7/10.0
- Appreciation +0.0/10.0
$145,000
🖨 Deal sheet 📄 Offer letter ✓ Due diligence
Listing remarks
TURNKEY! Look at this fantastic 4 possibly 5 bedroom Colonial-Fully renovated- with 2.5 Baths!!! Tenant occupied at $1490/mo sec 8 with tenant paying gas/electric! ($1288 Sec8 HAP + $202 Cash from tenant) The first level offers a stunning layout, refinished hardwood floors, spacious living room with fireplace, plenty of natural light, gorgeous dining room, large open foyer, newly added half bath and oversized kitchen with dinette area!!! The second floor offers 4 nice sized bedrooms with ample closet space, refinished hardwood floors, plenty of closet space and a newly remodeled full bathroom! The basement offers tons of space with a finished room for a possible 5th bedroom or recreational
Key facts
- Fully renovated
- Oversized kitchen
- Gorgeous dining room
Tags
Property features AI
Exterior
- Parking: Detached garage; Driveway; 1 garage space
- Utilities: Public water; Public sewer
- Home design: 2-story house; Block foundation
- Construction: Asphalt/fiberglass roof
- Exterior features: Enclosed porch; Patio; Porch; Partial cross fencing
Interior
- Kitchen: Eat-in kitchen; Kitchen with hardwood flooring
- Bedrooms: Bedroom on second level (hardwood flooring, ~20 x 10); Additional bedrooms on second level (hardwood flooring)
- Flooring: Hardwood flooring in main living areas and upstairs bedrooms; Concrete flooring in part of the basement
- Bathrooms: 2 full bathrooms; 1 half bathroom
- Heating & cooling: Forced air heating
- Interior features: Full, partially finished basement; 1 fireplace (gas) in the family room
- Laundry & utility: Washer hookup; Electric dryer hookup
Neighborhood map
What this means for you Summary
Snapshot
- This is a 4-bed/2.5-bath single-family listed at $145k.
Deal economics
- At list price, monthly cash flow is $287 ($3k/yr) — positive.
- The deal already cash-flows at list — no discount required.
- Meets the 1% rule at list price ($2k rent vs $145k).
- Recommended offer: $141k (3.0% below list) — sets the bar for market timing.
- Cap rate 8.7% vs local median 17.4% in East Cleveland — below-typical yield; the buyer is paying a premium for something (appreciation thesis, condition, location) that the cap rate doesn't capture.
Location & tenants
- Location reads 66/100 on livability (#650 in OH) — a middle-class / working-renter tenant base. Strengths: commute A+, cost of living A+, health & safety A+; Watch: schools F, crime F, employment F.
- East Cleveland City School District (suburban): math 4% / reading 17% proficiency, ranked #652 of 656 in OH (top 99%) — low school quality limits family demand, transient renter base, plan for 1-2y turnover; 92% free/reduced lunch — lower-income household profile, screen leases tightly.
- Market conditions: Rents rising fast (+5.2%/yr); 99 active listings in the ZIP; 40 comparable units currently listed for rent nearby; rentals at typical pace (median 16d on market — plan ~3-4 weeks tenant-placement turnaround); lower-income renter base — watch delinquency; 1,441 units permitted in Cuyahoga County in 2024 (700 in 5+ unit buildings).
- At $1,632/mo this rent would consume 68% of the median local household income ($29k/yr) (locally 1702% of renters already pay >50% of income on rent) — very limited rent-growth headroom before tenants either downsize or default.
Forward outlook
- Local home prices are declining (-3.0%/yr); year-one equity from $1k of loan paydown is wiped out by about $4k of value loss. Plan a longer hold.
- Cuyahoga County population projected to shrink 8% by 2050 — rents likely to lag national; underwrite the cash flow, not the appreciation.
- At projected returns (-3.0% appreciation + 5.2% rent growth), your $41k cash investment doubles in ~10 years — after that, you're playing with house money.
Negotiation context
- It's been on market 31 days — a 3% lower offer ($141k) is reasonable based on typical stale-listing flexibility.
- 15 sale attempts since 24y ago; this cycle's ask has dropped $10k (6%) from the opening price — seller is motivated, your offer sets the floor, not the list.
- Current owner paid $11k; list at $145k implies a 1218% gain — meaningful room to come down on a strong offer.
Risks & watch-outs
- Watch-outs: built in 1920 — expect roof / HVAC / electrical / plumbing capex.
Questions for the listing agent
- It's been on market 31 days. Have you received any prior offers? Is the seller open to a 3% concession, seller financing, or rate buy-down credit?
- Built in 1920 — when were the roof, HVAC, electrical panel, plumbing, and water heater last replaced?
- Is there a deadline driving the sale (1031 exchange, divorce, estate, relocation)? That informs how much negotiation room exists.
- Schools are F-rated, which usually means shorter tenancies and higher turnover. Who's the typical renter profile here, and what's been the actual vacancy rate?
- Crime grade is F in this area — have there been break-ins, vandalism, or insurance claims at this property in the last 3 years? What carrier currently insures it and at what premium?
- What's the average days-on-market for RENTAL listings here right now (not sales)? A rising rental-DOM trend means longer vacancies and softer asking-rent achievability than the comps imply.
- What's the recent tenant-quality profile in this submarket — average credit score on applications, eviction rate, late-payment / NSF rate, and stable-employment percentage? A property-management company in the area should have these aggregated.
- How much new for-sale + rental construction is in the pipeline within 1–3 miles? Heavy new supply typically softens prices + rents 12–24 months out; constrained supply supports both.
Investment metrics
- 1% rule
- 1.13% ✓
- Cap rate
- 8.67%
- Cash-on-cash
- 8.49%
- DSCR
- 1.38
- GRM
- 7.4
CMA / ARV
- ARV (on-the-fly)
- $203,580
- Comps found
- 12
Show comp detail 12 sales within ~0.75 mi
| Address | Dist | Beds/Ba | Sqft | Sold | Price | $/sf | Match |
|---|---|---|---|---|---|---|---|
| 2123 N Taylor Rd | 0.32mi | 3/2.0 (-1) | 1,796 (+3%) | 5mo | $115,000 | $64 | 69 |
| 2188 N Taylor Rd | 0.39mi | 4/1.5 | 1,669 (-4%) | 6mo | $195,000 | $117 | 66 |
| 917 Brunswick Rd | 0.34mi | 4/3.0 | 1,890 (+9%) | 3mo | $260,000 | $138 | 65 |
| 2145 N Taylor Rd | 0.33mi | 3/2.5 (-1) | 1,579 (-9%) | 1mo | $272,900 | $173 | 63 |
| 15959 Glynn Rd | 0.18mi | 3/1.5 (-1) | 1,913 (+10%) | 5mo | $180,000 | $94 | 62 |
| 16237 Forest Hills Blvd | 0.58mi | 3/1.5 (-1) | 1,765 (+1%) | 1mo | $245,900 | $139 | 61 |
| 15991 Henley Rd | 0.35mi | 3/2.5 (-1) | 1,560 (-10%) | 2mo | $250,000 | $160 | 60 |
| 1012 Helmsdale Rd | 0.46mi | 4/2.5 | 1,554 (-11%) | 4mo | $172,000 | $111 | 58 |
| 16252 Oakhill Rd | 0.29mi | 4/2.0 | 2,000 (+15%) | 3mo | $215,000 | $108 | 57 |
| 1863 Page Ave | 0.31mi | 3/1.0 (-1) | 1,930 (+11%) | 5mo | $40,000 | $21 | 53 |
| 1099 Mount Vernon Blvd | 0.52mi | 3/1.5 (-1) | 1,593 (-8%) | 2mo | $250,000 | $157 | 51 |
| 1061 Greyton Rd | 0.57mi | 4/2.0 | 1,497 (-14%) | 4mo | $167,000 | $112 | 45 |
Match score weights: distance 35% · size 25% · config 20% · recency 20%. Top-matched comps best support the ARV.
Projected returns pro-forma
-3.0% appreciation · 5.16% rent growth · sell at horizon
- IRR
- -1.0%
- Equity multiple
- 0.96×
- Total profit
- $-1,557
- Equity at exit
- $21,620
- IRR
- 10.9%
- Equity multiple
- 1.93×
- Total profit
- $37,834
- Equity at exit
- $12,537
Cash invested: $40,600 (down + closing). Projections, not guarantees.
Landlord ↔ Tenant lean methodology
- Overall (STATE)
- 73 Landlord-Friendly
- State Ohio
- 73 Landlord-Friendly · R+6
- County
- — inherits STATE
- City
- — inherits STATE
ZIP-level market 44112
- Rents YoY
- 5.2%
- Active inventory
- 99
- Price-to-rent
- 7.4×
Monthly cashflow live
- Estimated rent
- $1,632 high interval (Pro) →
- Mortgage (P&I)
- −$760
- Tax from tax record
- −$181 /mo · $2,172/yr
- Insurance
- −$60
- HOA
- −$0
- Vacancy / Maint / Mgmt
- −$343
- Net cashflow
- $287
Break-even live
UW: 25.0% down · 7.5% · 30yr · 1.5% tax · 5.0% vac · 8.0% maint · 8.0% mgmt
Financing live
Cash to close
- Down payment
- $36,250
- Closing costs
- $4,350
- Reserves months
- —
- Total cash needed
- —
Loan-product check · same deal, 3 products live
Conventional
25% down · 7.5% · 30yr
- Down + closing
- —
- Monthly P&I
- —
- Monthly cashflow
- —
- DSCR
- —
- Eligible?
- —
Personal DTI + credit; lowest rate.
DSCR
20% down · 8.5% · 30yr
- Down + closing
- —
- Monthly P&I
- —
- Monthly cashflow
- —
- DSCR
- —
- Eligible?
- —
No personal income docs; deal must DSCR.
Hard money
10% down · 12.0% · 12mo
- Down + closing
- —
- Monthly P&I
- —
- Monthly cashflow
- —
- DSCR
- —
- Eligible?
- —
Short-term bridge; refi at stabilization.
Rent comps 40 comps
| Address | Beds | Baths | Sqft | Rent | $/sqft | DOM | Units | Dist |
|---|---|---|---|---|---|---|---|---|
| 15801 Hazel Rd Cleveland, OH | 3.0 | 1.5 | 1908 | $1,550 | $0.81 | 16d | 1 | 0.02mi |
| 910 Dresden Rd Cleveland, OH | 4.0 | 2.0 | 1839 | $1,800 | $0.98 | 16d | 1 | 0.34mi |
| 3337 Sylvanhurst Rd Cleveland, OH | 3.0 | 1.0 | 1334 | $1,800 | $1.35 | 7d | 1 | 0.54mi |
| 1024 Greyton Rd Cleveland, OH | 5.0 | 2.5 | 1800 | $2,500 | $1.39 | 43d | 1 | 0.55mi |
| 983 Greyton Rd Cleveland, OH | 3.0 | 2.0 | 1457 | $1,495 | $1.03 | 16d | 1 | 0.60mi |
| 915 Nela View Rd Cleveland, OH | 4.0 | 1.0 | 1300 | $2,600 | $2.00 | 16d | 1 | 0.62mi |
| 16000 Terrace Rd Cleveland, OH | 1.0–3.0 | 1.0–2.0 | 1000 | $1,210 | $1.21 | 1d | 39 | 0.64mi |
| 3406 Henderson Rd Cleveland, OH | 4.0 | 1.5 | 1343 | $2,250 | $1.68 | 16d | 1 | 0.68mi |
| 953 Whitby Rd Cleveland, OH | 3.0 | 2.0 | 1188 | $1,575 | $1.33 | 23d | 1 | 0.68mi |
| 14312 Scioto Ave Cleveland, OH | 3.0 | 1.0 | 1090 | $1,300 | $1.19 | 4d | 1 | 0.69mi |
| 3430 Winsford Rd Cleveland, OH | 4.0 | 1.5 | 1800 | $1,590 | $0.88 | 16d | 1 | 0.71mi |
| 967 Selwyn Rd Cleveland, OH | 3.0 | 1.5 | 1214 | $1,595 | $1.31 | 16d | 1 | 0.73mi |
| 963 Selwyn Rd Cleveland, OH | 4.0 | 1.0 | 1300 | $2,650 | $2.04 | 1d | 1 | 0.73mi |
| 14200 Scioto Ave Cleveland, OH | 3.0 | 1.0 | 1256 | $1,350 | $1.07 | 16d | 1 | 0.74mi |
| 821 Nela View Rd Cleveland, OH | 4.0 | 2.5 | 2178 | $2,100 | $0.96 | 7d | 1 | 0.76mi |
| 14009 Mayfair Ave Unit 2 East Cleveland, OH | 4.0 | 2.0 | 1144 | $1,390 | $1.22 | 43d | 1 | 0.78mi |
| 14205 Savannah Ave Cleveland, OH | 3.0 | 1.0 | 1160 | $1,350 | $1.16 | 16d | 1 | 0.80mi |
| 2401 N Taylor Rd Cleveland, OH | 3.0 | 1.0 | 1347 | $1,325 | $0.98 | 7d | 1 | 0.80mi |
| 14005 Scioto Ave Cleveland, OH | 3.0 | 1.0 | 1056 | $1,570 | $1.49 | 16d | 1 | 0.81mi |
| 1099 Woodview Rd Cleveland, OH | 4.0 | 1.0 | 1500 | $2,500 | $1.67 | 1d | 1 | 0.81mi |
| 14813 Alder Ave Cleveland, OH | 3.0 | 1.0 | 1188 | $1,150 | $0.97 | 23d | 1 | 0.86mi |
| 1035 Elbon Rd Cleveland, OH | 4.0 | 1.5 | 1304 | $1,675 | $1.28 | 16d | 1 | 0.88mi |
| 1007 Elbon Rd Cleveland, OH | 3.0 | 1.0 | 1386 | $1,400 | $1.01 | 10d | 1 | 0.88mi |
| 13900 Potomac Ave Cleveland, OH | 3.0 | 1.0 | 1172 | $1,355 | $1.16 | 23d | 1 | 0.88mi |
| 994 Yellowstone Rd Cleveland, OH | 3.0 | 2.0 | 1475 | $1,395 | $0.95 | 2d | 1 | 1.04mi |
| 14120 Superior Rd Cleveland, OH | 3.0 | 1.0 | 1390 | $1,400 | $1.01 | 43d | 1 | 1.08mi |
| 3201 Whitethorn Rd Unit 3203 Cleveland Heights, OH | 5.0 | 1.5 | 1485 | $1,725 | $1.16 | 23d | 1 | 1.12mi |
| 14172 Superior Rd Unit 1 Cleveland Heights, OH | 3.0 | 1.0 | 1446 | $1,295 | $0.90 | 23d | 1 | 1.13mi |
| 14120 Superior Ave Unit 4 East Cleveland, OH | 3.0 | 1.0 | 1408 | $1,350 | $0.96 | 43d | 1 | 1.14mi |
| 14120 Superior Ave Unit 1 East Cleveland, OH | 3.0 | 1.0 | 1400 | $1,350 | $0.96 | 10d | 1 | 1.14mi |
| 1633 Eddington Rd Unit 1 Cleveland Heights, OH | 3.0 | 1.0 | 1538 | $1,100 | $0.72 | 23d | 1 | 1.22mi |
| 2827 Avondale Ave Apt 2 Cleveland Heights, OH | 3.0 | 1.0 | 1680 | $1,275 | $0.76 | 23d | 1 | 1.24mi |
| 12819 Edmonton Ave Cleveland, OH | 4.0 | 1.0 | 1423 | $1,795 | $1.26 | 16d | 1 | 1.25mi |
| 1641 Coventry Rd Cleveland, OH | 3.0 | 1.0 | 1848 | $1,200 | $0.65 | 16d | 1 | 1.30mi |
| 1131 Cleveland Heights Blvd Cleveland, OH | 5.0 | 2.0 | 1500 | $2,550 | $1.70 | 1d | 1 | 1.35mi |
| 1695 Glenmont Rd Unit 1695 Glenmont Lower Cleveland Heights, OH | 3.0 | 1.0 | 1336 | $1,435 | $1.07 | 7d | 1 | 1.37mi |
| 1695 Glenmont Rd Unit Lower Cleveland Heights, OH | 3.0 | 1.0 | 1336 | $1,435 | $1.07 | 23d | 1 | 1.37mi |
| 3777 Montevista Rd Cleveland, OH | 5.0 | 2.0 | 2050 | $2,900 | $1.41 | 1d | 1 | 1.40mi |
| 1229 Melbourne Rd Cleveland, OH | 5.0 | 1.5 | 1600 | $2,000 | $1.25 | 43d | 1 | 1.42mi |
| 3230 Euclid Heights Blvd Unit NA Cleveland Heights, OH | 4.0 | 1.0 | 1705 | $2,270 | $1.33 | 23d | 1 | 1.43mi |
Listing history 50 events
-
2026-06-18days on market $145,000 Active 31 DOM
-
2026-06-17days on market $145,000 Active 30 DOM
-
2026-06-16days on market $145,000 Active 29 DOM
-
2026-06-15days on market $145,000 Active 28 DOM
-
2026-06-13days on market $145,000 Active 26 DOM
-
2026-06-13pricedays on market $145,000 Active 25 DOM
-
2026-06-09days on market $150,000 Active 22 DOM
-
2026-06-08days on market $150,000 Active 21 DOM
-
2026-06-07days on market $150,000 Active 20 DOM
-
2026-06-05days on market $150,000 Active 17 DOM
-
2026-06-03days on market $150,000 Active 16 DOM
-
2026-06-02pricedays on market $150,000 Active 15 DOM
-
2026-06-01days on market $155,000 Active 14 DOM
-
2026-05-31days on market $155,000 Active 13 DOM
-
2026-05-17$155,000 Active
-
2026-02-28historical
-
2026-01-18price $140,000
-
2025-11-20status Active
-
2025-11-05historical Contingent
-
2025-10-15price $145,000
-
2025-09-08price $150,000
-
2025-09-03$159,000 Active
-
2025-07-22historical
-
2025-07-17price $152,000
-
2025-07-05status Active
-
2025-06-26historical Contingent
-
2025-06-15price $154,000
-
2025-06-05status Active
-
2025-03-12status Pending
-
2025-03-05historical Contingent
-
2025-03-04status Pending
-
2025-02-13$159,000 Active
-
2018-10-15historical
-
2018-06-08$59,000 Active
-
2018-03-07historical
-
2018-01-09$42,000 Active
-
2011-12-31historical
-
2010-09-23$40,000
-
2010-07-01historical
-
2010-04-01$40,000
-
2008-05-02soldstatus $11,000
-
2008-03-13historical
-
2008-02-12$18,500
-
2008-01-14$29,900
-
2008-01-10historical
-
2007-09-11$34,500
-
2004-05-10soldstatus $95,000
-
2004-05-08soldstatus $95,000
-
2004-03-18$95,000
-
2003-02-13historical
ⓘ Source: listings_history table (triggers on properties + properties_extension) + one-shot
backfill from property_details.listing_events for pre-trigger history.
Tax reassessment forecast OH · Partial reset (capped growth)
- Current annual tax
- $2,172 · $181/mo
- Projected year-2 tax
- $2,217 · $185/mo
- Expected delta
- +$45/yr (+$4/mo · 2.1%)
ⓘ Screening estimate from a state-policy table — verify with the county assessor before closing.
Climate risk First Street
- Flood 1/10 Low FEMA zone X (unshaded) · 0% chance over 30 yrs
- Wildfire 1/10 Low
- Heat 2/10 Low 6 d/yr ≥95°F today · 14 d/yr by 30 yrs out
- Wind 1/10 Low
- Air quality 3/10 Moderate 3 unhealthy d/yr today · 5 by 30 yrs out
Nearby sold comps map
Loading sold comps map…
Walkable amenities ~0.75 mi
Loading nearby amenities…
Taxation est. · year 1
- Rental income
- $19,580
- − Mortgage interest
- −$8,122
- − Property taxes
- −$2,172
- − Insurance
- −$725
- − Repairs & maintenance
- −$1,566
- − Management
- −$1,566
- − Depreciation
- −$4,218
- Taxable income
- $1,210
- Est. tax owed @ 24.0%
- −$290
- After-tax cash flow
- $3,156/yr
For passive investors: Depreciation is non-cash, so a rental often shows a tax loss while cash-flowing — sheltering income. Rental losses are passive: they offset passive income freely, and up to $25,000/yr can offset ordinary (W-2) income if you actively participate and your MAGI is under $100k (phasing out to $0 by $150k); unused losses carry forward. On sale, claimed depreciation is recaptured at up to 25%, and gains may owe capital-gains tax (a 1031 exchange can defer both). Figures are a year-1 estimate at your 24.0% rate — not tax advice; consult a CPA.
Schools (NCES district)
- District
- East Cleveland City School District
- NCES district ID
- 3904390
- Math proficiency
- 4% ▼ -16.00%
- Reading proficiency
- 17% ▼ -13.00%
- Median HH income
- $22,726
- Composite
- 7.38/100
- National rank
- #9954
- State rank
- #652 of 656 in OH
Livability — East Cleveland
- Score
- 66/100
- State rank
- #650
- US rank
- #11510
Category grades
Schools grade is shown separately in the Schools card above.
Census & demographics
- Census place
- East Cleveland, OH
- County
- Cuyahoga County · 1,090,369 people
- City population
- 17,848
- Metro
- Cleveland-Elyria, OH
- Population (ZIP)
- 17,848
- Household income
- $28,799
- Rent vs Own
- Severe rent burden
- 1702.0
Population outlook (Cuyahoga County) Hauer SSP2
- Today (2025)
- 1,244,621 people
- By 2030
- 1,230,093 · -1.2%
- By 2040
- 1,189,108 · -4.5%
- By 2050
- 1,145,706 · -7.9%
- By 2075
- 1,076,557 · -13.5%
- By 2100
- 978,987 · -21.3%
Race, ethnicity, and origin ACS 2023
- Neighborhood character
- Predominantly Black (89%)
- Race & ethnicity
- Black 89% White 7% Two or more races 2% Hispanic / Latino 1%
- Common ancestry
- Lithuanian 1%
- Foreign-born
- 4% · Canada
- Languages at home
- 93% English-only · French/Haitian/Cajun 3% Spanish 2% Russian/Polish/Slavic 1%
Political lean MEDSL · Cuyahoga
- 2024 margin
- Solid D (+31.5) · D 65.4% · R 33.9%
- 2008→2024 swing
- -7.4pp toward R · 2008: 38.9pp · 2024: 31.5pp
- All cycles
- 2024: D+31.5 2020: D+34.1 2016: D+35.0 2012: D+38.7 2008: D+38.9
Not yet ingested
- Civics
- —
Market trends
- HPI YoY
- ▼ -115.61%
- Current HPI
- 67.2162
- Rent YoY
- ▲ 5.16%
- Metro
- Cleveland-Elyria, OH
- State GDP YoY
- ▲ 1.98%
- F500 in state
- 48
Industry mix (Fortune 500 HQ in OH)
| Industry | F500 HQs | Revenue |
|---|---|---|
| Insurance | 3 | $145B |
|
||
| Industrial Machinery | 3 | $49B |
|
||
| Financial Services | 3 | $24B |
|
||
| Consumer Goods | 2 | $93B |
|
||
| Aerospace / Defense | 2 | $47B |
|
||
| Utilities | 2 | $33B |
|
||
Price history
+158.3% since first listed38 events — show timeline
- 2026-05-17 Listed $155,000 MLSNOW
- 2026-02-28 Listing Removed — MLSNOW
- 2026-01-18 Price Changed $140,000 MLSNOW
- 2025-11-20 Relisted — MLSNOW
- 2025-11-05 Contingent — MLSNOW
- 2025-10-15 Price Changed $145,000 MLSNOW
- 2025-09-08 Price Changed $150,000 MLSNOW
- 2025-09-03 Listed $159,000 MLSNOW
- 2025-07-22 Listing Removed — MLSNOW
- 2025-07-17 Price Changed $152,000 MLSNOW
- 2025-07-05 Relisted — MLSNOW
- 2025-06-26 Contingent — MLSNOW
- 2025-06-15 Price Changed $154,000 MLSNOW
- 2025-06-05 Relisted — MLSNOW
- 2025-03-12 Pending — MLSNOW
- 2025-03-05 Contingent — MLSNOW
- 2025-03-04 Pending — MLSNOW
- 2025-02-13 Listed $159,000 MLSNOW
- 2018-10-15 Listing Removed — MLSNOW
- 2018-06-08 Listed $59,000 MLSNOW
- 2018-03-07 Listing Removed — MLSNOW
- 2018-01-09 Listed $42,000 MLSNOW
- 2011-12-31 Listing Removed — MLSNOW
- 2010-09-23 Listed $40,000 MLSNOW
- 2010-07-01 Listing Removed — MLSNOW
- 2010-04-01 Listed $40,000 MLSNOW
- 2008-05-02 Sold (MLS) $11,000 MLSNOW
- 2008-03-13 Listing Removed — MLSNOW
- 2008-02-12 Listed $18,500 MLSNOW
- 2008-01-14 Listed $29,900 MLSNOW
- 2008-01-10 Listing Removed — MLSNOW
- 2007-09-11 Listed $34,500 MLSNOW
- 2004-05-10 Sold (Public Records) $95,000 Public Records
- 2004-05-08 Sold (MLS) $95,000 MLSNOW
- 2004-03-18 Listed $95,000 MLSNOW
- 2003-02-13 Listing Removed — MLSNOW
- 2002-08-13 Listed $99,900 MLSNOW
- 1986-07-22 Sold (Public Records) $60,000 Public Records
Property tax history
+2.4%/yrLatest (2025): $2,172 · +0.0% YoY. Source: county tax records.
Cash-flow waterfall
monthlySold comps — $/sqft
last 12 mo · ≤1 miLoading sold comps…