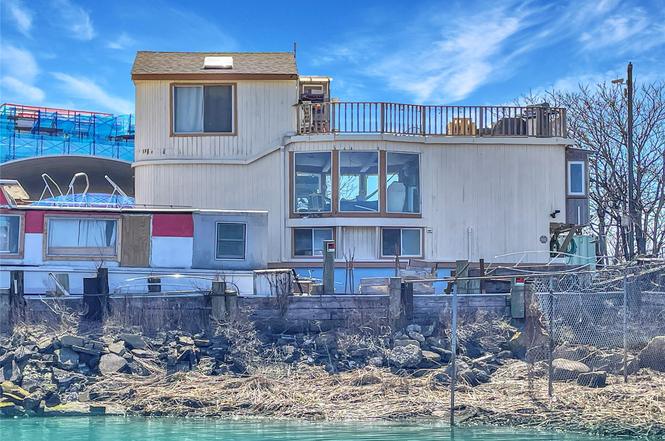
360 Beach 59th St Unit A Dock · New York, NY
Flood risk 9/10 · Severe
- FEMA flood zone
- AE
- Chance of flooding over 30 yrs
- 0.99%
- Est. flood insurance / yr
- $1,737 – $8,500
Fire risk 1/10 · Minimal
- Est. fire insurance / yr
- $691 – $1,283
Heat risk 6/10 · Moderate
- Hot days now (above 96°F)
- 7 days/yr
- Hot days in 30 yrs
- 16 days/yr
Wind risk 6/10 · Moderate
- Chance of severe wind over 30 yrs
- 77.0%
Air-quality risk 3/10 · Minor
- Unhealthy air days now
- 4 days/yr
- Unhealthy air days in 30 yrs
- 4 days/yr
Risk factors via First Street. Map © Google.
Why this score? — see what drove the A- grade
The composite is a weighted blend of 9 inputs, each scored 0–100. Each bar is that input's sub-score; the figure is the points it added to the 100-point composite (weight × sub-score).
- Cash flow +30.0/30.0
- 1% rule +10.0/10.0
- DSCR +10.0/10.0
- Appreciation +10.0/10.0
- ARV discount +7.5/15.0
- Schools +5.0/10.0
- Livability +3.8/5.0
- Rent growth +2.5/5.0
- Condition / age +2.5/5.0
$215,000
🖨 Deal sheet 📄 Offer letter ✓ Due diligence
Listing remarks
Step aboard "Ziggy Stardust, " a beautifully crafted and truly unique houseboat that blends artistry, comfort, and breathtaking views. Thoughtfully designed with love and creativity, this one-of-a-kind masterpiece offers panoramic vistas of Marina 59 in Rockaway Beach, making it the perfect retreat for surfers, fishing enthusiasts, and sunset lovers. With four spacious bedrooms, a full bath, and a fully equipped kitchen, this home provides modern comforts, including a bathroom, an outdoor shower for rinsing off after a day by the water, and an expansive upper deck, the perfect spot to enjoy unbeatable bay views and stunning sunsets. Thoughtfully designed with ample storage and an
Key facts
- Expansive upper deck
- Unique houseboat
- Panoramic vistas
Tags
Property features AI
Finance
- HOA & community: Monthly additional fee of $2,100 for slip fee
Exterior
- Parking: Space for 2 vehicles (no carport)
- Utilities: Sewer: other; Public trash collection
- Home design: Single family residence
- Construction: Other foundation details; Building area about 2,000 total
- Exterior features: Waterfront property; Other construction materials
Interior
- Kitchen: Cooktop; Dishwasher; Oven; Refrigerator
- Bedrooms: 6 total rooms (includes bedrooms and living spaces)
- Bathrooms: 1 full bathroom
- Heating & cooling: Electric heating; Other heating
- Interior features: Other interior features
Neighborhood map
What this means for you Summary
Snapshot
- This is a 4-bed/1.0-bath single-family listed at $215k.
Deal economics
- At list price, monthly cash flow is $1k ($14k/yr) — positive.
- The deal already cash-flows at list — no discount required.
- Meets the 1% rule at list price ($4k rent vs $215k).
- Recommended offer: $189k (12.0% below list) — sets the bar for market timing.
- Cap rate 15.2% vs local median 2.6% in New York — top-decile yield for the area; either an underpriced asset or a hidden risk that comps aren't pricing in. Stress-test before assuming the spread holds.
Location & tenants
- Location reads 75/100 on livability (#268 in NY, #4,188 nationally) — a middle-class / working-renter tenant base. Strengths: amenities A+, commute A+, health & safety A; Watch: crime F, cost of living F.
- Market conditions: 80 active listings in the ZIP; 5 comparable units currently listed for rent nearby; rentals at typical pace (median 25d on market — plan ~3-4 weeks tenant-placement turnaround); 5,302 units permitted in Queens County in 2024 (4,918 in 5+ unit buildings).
- At $3,906/mo this rent would consume 94% of the median local household income ($50k/yr) (locally 1734% of renters already pay >50% of income on rent) — very limited rent-growth headroom before tenants either downsize or default.
Forward outlook
- In year one you build about $23k of equity ($1k loan paydown + $22k appreciation (10.0% local appreciation)).
- Queens County population projected at +16% by 2050 — long-run rental-demand tailwind backs the buy-and-hold thesis.
- At projected returns (10.0% appreciation + 3.0% rent growth), your $60k cash investment doubles in ~2 years — after that, you're playing with house money.
- By year 2, paydown + projected appreciation supports a ~$37k cash-out refi (75% LTV) — recoverable capital for the next deal without selling this one.
Negotiation context
- It's been on market 453 days — a 12% lower offer ($189k) is reasonable based on typical stale-listing flexibility.
- 2 sale attempts; this cycle's ask has dropped $85k (28%) from the opening price — seller is motivated, your offer sets the floor, not the list.
Risks & watch-outs
- Watch-outs: flood insurance adds $427/mo.
- Climate carrying-cost: in FEMA flood zone AE (mandatory federal flood insurance); major wind risk, 77% chance of damaging wind over 30y; extreme-heat days projected 7→16/yr by 2055 (HVAC capex compounding) — expect insurance premiums to compound above CPI over the hold.
Questions for the listing agent
- It's been on market 453 days. Have you received any prior offers? Is the seller open to a 12% concession, seller financing, or rate buy-down credit?
- What's the actual annual flood-insurance premium (NFIP or private), and is the property in a SFHA with mandatory coverage?
- Why hasn't it sold? Are there any deal-killer items the seller is aware of (foundation, flood, title, zoning, code violations)?
- Is there a deadline driving the sale (1031 exchange, divorce, estate, relocation)? That informs how much negotiation room exists.
- Schools are B-rated — typically a magnet for longer-tenancy family renters. What's the average tenant stay here, and is there a school-zone premium baked into asking?
- Crime grade is F in this area — have there been break-ins, vandalism, or insurance claims at this property in the last 3 years? What carrier currently insures it and at what premium?
- What's the average days-on-market for RENTAL listings here right now (not sales)? A rising rental-DOM trend means longer vacancies and softer asking-rent achievability than the comps imply.
- What's the recent tenant-quality profile in this submarket — average credit score on applications, eviction rate, late-payment / NSF rate, and stable-employment percentage? A property-management company in the area should have these aggregated.
- How much new for-sale + rental construction is in the pipeline within 1–3 miles? Heavy new supply typically softens prices + rents 12–24 months out; constrained supply supports both.
Investment metrics
- 1% rule
- 1.82% ✓
- Cap rate
- 15.22%
- Cash-on-cash
- 31.89%
- DSCR
- 2.42
- GRM
- 4.6
CMA / ARV
- ARV (on-the-fly)
- $684,800
- Comps found
- 6
Show comp detail 6 sales within ~0.75 mi
| Address | Dist | Beds/Ba | Sqft | Sold | Price | $/sf | Match |
|---|---|---|---|---|---|---|---|
| 627 Beach 65th St | 0.39mi | 3/2.0 (-1) | 1,530 (-4%) | 1mo | $577,000 | $377 | 65 |
| 60-08 Beach Front Rd Unit 90A | 0.40mi | 3/2.0 (-1) | 1,500 (-6%) | 7mo | $749,000 | $499 | 56 |
| 440 Beach 46th St | 0.63mi | 4/2.0 | 1,572 (-2%) | 11mo | $575,000 | $366 | 55 |
| 439 Beach 69th St | 0.51mi | 3/2.5 (-1) | 1,530 (-4%) | 6mo | $600,000 | $392 | 52 |
| 64-07 Thursby Ave | 0.26mi | 3/2.0 (-1) | 1,402 (-12%) | 16mo | $600,000 | $428 | 45 |
| 516 Beach 72nd St | 0.61mi | 4/2.0 | 1,400 (-12%) | 10mo | $625,000 | $446 | 38 |
Match score weights: distance 35% · size 25% · config 20% · recency 20%. Top-matched comps best support the ARV.
Projected returns pro-forma
10.0% appreciation · 3.0% rent growth · sell at horizon
- IRR
- 41.9%
- Equity multiple
- 4.19×
- Total profit
- $192,150
- Equity at exit
- $193,689
- IRR
- 36.2%
- Equity multiple
- 9.43×
- Total profit
- $507,717
- Equity at exit
- $417,698
Cash invested: $60,200 (down + closing). Projections, not guarantees.
Landlord ↔ Tenant lean methodology
- Overall (CITY)
- 0 Strongly Tenant-Friendly
- State New York
- 15 Strongly Tenant-Friendly · D+10
- County
- — inherits STATE
- City New York
- 0 Strongly Tenant-Friendly · D+34
ZIP-level market 11692
- Home prices YoY
- 14.4%
- Active inventory
- 80
- Price-to-rent
- 4.6×
Monthly cashflow live
- Estimated rent
- $3,906 high interval (Pro) →
- Mortgage (P&I)
- −$1,127
- Tax est. 1.5%
- −$269 /mo · $3,225/yr
- Insurance
- −$90
- Flood insurance flood zone
- −$427 /mo · $5,118/yr
- HOA
- −$0
- Vacancy / Maint / Mgmt
- −$820
- Net cashflow
- $1,173
Break-even live
UW: 25.0% down · 7.5% · 30yr · 1.5% tax · 5.0% vac · 8.0% maint · 8.0% mgmt
Financing live
Cash to close
- Down payment
- $53,750
- Closing costs
- $6,450
- Reserves months
- —
- Total cash needed
- —
Loan-product check · same deal, 3 products live
Conventional
25% down · 7.5% · 30yr
- Down + closing
- —
- Monthly P&I
- —
- Monthly cashflow
- —
- DSCR
- —
- Eligible?
- —
Personal DTI + credit; lowest rate.
DSCR
20% down · 8.5% · 30yr
- Down + closing
- —
- Monthly P&I
- —
- Monthly cashflow
- —
- DSCR
- —
- Eligible?
- —
No personal income docs; deal must DSCR.
Hard money
10% down · 12.0% · 12mo
- Down + closing
- —
- Monthly P&I
- —
- Monthly cashflow
- —
- DSCR
- —
- Eligible?
- —
Short-term bridge; refi at stabilization.
Rent comps 5 comps
| Address | Beds | Baths | Sqft | Rent | $/sqft | DOM | Units | Dist |
|---|---|---|---|---|---|---|---|---|
| 6261 De Costa Ave Arverne, NY | 3.0 | 1.0 | 1117 | $3,250 | $2.91 | 4d | 1 | 0.31mi |
| 6935 Hessler Ave Arverne, NY | 3.0 | 1.5 | 1596 | $3,300 | $2.07 | 24d | 1 | 0.57mi |
| 325 Beach 46th St Far Rockaway, NY | 3.0 | 1.5 | 2250 | $3,100 | $1.38 | 24d | 1 | 0.61mi |
| 72-18 Elizabeth Ave Unit 2 Far Rockaway, NY | 3.0 | 2.0 | 1125 | $3,650 | $3.24 | 24d | 1 | 0.67mi |
| 75-18 Aquatic Dr Unit B Arverne, NY | 3.0 | 2.5 | 2034 | $3,500 | $1.72 | 24d | 1 | 0.86mi |
Listing history 16 events
-
2026-06-18days on market $215,000 Active 453 DOM
-
2026-06-17days on market $215,000 Active 452 DOM
-
2026-06-15days on market $215,000 Active 450 DOM
-
2026-06-13days on market $215,000 Active 448 DOM
-
2026-06-10days on market $215,000 Active 444 DOM
-
2026-06-08days on market $215,000 Active 443 DOM
-
2026-06-03days on market $215,000 Active 438 DOM
-
2026-06-01days on market $215,000 Active 436 DOM
-
2026-05-31days on market $215,000 Active 435 DOM
-
2026-03-26price $215,000
-
2026-03-26status Active
-
2026-03-25historical
-
2025-09-08price $225,000
-
2025-06-05price $300,000
-
2025-04-17price $320,000
-
2025-03-21$300,000 Active
ⓘ Source: listings_history table (triggers on properties + properties_extension) + one-shot
backfill from property_details.listing_events for pre-trigger history.
Climate risk First Street
- Flood 9/10 Extreme FEMA zone AE · 99% chance over 30 yrs
- Wildfire 1/10 Low
- Heat 6/10 Major 7 d/yr ≥96°F today · 16 d/yr by 30 yrs out
- Wind 6/10 Major 77% chance of damaging wind over 30 yrs
- Air quality 3/10 Moderate 4 unhealthy d/yr today · 4 by 30 yrs out
Nearby sold comps map
Loading sold comps map…
Walkable amenities ~0.75 mi
Loading nearby amenities…
Taxation est. · year 1
- Rental income
- $46,872
- − Mortgage interest
- −$12,043
- − Property taxes
- −$3,225
- − Insurance
- −$6,194
- − Repairs & maintenance
- −$3,750
- − Management
- −$3,750
- − Depreciation
- −$6,255
- Taxable income
- $11,656
- Est. tax owed @ 24.0%
- −$2,797
- After-tax cash flow
- $11,283/yr
For passive investors: Depreciation is non-cash, so a rental often shows a tax loss while cash-flowing — sheltering income. Rental losses are passive: they offset passive income freely, and up to $25,000/yr can offset ordinary (W-2) income if you actively participate and your MAGI is under $100k (phasing out to $0 by $150k); unused losses carry forward. On sale, claimed depreciation is recaptured at up to 25%, and gains may owe capital-gains tax (a 1031 exchange can defer both). Figures are a year-1 estimate at your 24.0% rate — not tax advice; consult a CPA.
Schools (NCES district)
No district data.
Livability — New York
- Score
- 75/100
- State rank
- #268
- US rank
- #4188
Category grades
Schools grade is shown separately in the Schools card above.
Census & demographics
- Census place
- New York, NY
- County
- Queens County · 1,914,869 people
- City population
- 7,731,280
- Metro
- New York-Newark-Jersey City, NY-NJ-PA
- Population (ZIP)
- 22,734
- Household income
- $49,720
- Rent vs Own
- Severe rent burden
- 1734.0
Population outlook (Queens County) Hauer SSP2
- Today (2025)
- 2,546,320 people
- By 2030
- 2,643,059 · +3.8%
- By 2040
- 2,815,563 · +10.6%
- By 2050
- 2,944,423 · +15.6%
- By 2075
- 3,123,338 · +22.7%
- By 2100
- 3,098,688 · +21.7%
Race, ethnicity, and origin ACS 2023
- Neighborhood character
- Diverse neighborhood (Simpson 0.64)
- Race & ethnicity
- Black 53% Hispanic / Latino 24% Two or more races 15% White 13% Asian 6%
- Hispanic origin (detail)
- Puerto Rican 10% Dominican 5%
- Common ancestry
- Romanian 1%
- Foreign-born
- 31% · Canada, China, Jamaica
- Languages at home
- 67% English-only · Spanish 18% Other Indo-European 3% Russian/Polish/Slavic 3%
Political lean MEDSL · Queens
- 2024 margin
- Strong D (+24.6) · D 62.3% · R 37.7%
- 2008→2024 swing
- -26.2pp toward R · 2008: 50.8pp · 2024: 24.6pp
- All cycles
- 2024: D+24.6 2020: D+45.2 2016: D+53.4 2012: D+58.5 2008: D+50.8
Not yet ingested
- Civics
- —
Market trends
- HPI YoY
- ▲ 44.49%
- Current HPI
- 354.2007
- Rent YoY
- —
- Metro
- New York-Newark-Jersey City, NY-NJ-PA
- State GDP YoY
- ▲ 2.60%
- F500 in state
- 92
Industry mix (Fortune 500 HQ in NY)
| Industry | F500 HQs | Revenue |
|---|---|---|
| Financial Services | 10 | $950B |
|
||
| Consumer Goods | 9 | $162B |
|
||
| Insurance | 4 | $225B |
|
||
| Telecommunications | 2 | $144B |
|
||
| Pharmaceuticals | 2 | $112B |
|
||
| Media / Entertainment | 2 | $69B |
|
||
Price history
-28.3% since first listed7 events — show timeline
- 2026-03-26 Price Changed $215,000 OneKey® MLS as Distributed by MLS Grid
- 2026-03-26 Relisted — OneKey® MLS as Distributed by MLS Grid
- 2026-03-25 Listing Removed — OneKey® MLS as Distributed by MLS Grid
- 2025-09-08 Price Changed $225,000 OneKey® MLS as Distributed by MLS Grid
- 2025-06-05 Price Changed $300,000 OneKey® MLS as Distributed by MLS Grid
- 2025-04-17 Price Changed $320,000 OneKey® MLS as Distributed by MLS Grid
- 2025-03-21 Listed $300,000 OneKey® MLS as Distributed by MLS Grid
Cash-flow waterfall
monthlySold comps — $/sqft
last 12 mo · ≤1 miLoading sold comps…