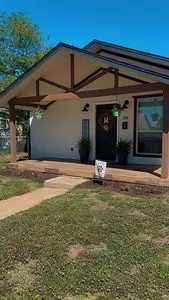
209 W Tenneppe · Fletcher, OK
Flood risk 1/10 · Minimal
- FEMA flood zone
- X (unshaded)
- Chance of flooding over 30 yrs
- 0.0%
- Est. flood insurance / yr
- $507 – $1,088
Fire risk 7/10 · Major
- Est. fire insurance / yr
- $2,463 – $4,575
Heat risk 6/10 · Moderate
- Hot days now (above 107°F)
- 7 days/yr
- Hot days in 30 yrs
- 19 days/yr
Wind risk 2/10 · Minimal
- Chance of severe wind over 30 yrs
- 4.0%
Air-quality risk 1/10 · Minimal
- Unhealthy air days now
- 0 days/yr
- Unhealthy air days in 30 yrs
- 0 days/yr
Risk factors via First Street. Map © Google.
Why this score? — see what drove the D- grade
The composite is a weighted blend of 9 inputs, each scored 0–100. Each bar is that input's sub-score; the figure is the points it added to the 100-point composite (weight × sub-score).
- Cash flow +12.7/30.0
- Appreciation +7.8/10.0
- DSCR +3.8/10.0
- Livability +3.2/5.0
- 1% rule +2.6/10.0
- Rent growth +2.5/5.0
- Condition / age +2.5/5.0
- Schools +1.6/10.0
- ARV discount +0.0/15.0
$135,000
🖨 Deal sheet 📄 Offer letter ✓ Due diligence
Listing remarks MLS
Cutest house ever!!!! This 3 bedroom, 1 bath home is so cute. All new kitchen cabinets with stainless steel appliances. The owner has installed soft close cabinet drawers. All new click lock vinyl flooring throughout the home. Gorgeous electric fireplace. It has a very charming covered front porch and a lovely patio. Call Sue @ 580-512-1942 or Century 21 @ 580-454-0025 for more information.
Key facts
- Storage shed
- Sits on 2 lots
- Good sized pantry
Tags
Neighborhood map
What this means for you Summary
Snapshot
- This is a 2-bed/1.0-bath single-family listed at $135k.
Deal economics
- At list price, monthly cash flow is $-15 ($-180/yr) — negative.
- To cash-flow at today's rent, offer at most $132k (2.0% below list).
- To meet the 1% rule (rent ≥ 1% of price), the offer needs to be $103k (23.5% below list).
- Recommended offer: $103k (23.5% below list) — sets the bar for 1% rule.
Location & tenants
- Location reads 65/100 on livability (#133 in OK) — a middle-class / working-renter tenant base. Strengths: crime A+, cost of living A+, housing A+; Watch: schools D, amenities F, commute F.
- Fletcher (rural): math 12% / reading 23% proficiency, ranked #189 of 270 in OK (top 70%) — low school quality limits family demand, transient renter base, plan for 1-2y turnover.
- Market conditions: 29 active listings in the ZIP; 133 units permitted in Comanche County in 2024 (0 in 5+ unit buildings).
Forward outlook
- In year one you build about $9k of equity ($933 loan paydown + $8k appreciation (5.7% local appreciation)).
- Comanche County population projected to shrink 3% by 2050 — rents likely to lag national; underwrite the cash flow, not the appreciation.
- At projected returns (5.7% appreciation + 3.0% rent growth), your $38k cash investment doubles in ~4 years — after that, you're playing with house money.
- By year 5, paydown + projected appreciation supports a ~$37k cash-out refi (75% LTV) — recoverable capital for the next deal without selling this one.
Negotiation context
- It's been on market 24 days — a 2% lower offer ($133k) is reasonable based on typical stale-listing flexibility.
- 3 sale attempts since 5y ago with the ask held roughly flat each time — persistent listings suggest the price (not the market) is what's stuck; bring a comps-based counter.
- Current owner paid $110k; 23% above their basis — modest negotiation headroom, anchor on the comps not their cost.
Risks & watch-outs
- Climate carrying-cost: major wildfire risk; extreme-heat days projected 7→19/yr by 2055 (HVAC capex compounding) — expect insurance premiums to compound above CPI over the hold.
Questions for the listing agent
- What do current leases actually rent for vs. the listed asking? Can we see a recent rent roll and the last 12 months of T-12 income?
- Is there a deadline driving the sale (1031 exchange, divorce, estate, relocation)? That informs how much negotiation room exists.
- Schools are D-rated, which usually means shorter tenancies and higher turnover. Who's the typical renter profile here, and what's been the actual vacancy rate?
- The area grade is low — what's the realistic commute time and amenity access for the typical tenant pool here? Any planned neighborhood developments (good or bad) we should know about?
- What's the average days-on-market for RENTAL listings here right now (not sales)? A rising rental-DOM trend means longer vacancies and softer asking-rent achievability than the comps imply.
- What's the recent tenant-quality profile in this submarket — average credit score on applications, eviction rate, late-payment / NSF rate, and stable-employment percentage? A property-management company in the area should have these aggregated.
- How much new for-sale + rental construction is in the pipeline within 1–3 miles? Heavy new supply typically softens prices + rents 12–24 months out; constrained supply supports both.
Investment metrics
- 1% rule
- 0.76% ✗
- Cap rate
- 6.16%
- Cash-on-cash
- -0.48%
- DSCR
- 0.98
- GRM
- 10.9
CMA / ARV
- ARV (on-the-fly)
- $113,184
- Comps found
- 1
Show comp detail 1 sale within ~0.75 mi
| Address | Dist | Beds/Ba | Sqft | Sold | Price | $/sf | Match |
|---|---|---|---|---|---|---|---|
| 414 N East Dr | 0.22mi | 3/1.0 (+1) | 900 (+4%) | 8mo | $118,000 | $131 | 71 |
Match score weights: distance 35% · size 25% · config 20% · recency 20%. Top-matched comps best support the ARV.
Projected returns pro-forma
5.65% appreciation · 3.0% rent growth · sell at horizon
- IRR
- 14.1%
- Equity multiple
- 1.93×
- Total profit
- $35,199
- Equity at exit
- $81,916
- IRR
- 14.6%
- Equity multiple
- 3.78×
- Total profit
- $104,984
- Equity at exit
- $146,068
Cash invested: $37,800 (down + closing). Projections, not guarantees.
Landlord ↔ Tenant lean methodology
- Overall (STATE)
- 83 Strongly Landlord-Friendly
- State Oklahoma
- 83 Strongly Landlord-Friendly · R+20
- County
- — inherits STATE
- City
- — inherits STATE
ZIP-level market 73541
- Home prices YoY
- 2.2%
- Active inventory
- 29
- Price-to-rent
- 10.9×
Monthly cashflow live
- Estimated rent
- $1,032 medium interval (Pro) →
- Mortgage (P&I)
- −$708
- Tax from tax record
- −$66 /mo · $798/yr
- Insurance
- −$56
- HOA
- −$0
- Vacancy / Maint / Mgmt
- −$217
- Net cashflow
- $-15
Break-even live
UW: 25.0% down · 7.5% · 30yr · 1.5% tax · 5.0% vac · 8.0% maint · 8.0% mgmt
Financing live
Cash to close
- Down payment
- $33,750
- Closing costs
- $4,050
- Reserves months
- —
- Total cash needed
- —
Loan-product check · same deal, 3 products live
Conventional
25% down · 7.5% · 30yr
- Down + closing
- —
- Monthly P&I
- —
- Monthly cashflow
- —
- DSCR
- —
- Eligible?
- —
Personal DTI + credit; lowest rate.
DSCR
20% down · 8.5% · 30yr
- Down + closing
- —
- Monthly P&I
- —
- Monthly cashflow
- —
- DSCR
- —
- Eligible?
- —
No personal income docs; deal must DSCR.
Hard money
10% down · 12.0% · 12mo
- Down + closing
- —
- Monthly P&I
- —
- Monthly cashflow
- —
- DSCR
- —
- Eligible?
- —
Short-term bridge; refi at stabilization.
Listing history 24 events
-
2026-06-19days on market $135,000 Active 24 DOM
-
2026-06-18days on market $135,000 Active 23 DOM
-
2026-06-17days on market $135,000 Active 22 DOM
-
2026-06-16days on market $135,000 Active 21 DOM
-
2026-06-15days on market $135,000 Active 20 DOM
-
2026-06-14days on market $135,000 Active 18 DOM
-
2026-06-13days on market $135,000 Active 17 DOM
-
2026-06-10days on market $135,000 Active 15 DOM
-
2026-06-09days on market $135,000 Active 14 DOM
-
2026-06-08days on market $135,000 Active 13 DOM
-
2026-06-07days on market $135,000 Active 12 DOM
-
2026-06-03days on market $135,000 Active 8 DOM
-
2026-06-02days on market $135,000 Active 7 DOM
-
2026-06-01days on market $135,000 Active 6 DOM
-
2026-05-31days on market $135,000 Active 5 DOM
-
2026-05-30days on market $135,000 Active 4 DOM
-
2026-05-26$135,000 Active
-
2022-09-15soldstatus $110,000 393-char remark
Show marketing remark (393 chars)
Cutest house ever!!!! This 3 bedroom, 1 bath home is so cute. All new kitchen cabinets with stainless steel appliances. The owner has installed soft close cabinet drawers. All new click lock vinyl flooring throughout the home. Gorgeous electric fireplace. It has a very charming covered front porch and a lovely patio. Call Sue @ 580-512-1942 or Century 21 @ 580-454-0025 for more information.
-
2022-07-07$125,000 393-char remark
Show marketing remark (393 chars)
Cutest house ever!!!! This 3 bedroom, 1 bath home is so cute. All new kitchen cabinets with stainless steel appliances. The owner has installed soft close cabinet drawers. All new click lock vinyl flooring throughout the home. Gorgeous electric fireplace. It has a very charming covered front porch and a lovely patio. Call Sue @ 580-512-1942 or Century 21 @ 580-454-0025 for more information.
-
2022-01-06soldstatus $8,500
-
2021-10-23$12,000
-
2000-07-03soldstatus $23,000
-
1998-07-13soldstatus $22,000
-
1995-08-02soldstatus $17,500
ⓘ Source: listings_history table (triggers on properties + properties_extension) + one-shot
backfill from property_details.listing_events for pre-trigger history.
Tax reassessment forecast OK · Resets to sale price
- Current annual tax
- $798 · $66/mo
- Projected year-2 tax
- $1,215 · $101/mo
- Expected delta
- +$417/yr (+$35/mo · 52.3%)
ⓘ Screening estimate from a state-policy table — verify with the county assessor before closing.
Climate risk First Street
- Flood 1/10 Low FEMA zone X (unshaded) · 0% chance over 30 yrs
- Wildfire 7/10 Severe
- Heat 6/10 Major 7 d/yr ≥107°F today · 19 d/yr by 30 yrs out
- Wind 2/10 Low 4% chance of damaging wind over 30 yrs
- Air quality 1/10 Low 0 unhealthy d/yr today · 0 by 30 yrs out
Nearby sold comps map
Loading sold comps map…
Walkable amenities ~0.75 mi
Loading nearby amenities…
Taxation est. · year 1
- Rental income
- $12,390
- − Mortgage interest
- −$7,562
- − Property taxes
- −$798
- − Insurance
- −$675
- − Repairs & maintenance
- −$991
- − Management
- −$991
- − Depreciation
- −$3,927
- Taxable loss
- −$2,555
- Est. tax savings @ 24.0%
- +$613
- After-tax cash flow
- $433/yr
For passive investors: Depreciation is non-cash, so a rental often shows a tax loss while cash-flowing — sheltering income. Rental losses are passive: they offset passive income freely, and up to $25,000/yr can offset ordinary (W-2) income if you actively participate and your MAGI is under $100k (phasing out to $0 by $150k); unused losses carry forward. On sale, claimed depreciation is recaptured at up to 25%, and gains may owe capital-gains tax (a 1031 exchange can defer both). Figures are a year-1 estimate at your 24.0% rate — not tax advice; consult a CPA.
Schools (NCES district)
- District
- Fletcher
- NCES district ID
- 4011700
- Math proficiency
- 12% ▼ -11.00%
- Reading proficiency
- 23% ▼ -10.00%
- Median HH income
- $50,233
- Composite
- 15.82/100
- National rank
- #9264
- State rank
- #189 of 270 in OK
Livability — Fletcher
- Score
- 65/100
- State rank
- #133
- US rank
- #12742
Category grades
Schools grade is shown separately in the Schools card above.
Census & demographics
- Census place
- Fletcher, OK
- Population (ZIP)
- 3,624
Population outlook (Comanche County) Hauer SSP2
- Today (2025)
- 124,518 people
- By 2030
- 124,231 · -0.2%
- By 2040
- 122,193 · -1.9%
- By 2050
- 120,368 · -3.3%
- By 2075
- 120,492 · -3.2%
- By 2100
- 123,113 · -1.1%
Race, ethnicity, and origin ACS 2023
- Neighborhood character
- Predominantly White (80%)
- Race & ethnicity
- White 80% Two or more races 12% Native American 4% Hispanic / Latino 3% Black 2%
- Common ancestry
- Italian 3% Lithuanian 2% Slovak 1%
- Foreign-born
- 2%
- Languages at home
- 97% English-only · Spanish 1%
Political lean MEDSL · Comanche
- 2024 margin
- Strong R (+23.3) · D 37.4% · R 60.7% · Other 1.9%
- 2008→2024 swing
- -5.8pp toward R · 2008: -17.5pp · 2024: -23.3pp
- All cycles
- 2024: R+23.3 2020: R+20.1 2016: R+23.7 2012: R+17.0 2008: R+17.5
Not yet ingested
- Civics
- —
Market trends
- HPI YoY
- ▲ 5.65%
- Current HPI
- 256.7598
- Rent YoY
- —
- Metro
- —
- State GDP YoY
- ▲ 1.55%
- F500 in state
- 6
Industry mix (Fortune 500 HQ in OK)
| Industry | F500 HQs | Revenue |
|---|---|---|
| Energy | 3 | $48B |
|
||
Price history
+671.4% since first listed8 events — show timeline
- 2026-05-26 Listed $135,000 FSBO.com
- 2022-09-15 Sold (MLS) $110,000 LBRMLS
- 2022-07-07 Listed $125,000 LBRMLS
- 2022-01-06 Sold (MLS) $8,500 LBRMLS
- 2021-10-23 Listed $12,000 LBRMLS
- 2000-07-03 Sold (Public Records) $23,000 Public Records
- 1998-07-13 Sold (Public Records) $22,000 Public Records
- 1995-08-02 Sold (Public Records) $17,500 Public Records
Property tax history
+10.6%/yrLatest (2025): $798 · +3.9% YoY. Source: county tax records.
Cash-flow waterfall
monthlySold comps — $/sqft
last 12 mo · ≤1 miLoading sold comps…