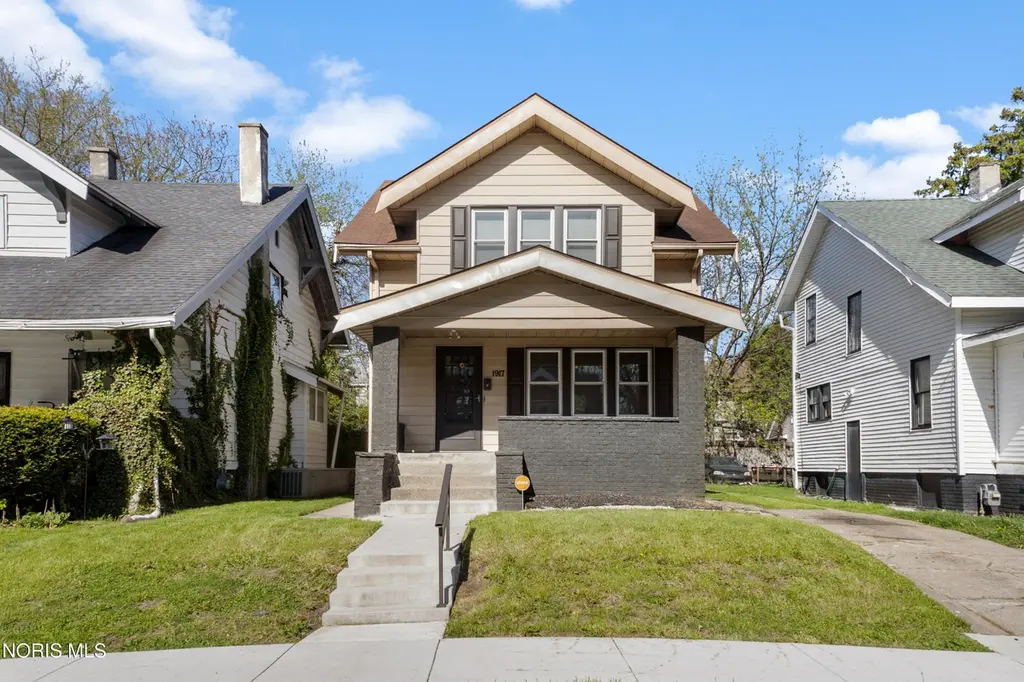
1917 Calumet Ave · Toledo, OH
Flood risk 1/10 · Minimal
- FEMA flood zone
- X (unshaded)
- Chance of flooding over 30 yrs
- 0.0%
- Est. flood insurance / yr
- $473 – $860
Fire risk 1/10 · Minimal
- Est. fire insurance / yr
- $713 – $1,323
Heat risk 3/10 · Minor
- Hot days now (above 101°F)
- 7 days/yr
- Hot days in 30 yrs
- 16 days/yr
Wind risk 2/10 · Minimal
- Chance of severe wind over 30 yrs
- —
Air-quality risk 2/10 · Minimal
- Unhealthy air days now
- 1 days/yr
- Unhealthy air days in 30 yrs
- 3 days/yr
Risk factors via First Street. Map © Google.
Why this score? — see what drove the B- grade
The composite is a weighted blend of 9 inputs, each scored 0–100. Each bar is that input's sub-score; the figure is the points it added to the 100-point composite (weight × sub-score).
- Cash flow +30.0/30.0
- DSCR +10.0/10.0
- 1% rule +8.1/10.0
- ARV discount +7.5/15.0
- Rent growth +4.5/5.0
- Livability +3.3/5.0
- Condition / age +2.5/5.0
- Schools +1.6/10.0
- Appreciation +0.0/10.0
$90,000
🖨 Deal sheet 📄 Offer letter ✓ Due diligence
Listing remarks
Beautifully updated Toledo home in a prime location near Ottawa Park, the University of Toledo, and just minutes from Franklin Park Mall, with easy access to shopping and dining. Features include all new windows and doors, newer central air and furnace (approx. 2 years old), updated kitchen cabinetry, and new flooring throughout the kitchen, living room, dining room, and bathroom. Previously rented for $1,050/month, offering strong potential for both homeowners and investors. Don't miss this opportunity!
Key facts
- New flooring
- 4,400 sq ft lot
- Garage
Tags
Property features AI
Finance
- HOA & community: Neighborhood features include curbs, street lights and sidewalks
Exterior
- Parking: Garage available; Driveway parking; On-street parking
- Security: Security system
- Utilities: Electricity available and connected; Natural gas available and connected; Public water; Public sewer
- Home design: Single-family house; Two stories; No shared/common walls
- Construction: Brick and vinyl siding exterior; Shingle roof; Concrete foundation; Built on two levels
- Exterior features: Front porch; City street frontage; Asphalt road surface; Curbs, street lights, sidewalks in the community
Interior
- Kitchen: Kitchen on main level
- Bedrooms: Three bedrooms (all on the upper level)
- Flooring: Carpet; Vinyl
- Bathrooms: One full bathroom
- Heating & cooling: Central heating (forced air); Central air conditioning; Ceiling fans provide additional cooling
- Interior features: Ceiling fans
- Laundry & utility: Laundry in basement
Neighborhood map
What this means for you Summary
Snapshot
- This is a 3-bed/1.0-bath single-family listed at $90k.
Deal economics
- At list price, monthly cash flow is $354 ($4k/yr) — positive.
- The deal already cash-flows at list — no discount required.
- Meets the 1% rule at list price ($1k rent vs $90k).
- Recommended offer: $89k (1.5% below list) — sets the bar for market timing.
- Cap rate 11.0% vs local median 7.6% in Toledo — top-decile yield for the area; either an underpriced asset or a hidden risk that comps aren't pricing in. Stress-test before assuming the spread holds.
Location & tenants
- Location reads 66/100 on livability (#645 in OH) — a middle-class / working-renter tenant base. Strengths: cost of living A+, housing A+, health & safety A+; Watch: amenities C-, schools D-, crime F.
- Toledo City (urban): math 15% / reading 24% proficiency, ranked #634 of 656 in OH (top 97%) — low school quality limits family demand, transient renter base, plan for 1-2y turnover; 72% free/reduced lunch — lower-income household profile, screen leases tightly.
- Market conditions: Rents rising fast (+8.2%/yr); 83 active listings in the ZIP; 29 comparable units currently listed for rent nearby; rentals lingering (median 44d on market — plan ~5-8 weeks vacancy on turnover, expect pricing pressure); 66% of comp listings sitting > 30 days — soft ceiling on asking rent; lower-income renter base — watch delinquency; 415 units permitted in Lucas County in 2024 (122 in 5+ unit buildings).
- This rent runs 34% of the median local income ($41k/yr) — at the standard rent-burdened threshold; future hikes will face affordability resistance.
Forward outlook
- Local home prices are declining (-3.0%/yr); year-one equity from $622 of loan paydown is wiped out by about $3k of value loss. Plan a longer hold.
- Lucas County population projected at -16% by 2050 — secular population decline; favor cash flow + early exit over multi-decade hold.
- At projected returns (-3.0% appreciation + 8.0% rent growth), your $25k cash investment doubles in ~6 years — after that, you're playing with house money.
Negotiation context
- It's been on market 29 days — a 2% lower offer ($89k) is reasonable based on typical stale-listing flexibility.
- 3 sale attempts with the ask held roughly flat each time — persistent listings suggest the price (not the market) is what's stuck; bring a comps-based counter.
Risks & watch-outs
- Watch-outs: built in 1915 — expect roof / HVAC / electrical / plumbing capex.
Questions for the listing agent
- Built in 1915 — when were the roof, HVAC, electrical panel, plumbing, and water heater last replaced?
- Is there a deadline driving the sale (1031 exchange, divorce, estate, relocation)? That informs how much negotiation room exists.
- Schools are D-rated, which usually means shorter tenancies and higher turnover. Who's the typical renter profile here, and what's been the actual vacancy rate?
- Crime grade is F in this area — have there been break-ins, vandalism, or insurance claims at this property in the last 3 years? What carrier currently insures it and at what premium?
- What's the average days-on-market for RENTAL listings here right now (not sales)? A rising rental-DOM trend means longer vacancies and softer asking-rent achievability than the comps imply.
- What's the recent tenant-quality profile in this submarket — average credit score on applications, eviction rate, late-payment / NSF rate, and stable-employment percentage? A property-management company in the area should have these aggregated.
- How much new for-sale + rental construction is in the pipeline within 1–3 miles? Heavy new supply typically softens prices + rents 12–24 months out; constrained supply supports both.
Investment metrics
- 1% rule
- 1.31% ✓
- Cap rate
- 11.01%
- Cash-on-cash
- 16.84%
- DSCR
- 1.75
- GRM
- 6.3
CMA / ARV
- ARV (median comp)
- $54,904
- List price
- $90,000
- Delta
- 63.92%
- Verdict
- OVERPRICED
- Comps
- 20 within 1.0 mi
Show comp detail 12 sales within ~0.75 mi
| Address | Dist | Beds/Ba | Sqft | Sold | Price | $/sf | Match |
|---|---|---|---|---|---|---|---|
| 2033 Crosswell Pl | 0.50mi | 3/1.0 | 1,328 (-2%) | 1mo | $101,500 | $76 | 72 |
| 1748 Freeman St | 0.40mi | 3/1.5 | 1,263 (-7%) | 2mo | $83,000 | $66 | 66 |
| 1501 Fernwood Ave | 0.44mi | 3/1.0 | 1,259 (-8%) | 1mo | $60,000 | $48 | 66 |
| 1938 Fernwood Ave | 0.36mi | 3/1.0 | 1,502 (+10%) | 3mo | $95,900 | $64 | 64 |
| 2242 Auburn Ave | 0.54mi | 3/1.0 | 1,241 (-9%) | 3mo | $85,000 | $68 | 57 |
| 1019 Woodstock Ave | 0.68mi | 3/1.0 | 1,272 (-7%) | 2mo | $21,100 | $17 | 55 |
| 2144 Hawthorne St | 0.38mi | 3/1.0 | 1,564 (+15%) | 3mo | $40,000 | $26 | 55 |
| 1004 Waverly Ave | 0.63mi | 3/1.0 | 1,241 (-9%) | 2mo | $58,500 | $47 | 54 |
| 1211 Manila St | 0.46mi | 3/1.0 | 1,159 (-15%) | 3mo | $45,000 | $39 | 51 |
| 1211 Woodstock Ave | 0.60mi | 3/1.0 | 1,188 (-13%) | 2mo | $101,500 | $85 | 49 |
| 1157 W Woodruff Ave | 0.70mi | 4/1.0 (+1) | 1,200 (-12%) | 2mo | $4,000 | $3 | 41 |
| 834 N Detroit Ave | 0.74mi | 4/1.0 (+1) | 1,552 (+14%) | 5mo | $35,000 | $23 | 33 |
Match score weights: distance 35% · size 25% · config 20% · recency 20%. Top-matched comps best support the ARV.
Projected returns pro-forma
-3.0% appreciation · 8.0% rent growth · sell at horizon
- IRR
- 13.3%
- Equity multiple
- 1.56×
- Total profit
- $14,180
- Equity at exit
- $13,419
- IRR
- 25.6%
- Equity multiple
- 3.77×
- Total profit
- $69,746
- Equity at exit
- $7,782
Cash invested: $25,200 (down + closing). Projections, not guarantees.
Landlord ↔ Tenant lean methodology
- Overall (STATE)
- 73 Landlord-Friendly
- State Ohio
- 73 Landlord-Friendly · R+6
- County
- — inherits STATE
- City
- — inherits STATE
ZIP-level market 43607
- Home prices YoY
- -27.5%
- Rents YoY
- 8.2%
- Active inventory
- 83
- Price-to-rent
- 6.3×
Monthly cashflow live
- Estimated rent
- $1,182 high interval (Pro) →
- Mortgage (P&I)
- −$472
- Tax from tax record
- −$70 /mo · $845/yr
- Insurance
- −$38
- HOA
- −$0
- Vacancy / Maint / Mgmt
- −$248
- Net cashflow
- $354
Break-even live
UW: 25.0% down · 7.5% · 30yr · 1.5% tax · 5.0% vac · 8.0% maint · 8.0% mgmt
Financing live
Cash to close
- Down payment
- $22,500
- Closing costs
- $2,700
- Reserves months
- —
- Total cash needed
- —
Loan-product check · same deal, 3 products live
Conventional
25% down · 7.5% · 30yr
- Down + closing
- —
- Monthly P&I
- —
- Monthly cashflow
- —
- DSCR
- —
- Eligible?
- —
Personal DTI + credit; lowest rate.
DSCR
20% down · 8.5% · 30yr
- Down + closing
- —
- Monthly P&I
- —
- Monthly cashflow
- —
- DSCR
- —
- Eligible?
- —
No personal income docs; deal must DSCR.
Hard money
10% down · 12.0% · 12mo
- Down + closing
- —
- Monthly P&I
- —
- Monthly cashflow
- —
- DSCR
- —
- Eligible?
- —
Short-term bridge; refi at stabilization.
Rent comps 29 comps
| Address | Beds | Baths | Sqft | Rent | $/sqft | DOM | Units | Dist |
|---|---|---|---|---|---|---|---|---|
| 2117 Clinton St Toledo, OH | 3.0 | 1.0 | 1256 | $1,115 | $0.89 | 43d | 1 | 0.23mi |
| 1738 Milburn Ave Toledo, OH | 2.0 | 1.0 | 1016 | $650 | $0.64 | 23d | 1 | 0.54mi |
| 2322 Upton Ave Toledo, OH | 3.0 | 1.0 | 1000 | $1,300 | $1.30 | 43d | 1 | 0.58mi |
| 1919 Ottawa Dr Unit 7 Toledo, OH | 2.0 | 1.0 | 900 | $800 | $0.89 | 43d | 1 | 0.67mi |
| 2356 Torrey Hill Dr Unit 11 Toledo, OH | 2.0 | 1.0 | 1050 | $800 | $0.76 | 43d | 1 | 0.68mi |
| 1133 Parkside Blvd Toledo, OH | 2.0 | 1.0 | 960 | $850 | $0.89 | 43d | 1 | 0.70mi |
| 915 Woodstock Ave Toledo, OH | 3.0 | 1.5 | 1500 | $1,100 | $0.73 | 23d | 1 | 0.73mi |
| 1140 Palmwood Ave Toledo, OH | 3.0 | 1.0 | 1292 | $1,500 | $1.16 | 43d | 1 | 0.84mi |
| 2037 Alvin St Toledo, OH | 3.0 | 1.0 | 1260 | $1,175 | $0.93 | 43d | 1 | 0.87mi |
| 2030 Wyndhurst Rd Toledo, OH | 2.0 | 1.0 | 1042 | $950 | $0.91 | 43d | 1 | 0.89mi |
| 1122 Pinewood Ave Toledo, OH | 3.0 | 1.0 | 1559 | $1,150 | $0.74 | 14d | 1 | 0.95mi |
| 2535 W Bancroft St Unit 8 Toledo, OH | 2.0 | 1.0 | 900 | $895 | $0.99 | 43d | 1 | 0.97mi |
| 1026 Oakwood Ave Toledo, OH | 2.0 | 1.0 | 1100 | $850 | $0.77 | 43d | 1 | 0.98mi |
| 1785 Tecumseh St Toledo, OH | 2.0 | 1.0 | 930 | $900 | $0.97 | 43d | 1 | 1.00mi |
| 1436 Palmetto Ave Toledo, OH | 3.0 | 1.0 | 1678 | $1,400 | $0.83 | 23d | 1 | 1.02mi |
| 2637 Greenway St Toledo, OH | 2.0 | 1.0 | 1082 | $900 | $0.83 | 43d | 1 | 1.04mi |
| 319 N Detroit Ave Toledo, OH | 3.0 | 1.0 | 1341 | $845 | $0.63 | 43d | 1 | 1.07mi |
| 3803 Monroe St Toledo, OH | 2.0 | 1.0 | 942 | $850 | $0.90 | 43d | 1 | 1.08mi |
| 2632 Algonquin Pkwy Toledo, OH | 3.0 | 1.5 | 1568 | $800 | $0.51 | 23d | 1 | 1.12mi |
| 3835 Monroe St Toledo, OH | 2.0 | 1.0 | 1002 | $950 | $0.95 | 43d | 1 | 1.14mi |
| 1573 Jermain Dr Toledo, OH | 3.0 | 1.0 | 1254 | $1,195 | $0.95 | 14d | 1 | 1.25mi |
| 960 W Delaware Ave Toledo, OH | 3.0 | 1.0 | 1224 | $1,050 | $0.86 | 23d | 1 | 1.28mi |
| 2734 Powhattan Pkwy Toledo, OH | 2.0 | 1.0 | 1144 | $900 | $0.79 | 43d | 1 | 1.30mi |
| 2447 Maplewood Ave Toledo, OH | 2.0 | 1.0 | 1538 | $897 | $0.58 | 43d | 1 | 1.35mi |
| 1804 Bigelow St Toledo, OH | 3.0 | 1.0 | 995 | $937 | $0.94 | 43d | 1 | 1.38mi |
| 1718 Giant St Toledo, OH | 3.0 | 1.0 | 1080 | $1,395 | $1.29 | 14d | 1 | 1.43mi |
| 1838 Giant St Toledo, OH | 3.0 | 1.0 | 962 | $1,200 | $1.25 | 14d | 1 | 1.43mi |
| 932 Turner Ave Toledo, OH | 2.0 | 1.0 | 960 | $1,295 | $1.35 | 14d | 1 | 1.47mi |
| 2650 Christie St Toledo, OH | 1.0–2.0 | 1.0 | 800 | $849 | $1.06 | 43d | 1 | 1.47mi |
Listing history 10 events
-
2026-06-03days on market $90,000 Active 29 DOM
-
2026-06-02days on market $90,000 Active 28 DOM
-
2026-06-01days on market $90,000 Active 27 DOM
-
2026-05-31days on market $90,000 Active 26 DOM
-
2026-05-30days on market $90,000 Active 25 DOM
-
2026-05-09historical Contingent 509-char remark
-
2026-05-05$90,000 Active 509-char remark
-
2026-05-04$90,000 Active
-
2026-05-04historical
-
2026-04-07historical
ⓘ Source: listings_history table (triggers on properties + properties_extension) + one-shot
backfill from property_details.listing_events for pre-trigger history.
Tax reassessment forecast OH · Partial reset (capped growth)
- Current annual tax
- $845 · $70/mo
- Projected year-2 tax
- $1,124 · $94/mo
- Expected delta
- +$280/yr (+$23/mo · 33.1%)
ⓘ Screening estimate from a state-policy table — verify with the county assessor before closing.
Climate risk First Street
- Flood 1/10 Low FEMA zone X (unshaded) · 0% chance over 30 yrs
- Wildfire 1/10 Low
- Heat 3/10 Moderate 7 d/yr ≥101°F today · 16 d/yr by 30 yrs out
- Wind 2/10 Low
- Air quality 2/10 Low 1 unhealthy d/yr today · 3 by 30 yrs out
Nearby sold comps map
Loading sold comps map…
Walkable amenities ~0.75 mi
Loading nearby amenities…
Taxation est. · year 1
- Rental income
- $14,181
- − Mortgage interest
- −$5,041
- − Property taxes
- −$845
- − Insurance
- −$450
- − Repairs & maintenance
- −$1,134
- − Management
- −$1,134
- − Depreciation
- −$2,618
- Taxable income
- $2,957
- Est. tax owed @ 24.0%
- −$710
- After-tax cash flow
- $3,535/yr
For passive investors: Depreciation is non-cash, so a rental often shows a tax loss while cash-flowing — sheltering income. Rental losses are passive: they offset passive income freely, and up to $25,000/yr can offset ordinary (W-2) income if you actively participate and your MAGI is under $100k (phasing out to $0 by $150k); unused losses carry forward. On sale, claimed depreciation is recaptured at up to 25%, and gains may owe capital-gains tax (a 1031 exchange can defer both). Figures are a year-1 estimate at your 24.0% rate — not tax advice; consult a CPA.
Schools (NCES district)
- District
- Toledo City
- NCES district ID
- 3904490
- Math proficiency
- 15% ▼ -16.00%
- Reading proficiency
- 24% ▼ -13.00%
- Median HH income
- $32,137
- Composite
- 15.76/100
- National rank
- #9276
- State rank
- #634 of 656 in OH
Livability — Toledo
- Score
- 66/100
- State rank
- #645
- US rank
- #11442
Category grades
Schools grade is shown separately in the Schools card above.
Census & demographics
- Census place
- Toledo, OH
- County
- Lucas County · 380,724 people
- City population
- 280,811
- Metro
- Toledo, OH
- Population (ZIP)
- 19,469
- Household income
- $41,335
- Rent vs Own
- Severe rent burden
- 1157.0
Population outlook (Lucas County) Hauer SSP2
- Today (2025)
- 420,751 people
- By 2030
- 410,187 · -2.5%
- By 2040
- 384,019 · -8.7%
- By 2050
- 355,125 · -15.6%
- By 2075
- 291,683 · -30.7%
- By 2100
- 233,670 · -44.5%
Race, ethnicity, and origin ACS 2023
- Neighborhood character
- Diverse neighborhood (Simpson 0.57)
- Race & ethnicity
- Black 59% White 27% Two or more races 6% Hispanic / Latino 6% Asian 3%
- Hispanic origin (detail)
- Mexican 3% Puerto Rican 2%
- Common ancestry
- Lithuanian 2% Romanian 2% Slovak 1%
- Foreign-born
- 4% · Canada
- Languages at home
- 94% English-only · Other Indo-European 1% Spanish 1% Russian/Polish/Slavic 1%
Political lean MEDSL · Lucas
- 2024 margin
- D (+12.6) · D 55.8% · R 43.2%
- 2008→2024 swing
- -18.9pp toward R · 2008: 31.4pp · 2024: 12.6pp
- All cycles
- 2024: D+12.6 2020: D+16.8 2016: D+17.4 2012: D+30.4 2008: D+31.4
Not yet ingested
- Civics
- —
Market trends
- HPI YoY
- ▼ -66.58%
- Current HPI
- 175.2772
- Rent YoY
- ▲ 8.19%
- Metro
- Toledo, OH
- State GDP YoY
- ▲ 1.98%
- F500 in state
- 48
Industry mix (Fortune 500 HQ in OH)
| Industry | F500 HQs | Revenue |
|---|---|---|
| Insurance | 3 | $145B |
|
||
| Industrial Machinery | 3 | $49B |
|
||
| Financial Services | 3 | $24B |
|
||
| Consumer Goods | 2 | $93B |
|
||
| Aerospace / Defense | 2 | $47B |
|
||
| Utilities | 2 | $33B |
|
||
Price history
+0.0% since first listed7 events — show timeline
- 2026-06-04 Listing Removed — NORIS
- 2026-05-21 Relisted — NORIS
- 2026-05-09 Contingent — NORIS
- 2026-05-05 Listed $90,000 NORIS
- 2026-05-04 Listed $90,000 NORIS
- 2026-05-04 Listing Removed — NORIS
- 2026-04-07 Coming Soon — NORIS
Property tax history
+15.9%/yrLatest (2025): $845 · +1.7% YoY. Source: county tax records.
Cash-flow waterfall
monthlySold comps — $/sqft
last 12 mo · ≤1 miLoading sold comps…